Free Statistics

of Irreproducible Research!

Author's title

Author*Unverified author*
R Software Modulerwasp_correlation.wasp
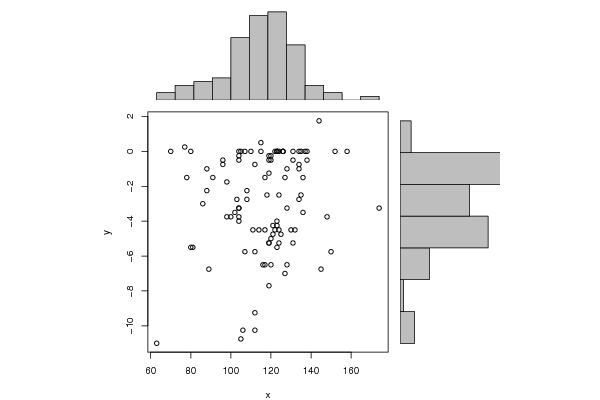
Title produced by softwarePearson Correlation
Date of computationTue, 06 Dec 2011 23:19:02 -0500
Cite this page as followsStatistical Computations at FreeStatistics.org, Office for Research Development and Education, URL https://freestatistics.org/blog/index.php?v=date/2011/Dec/06/t1323231665xyrke4ypc3td29x.htm/, Retrieved Mon, 29 Apr 2024 01:53:04 +0000
Statistical Computations at FreeStatistics.org, Office for Research Development and Education, URL https://freestatistics.org/blog/index.php?pk=152061, Retrieved Mon, 29 Apr 2024 01:53:04 +0000
QR Codes:

Original text written by user:Birth weight and refractive error
IsPrivate?No (this computation is public)
User-defined keywords
Estimated Impact75
Family? (F = Feedback message, R = changed R code, M = changed R Module, P = changed Parameters, D = changed Data)
-       [Pearson Correlation] [PM and SB IU Rese...] [2011-12-07 04:19:02] [d41d8cd98f00b204e9800998ecf8427e] [Current]
Feedback Forum

Post a new message
Dataseries X:
112
112
174
123
128
70
134
104
103
134
126
117
116
124
115
120
78
89
120
96
123
106
86
108
125
136
121
80
132
102
104
105
134
88
123
108
144
145
63
121
107
122
80
117
91
150
119
104
105
152
126
114
104
98
138
122
115
138
127
118
131
107
131
104
110
126
119
124
135
136
134
135
128
112
123
120
127
124
123
104
119
111
98
119
77
128
130
124
148
158
131
120
96
137
81
104
112
100
119
88
117
123
119
Dataseries Y:
-5.75
-10.25
-3.25
-4
-6.5
0
-0.75
0
-2.75
-1
0
-6.5
-6.5
0
0.5
-6.5
-1.5
-6.75
-0.25
-0.5
-5.5
-10.25
-3
-2.75
-4.75
-1.5
-4.25
-5.5
-4.5
-3.5
-3.25
0
-2.75
-2.25
0
-2.25
1.75
-6.75
-11
-4.75
0
0
0
-4.5
-1.5
-5.75
-7.7
-4
-10.75
0
0
-4.5
-0.5
-3.75
-0.5
-4.5
0
0
-1.5
-2.5
-5.25
-5.75
0
-0.25
0
0
-5.25
-4.5
-2.5
-3.5
0
0
-3.25
-9.25
0
-0.5
-7
-2.5
0
-3.25
-1.25
-4.5
-1.75
-0.5
0.25
-1
-4.5
-5.25
-3.75
0
-0.5
-5
-0.75
0
-5.5
-3.75
-0.75
-3.75
-5.25
-1
-1.5
-4.25
-0.25


Summary of computational transaction
Raw Inputview raw input (R code)
Raw Outputview raw output of R engine
Computing time0 seconds
R Server'Gertrude Mary Cox' @ cox.wessa.net

\begin{tabular}{lllllllll}
\hline
Summary of computational transaction \tabularnewline
Raw Input & view raw input (R code)  \tabularnewline
Raw Output & view raw output of R engine  \tabularnewline
Computing time & 0 seconds \tabularnewline
R Server & 'Gertrude Mary Cox' @ cox.wessa.net \tabularnewline
\hline
\end{tabular}
%Source: https://freestatistics.org/blog/index.php?pk=152061&T=0

[TABLE]
[ROW][C]Summary of computational transaction[/C][/ROW]
[ROW][C]Raw Input[/C][C]view raw input (R code) [/C][/ROW]
[ROW][C]Raw Output[/C][C]view raw output of R engine [/C][/ROW]
[ROW][C]Computing time[/C][C]0 seconds[/C][/ROW]
[ROW][C]R Server[/C][C]'Gertrude Mary Cox' @ cox.wessa.net[/C][/ROW]
[/TABLE]
Source: https://freestatistics.org/blog/index.php?pk=152061&T=0

Globally Unique Identifier (entire table): ba.freestatistics.org/blog/index.php?pk=152061&T=0

As an alternative you can also use a QR Code:  

The GUIDs for individual cells are displayed in the table below:

Summary of computational transaction
Raw Inputview raw input (R code)
Raw Outputview raw output of R engine
Computing time0 seconds
R Server'Gertrude Mary Cox' @ cox.wessa.net


Pearson Product Moment Correlation - Ungrouped Data
StatisticVariable XVariable Y
Mean116.582524271845-2.89514563106796
Biased Variance356.9810538222268.02628711471392
Biased Standard Deviation18.89394225200842.83307026293276
Covariance7.07214448886351
Correlation0.130838074120982
Determination0.0171186016396877
T-Test1.32630764158296
p-value (2 sided)0.18772919551234
p-value (1 sided)0.0938645977561698
Degrees of Freedom101
Number of Observations103

\begin{tabular}{lllllllll}
\hline
Pearson Product Moment Correlation - Ungrouped Data \tabularnewline
Statistic & Variable X & Variable Y \tabularnewline
Mean & 116.582524271845 & -2.89514563106796 \tabularnewline
Biased Variance & 356.981053822226 & 8.02628711471392 \tabularnewline
Biased Standard Deviation & 18.8939422520084 & 2.83307026293276 \tabularnewline
Covariance & 7.07214448886351 \tabularnewline
Correlation & 0.130838074120982 \tabularnewline
Determination & 0.0171186016396877 \tabularnewline
T-Test & 1.32630764158296 \tabularnewline
p-value (2 sided) & 0.18772919551234 \tabularnewline
p-value (1 sided) & 0.0938645977561698 \tabularnewline
Degrees of Freedom & 101 \tabularnewline
Number of Observations & 103 \tabularnewline
\hline
\end{tabular}
%Source: https://freestatistics.org/blog/index.php?pk=152061&T=1

[TABLE]
[ROW][C]Pearson Product Moment Correlation - Ungrouped Data[/C][/ROW]
[ROW][C]Statistic[/C][C]Variable X[/C][C]Variable Y[/C][/ROW]
[ROW][C]Mean[/C][C]116.582524271845[/C][C]-2.89514563106796[/C][/ROW]
[ROW][C]Biased Variance[/C][C]356.981053822226[/C][C]8.02628711471392[/C][/ROW]
[ROW][C]Biased Standard Deviation[/C][C]18.8939422520084[/C][C]2.83307026293276[/C][/ROW]
[ROW][C]Covariance[/C][C]7.07214448886351[/C][/ROW]
[ROW][C]Correlation[/C][C]0.130838074120982[/C][/ROW]
[ROW][C]Determination[/C][C]0.0171186016396877[/C][/ROW]
[ROW][C]T-Test[/C][C]1.32630764158296[/C][/ROW]
[ROW][C]p-value (2 sided)[/C][C]0.18772919551234[/C][/ROW]
[ROW][C]p-value (1 sided)[/C][C]0.0938645977561698[/C][/ROW]
[ROW][C]Degrees of Freedom[/C][C]101[/C][/ROW]
[ROW][C]Number of Observations[/C][C]103[/C][/ROW]
[/TABLE]
Source: https://freestatistics.org/blog/index.php?pk=152061&T=1

Globally Unique Identifier (entire table): ba.freestatistics.org/blog/index.php?pk=152061&T=1

As an alternative you can also use a QR Code:  

The GUIDs for individual cells are displayed in the table below:

Pearson Product Moment Correlation - Ungrouped Data
StatisticVariable XVariable Y
Mean116.582524271845-2.89514563106796
Biased Variance356.9810538222268.02628711471392
Biased Standard Deviation18.89394225200842.83307026293276
Covariance7.07214448886351
Correlation0.130838074120982
Determination0.0171186016396877
T-Test1.32630764158296
p-value (2 sided)0.18772919551234
p-value (1 sided)0.0938645977561698
Degrees of Freedom101
Number of Observations103


Parameters (Session):
Parameters (R input):
R code (references can be found in the software module):
bitmap(file='test1.png')
histx <- hist(x, plot=FALSE)
histy <- hist(y, plot=FALSE)
maxcounts <- max(c(histx$counts, histx$counts))
xrange <- c(min(x),max(x))
yrange <- c(min(y),max(y))
nf <- layout(matrix(c(2,0,1,3),2,2,byrow=TRUE), c(3,1), c(1,3), TRUE)
par(mar=c(4,4,1,1))
plot(x, y, xlim=xrange, ylim=yrange, xlab=xlab, ylab=ylab)
par(mar=c(0,4,1,1))
barplot(histx$counts, axes=FALSE, ylim=c(0, maxcounts), space=0)
par(mar=c(4,0,1,1))
barplot(histy$counts, axes=FALSE, xlim=c(0, maxcounts), space=0, horiz=TRUE)
dev.off()
lx = length(x)
makebiased = (lx-1)/lx
varx = var(x)*makebiased
vary = var(y)*makebiased
corxy <- cor.test(x,y,method='pearson')
cxy <- as.matrix(corxy$estimate)[1,1]
load(file='createtable')
a<-table.start()
a<-table.row.start(a)
a<-table.element(a,'Pearson Product Moment Correlation - Ungrouped Data',3,TRUE)
a<-table.row.end(a)
a<-table.row.start(a)
a<-table.element(a,'Statistic',1,TRUE)
a<-table.element(a,'Variable X',1,TRUE)
a<-table.element(a,'Variable Y',1,TRUE)
a<-table.row.end(a)
a<-table.row.start(a)
a<-table.element(a,hyperlink('arithmetic_mean.htm','Mean',''),header=TRUE)
a<-table.element(a,mean(x))
a<-table.element(a,mean(y))
a<-table.row.end(a)
a<-table.row.start(a)
a<-table.element(a,hyperlink('biased.htm','Biased Variance',''),header=TRUE)
a<-table.element(a,varx)
a<-table.element(a,vary)
a<-table.row.end(a)
a<-table.row.start(a)
a<-table.element(a,hyperlink('biased1.htm','Biased Standard Deviation',''),header=TRUE)
a<-table.element(a,sqrt(varx))
a<-table.element(a,sqrt(vary))
a<-table.row.end(a)
a<-table.row.start(a)
a<-table.element(a,hyperlink('covariance.htm','Covariance',''),header=TRUE)
a<-table.element(a,cov(x,y),2)
a<-table.row.end(a)
a<-table.row.start(a)
a<-table.element(a,hyperlink('pearson_correlation.htm','Correlation',''),header=TRUE)
a<-table.element(a,cxy,2)
a<-table.row.end(a)
a<-table.row.start(a)
a<-table.element(a,hyperlink('coeff_of_determination.htm','Determination',''),header=TRUE)
a<-table.element(a,cxy*cxy,2)
a<-table.row.end(a)
a<-table.row.start(a)
a<-table.element(a,hyperlink('ttest_statistic.htm','T-Test',''),header=TRUE)
a<-table.element(a,as.matrix(corxy$statistic)[1,1],2)
a<-table.row.end(a)
a<-table.row.start(a)
a<-table.element(a,'p-value (2 sided)',header=TRUE)
a<-table.element(a,(p2 <- as.matrix(corxy$p.value)[1,1]),2)
a<-table.row.end(a)
a<-table.row.start(a)
a<-table.element(a,'p-value (1 sided)',header=TRUE)
a<-table.element(a,p2/2,2)
a<-table.row.end(a)
a<-table.row.start(a)
a<-table.element(a,'Degrees of Freedom',header=TRUE)
a<-table.element(a,lx-2,2)
a<-table.row.end(a)
a<-table.row.start(a)
a<-table.element(a,'Number of Observations',header=TRUE)
a<-table.element(a,lx,2)
a<-table.row.end(a)
a<-table.end(a)
table.save(a,file='mytable.tab')