Free Statistics

of Irreproducible Research!

Author's title

Author*The author of this computation has been verified*
R Software Modulerwasp_arimaforecasting.wasp
Title produced by softwareARIMA Forecasting
Date of computationTue, 06 Dec 2011 13:05:16 -0500
Cite this page as followsStatistical Computations at FreeStatistics.org, Office for Research Development and Education, URL https://freestatistics.org/blog/index.php?v=date/2011/Dec/06/t1323194734entv0z0pqf96q49.htm/, Retrieved Sun, 28 Apr 2024 23:37:13 +0000
Statistical Computations at FreeStatistics.org, Office for Research Development and Education, URL https://freestatistics.org/blog/index.php?pk=151761, Retrieved Sun, 28 Apr 2024 23:37:13 +0000
QR Codes:

Original text written by user:
IsPrivate?No (this computation is public)
User-defined keywords
Estimated Impact85
Family? (F = Feedback message, R = changed R code, M = changed R Module, P = changed Parameters, D = changed Data)
-     [Spectral Analysis] [WS 9 - Spectrum A...] [2011-12-06 15:50:47] [ae1339cb5a7cf28362d01e7220b4a16c]
- RMP     [ARIMA Forecasting] [WS 9 Arima - Fore...] [2011-12-06 18:05:16] [e598b5cd83fcb010b35e92a01f5e81e9] [Current]
Feedback Forum

Post a new message
Dataseries X:
6827
6178
7084
8162
8462
9644
10466
10748
9963
8194
6848
7027
7269
6775
7819
8371
9069
10248
11030
10882
10333
9109
7685
7602
8350
7829
8829
9948
10638
11253
11424
11391
10665
9396
7775
7933
8186
7444
8484
9864
10252
12282
11637
11577
12417
9637
8094
9280
8334
7899
9994
10078
10801
12950
12222
12246
13281
10366
8730
9614
8639
8772
10894
10455
11179
10588
10794
12770
13812
10857
9290
10925
9491
8919
11607
8852
12537
14759
13667
13731
15110
12185
10645
12161
10840
10436
13589
13402
13103
14933
14147
14057
16234
12389
11595
12772


Summary of computational transaction
Raw Inputview raw input (R code)
Raw Outputview raw output of R engine
Computing time6 seconds
R Server'George Udny Yule' @ yule.wessa.net

\begin{tabular}{lllllllll}
\hline
Summary of computational transaction \tabularnewline
Raw Input & view raw input (R code)  \tabularnewline
Raw Output & view raw output of R engine  \tabularnewline
Computing time & 6 seconds \tabularnewline
R Server & 'George Udny Yule' @ yule.wessa.net \tabularnewline
\hline
\end{tabular}
%Source: https://freestatistics.org/blog/index.php?pk=151761&T=0

[TABLE]
[ROW][C]Summary of computational transaction[/C][/ROW]
[ROW][C]Raw Input[/C][C]view raw input (R code) [/C][/ROW]
[ROW][C]Raw Output[/C][C]view raw output of R engine [/C][/ROW]
[ROW][C]Computing time[/C][C]6 seconds[/C][/ROW]
[ROW][C]R Server[/C][C]'George Udny Yule' @ yule.wessa.net[/C][/ROW]
[/TABLE]
Source: https://freestatistics.org/blog/index.php?pk=151761&T=0

Globally Unique Identifier (entire table): ba.freestatistics.org/blog/index.php?pk=151761&T=0

As an alternative you can also use a QR Code:  

The GUIDs for individual cells are displayed in the table below:

Summary of computational transaction
Raw Inputview raw input (R code)
Raw Outputview raw output of R engine
Computing time6 seconds
R Server'George Udny Yule' @ yule.wessa.net


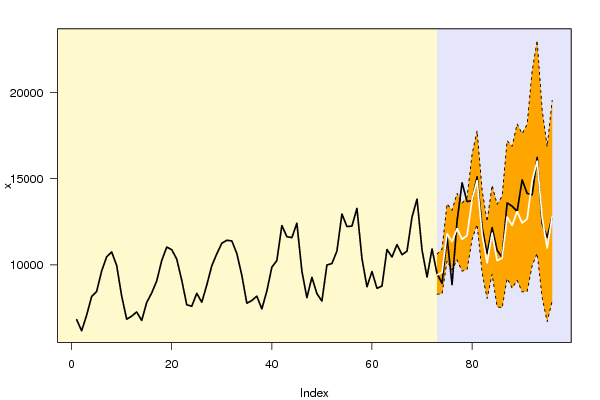
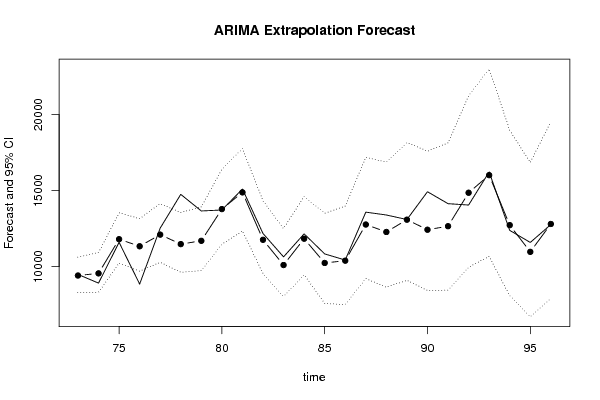
Univariate ARIMA Extrapolation Forecast
timeY[t]F[t]95% LB95% UBp-value(H0: Y[t] = F[t])P(F[t]>Y[t-1])P(F[t]>Y[t-s])P(F[t]>Y[72])
609614-------
618639-------
628772-------
6310894-------
6410455-------
6511179-------
6610588-------
6710794-------
6812770-------
6913812-------
7010857-------
719290-------
7210925-------
7394919417.80928302.205310634.33760.45310.00760.89520.0076
7489199559.07368313.888210929.27460.17990.53880.86990.0254
751160711808.220210236.500913541.54010.410.99950.84940.841
76885211343.58579706.254713165.0970.00370.38840.83050.6738
771253712109.693510286.90414147.36110.34050.99910.81470.8728
781475911484.3869633.37313571.04790.0010.16140.80010.7004
791366711702.4099734.390913933.32540.04220.00360.78760.7527
801373113790.422511477.812616410.97150.48230.53680.77730.9839
811511014889.340112346.895317777.35940.44050.78410.76770.9964
821218511769.07199543.476314334.75190.37530.00540.7570.7405
831064510108.90438047.050212514.80290.33120.04540.74770.2531
841216111841.01839456.191814617.94480.41070.80070.7410.741
851084010244.48327571.938613516.08720.36060.12540.67420.3417
861043610394.29797506.790113981.55430.49090.40380.78990.3859
871358912774.83769216.066317199.05810.35920.84990.69760.7938
881340212283.73418645.53116877.85640.31660.28880.92840.7189
891310313093.31529103.265518170.61080.49850.45260.5850.7987
901493312432.58978432.369417602.22780.17160.39970.18890.7162
911414712663.0278455.185218154.12670.29820.20890.360.7325
921405714866.59759963.669821249.96780.40180.58740.63630.8869
931623416024.169110675.165623014.27350.47650.70940.60120.9236
941238912733.47168091.929218977.54210.45690.13590.56830.7149
951159510977.04866710.449116853.30720.41840.31880.54410.5069
961277212809.4927898.26919538.5510.49560.63820.57490.7085

\begin{tabular}{lllllllll}
\hline
Univariate ARIMA Extrapolation Forecast \tabularnewline
time & Y[t] & F[t] & 95% LB & 95% UB & p-value(H0: Y[t] = F[t]) & P(F[t]>Y[t-1]) & P(F[t]>Y[t-s]) & P(F[t]>Y[72]) \tabularnewline
60 & 9614 & - & - & - & - & - & - & - \tabularnewline
61 & 8639 & - & - & - & - & - & - & - \tabularnewline
62 & 8772 & - & - & - & - & - & - & - \tabularnewline
63 & 10894 & - & - & - & - & - & - & - \tabularnewline
64 & 10455 & - & - & - & - & - & - & - \tabularnewline
65 & 11179 & - & - & - & - & - & - & - \tabularnewline
66 & 10588 & - & - & - & - & - & - & - \tabularnewline
67 & 10794 & - & - & - & - & - & - & - \tabularnewline
68 & 12770 & - & - & - & - & - & - & - \tabularnewline
69 & 13812 & - & - & - & - & - & - & - \tabularnewline
70 & 10857 & - & - & - & - & - & - & - \tabularnewline
71 & 9290 & - & - & - & - & - & - & - \tabularnewline
72 & 10925 & - & - & - & - & - & - & - \tabularnewline
73 & 9491 & 9417.8092 & 8302.2053 & 10634.3376 & 0.4531 & 0.0076 & 0.8952 & 0.0076 \tabularnewline
74 & 8919 & 9559.0736 & 8313.8882 & 10929.2746 & 0.1799 & 0.5388 & 0.8699 & 0.0254 \tabularnewline
75 & 11607 & 11808.2202 & 10236.5009 & 13541.5401 & 0.41 & 0.9995 & 0.8494 & 0.841 \tabularnewline
76 & 8852 & 11343.5857 & 9706.2547 & 13165.097 & 0.0037 & 0.3884 & 0.8305 & 0.6738 \tabularnewline
77 & 12537 & 12109.6935 & 10286.904 & 14147.3611 & 0.3405 & 0.9991 & 0.8147 & 0.8728 \tabularnewline
78 & 14759 & 11484.386 & 9633.373 & 13571.0479 & 0.001 & 0.1614 & 0.8001 & 0.7004 \tabularnewline
79 & 13667 & 11702.409 & 9734.3909 & 13933.3254 & 0.0422 & 0.0036 & 0.7876 & 0.7527 \tabularnewline
80 & 13731 & 13790.4225 & 11477.8126 & 16410.9715 & 0.4823 & 0.5368 & 0.7773 & 0.9839 \tabularnewline
81 & 15110 & 14889.3401 & 12346.8953 & 17777.3594 & 0.4405 & 0.7841 & 0.7677 & 0.9964 \tabularnewline
82 & 12185 & 11769.0719 & 9543.4763 & 14334.7519 & 0.3753 & 0.0054 & 0.757 & 0.7405 \tabularnewline
83 & 10645 & 10108.9043 & 8047.0502 & 12514.8029 & 0.3312 & 0.0454 & 0.7477 & 0.2531 \tabularnewline
84 & 12161 & 11841.0183 & 9456.1918 & 14617.9448 & 0.4107 & 0.8007 & 0.741 & 0.741 \tabularnewline
85 & 10840 & 10244.4832 & 7571.9386 & 13516.0872 & 0.3606 & 0.1254 & 0.6742 & 0.3417 \tabularnewline
86 & 10436 & 10394.2979 & 7506.7901 & 13981.5543 & 0.4909 & 0.4038 & 0.7899 & 0.3859 \tabularnewline
87 & 13589 & 12774.8376 & 9216.0663 & 17199.0581 & 0.3592 & 0.8499 & 0.6976 & 0.7938 \tabularnewline
88 & 13402 & 12283.7341 & 8645.531 & 16877.8564 & 0.3166 & 0.2888 & 0.9284 & 0.7189 \tabularnewline
89 & 13103 & 13093.3152 & 9103.2655 & 18170.6108 & 0.4985 & 0.4526 & 0.585 & 0.7987 \tabularnewline
90 & 14933 & 12432.5897 & 8432.3694 & 17602.2278 & 0.1716 & 0.3997 & 0.1889 & 0.7162 \tabularnewline
91 & 14147 & 12663.027 & 8455.1852 & 18154.1267 & 0.2982 & 0.2089 & 0.36 & 0.7325 \tabularnewline
92 & 14057 & 14866.5975 & 9963.6698 & 21249.9678 & 0.4018 & 0.5874 & 0.6363 & 0.8869 \tabularnewline
93 & 16234 & 16024.1691 & 10675.1656 & 23014.2735 & 0.4765 & 0.7094 & 0.6012 & 0.9236 \tabularnewline
94 & 12389 & 12733.4716 & 8091.9292 & 18977.5421 & 0.4569 & 0.1359 & 0.5683 & 0.7149 \tabularnewline
95 & 11595 & 10977.0486 & 6710.4491 & 16853.3072 & 0.4184 & 0.3188 & 0.5441 & 0.5069 \tabularnewline
96 & 12772 & 12809.492 & 7898.269 & 19538.551 & 0.4956 & 0.6382 & 0.5749 & 0.7085 \tabularnewline
\hline
\end{tabular}
%Source: https://freestatistics.org/blog/index.php?pk=151761&T=1

[TABLE]
[ROW][C]Univariate ARIMA Extrapolation Forecast[/C][/ROW]
[ROW][C]time[/C][C]Y[t][/C][C]F[t][/C][C]95% LB[/C][C]95% UB[/C][C]p-value(H0: Y[t] = F[t])[/C][C]P(F[t]>Y[t-1])[/C][C]P(F[t]>Y[t-s])[/C][C]P(F[t]>Y[72])[/C][/ROW]
[ROW][C]60[/C][C]9614[/C][C]-[/C][C]-[/C][C]-[/C][C]-[/C][C]-[/C][C]-[/C][C]-[/C][/ROW]
[ROW][C]61[/C][C]8639[/C][C]-[/C][C]-[/C][C]-[/C][C]-[/C][C]-[/C][C]-[/C][C]-[/C][/ROW]
[ROW][C]62[/C][C]8772[/C][C]-[/C][C]-[/C][C]-[/C][C]-[/C][C]-[/C][C]-[/C][C]-[/C][/ROW]
[ROW][C]63[/C][C]10894[/C][C]-[/C][C]-[/C][C]-[/C][C]-[/C][C]-[/C][C]-[/C][C]-[/C][/ROW]
[ROW][C]64[/C][C]10455[/C][C]-[/C][C]-[/C][C]-[/C][C]-[/C][C]-[/C][C]-[/C][C]-[/C][/ROW]
[ROW][C]65[/C][C]11179[/C][C]-[/C][C]-[/C][C]-[/C][C]-[/C][C]-[/C][C]-[/C][C]-[/C][/ROW]
[ROW][C]66[/C][C]10588[/C][C]-[/C][C]-[/C][C]-[/C][C]-[/C][C]-[/C][C]-[/C][C]-[/C][/ROW]
[ROW][C]67[/C][C]10794[/C][C]-[/C][C]-[/C][C]-[/C][C]-[/C][C]-[/C][C]-[/C][C]-[/C][/ROW]
[ROW][C]68[/C][C]12770[/C][C]-[/C][C]-[/C][C]-[/C][C]-[/C][C]-[/C][C]-[/C][C]-[/C][/ROW]
[ROW][C]69[/C][C]13812[/C][C]-[/C][C]-[/C][C]-[/C][C]-[/C][C]-[/C][C]-[/C][C]-[/C][/ROW]
[ROW][C]70[/C][C]10857[/C][C]-[/C][C]-[/C][C]-[/C][C]-[/C][C]-[/C][C]-[/C][C]-[/C][/ROW]
[ROW][C]71[/C][C]9290[/C][C]-[/C][C]-[/C][C]-[/C][C]-[/C][C]-[/C][C]-[/C][C]-[/C][/ROW]
[ROW][C]72[/C][C]10925[/C][C]-[/C][C]-[/C][C]-[/C][C]-[/C][C]-[/C][C]-[/C][C]-[/C][/ROW]
[ROW][C]73[/C][C]9491[/C][C]9417.8092[/C][C]8302.2053[/C][C]10634.3376[/C][C]0.4531[/C][C]0.0076[/C][C]0.8952[/C][C]0.0076[/C][/ROW]
[ROW][C]74[/C][C]8919[/C][C]9559.0736[/C][C]8313.8882[/C][C]10929.2746[/C][C]0.1799[/C][C]0.5388[/C][C]0.8699[/C][C]0.0254[/C][/ROW]
[ROW][C]75[/C][C]11607[/C][C]11808.2202[/C][C]10236.5009[/C][C]13541.5401[/C][C]0.41[/C][C]0.9995[/C][C]0.8494[/C][C]0.841[/C][/ROW]
[ROW][C]76[/C][C]8852[/C][C]11343.5857[/C][C]9706.2547[/C][C]13165.097[/C][C]0.0037[/C][C]0.3884[/C][C]0.8305[/C][C]0.6738[/C][/ROW]
[ROW][C]77[/C][C]12537[/C][C]12109.6935[/C][C]10286.904[/C][C]14147.3611[/C][C]0.3405[/C][C]0.9991[/C][C]0.8147[/C][C]0.8728[/C][/ROW]
[ROW][C]78[/C][C]14759[/C][C]11484.386[/C][C]9633.373[/C][C]13571.0479[/C][C]0.001[/C][C]0.1614[/C][C]0.8001[/C][C]0.7004[/C][/ROW]
[ROW][C]79[/C][C]13667[/C][C]11702.409[/C][C]9734.3909[/C][C]13933.3254[/C][C]0.0422[/C][C]0.0036[/C][C]0.7876[/C][C]0.7527[/C][/ROW]
[ROW][C]80[/C][C]13731[/C][C]13790.4225[/C][C]11477.8126[/C][C]16410.9715[/C][C]0.4823[/C][C]0.5368[/C][C]0.7773[/C][C]0.9839[/C][/ROW]
[ROW][C]81[/C][C]15110[/C][C]14889.3401[/C][C]12346.8953[/C][C]17777.3594[/C][C]0.4405[/C][C]0.7841[/C][C]0.7677[/C][C]0.9964[/C][/ROW]
[ROW][C]82[/C][C]12185[/C][C]11769.0719[/C][C]9543.4763[/C][C]14334.7519[/C][C]0.3753[/C][C]0.0054[/C][C]0.757[/C][C]0.7405[/C][/ROW]
[ROW][C]83[/C][C]10645[/C][C]10108.9043[/C][C]8047.0502[/C][C]12514.8029[/C][C]0.3312[/C][C]0.0454[/C][C]0.7477[/C][C]0.2531[/C][/ROW]
[ROW][C]84[/C][C]12161[/C][C]11841.0183[/C][C]9456.1918[/C][C]14617.9448[/C][C]0.4107[/C][C]0.8007[/C][C]0.741[/C][C]0.741[/C][/ROW]
[ROW][C]85[/C][C]10840[/C][C]10244.4832[/C][C]7571.9386[/C][C]13516.0872[/C][C]0.3606[/C][C]0.1254[/C][C]0.6742[/C][C]0.3417[/C][/ROW]
[ROW][C]86[/C][C]10436[/C][C]10394.2979[/C][C]7506.7901[/C][C]13981.5543[/C][C]0.4909[/C][C]0.4038[/C][C]0.7899[/C][C]0.3859[/C][/ROW]
[ROW][C]87[/C][C]13589[/C][C]12774.8376[/C][C]9216.0663[/C][C]17199.0581[/C][C]0.3592[/C][C]0.8499[/C][C]0.6976[/C][C]0.7938[/C][/ROW]
[ROW][C]88[/C][C]13402[/C][C]12283.7341[/C][C]8645.531[/C][C]16877.8564[/C][C]0.3166[/C][C]0.2888[/C][C]0.9284[/C][C]0.7189[/C][/ROW]
[ROW][C]89[/C][C]13103[/C][C]13093.3152[/C][C]9103.2655[/C][C]18170.6108[/C][C]0.4985[/C][C]0.4526[/C][C]0.585[/C][C]0.7987[/C][/ROW]
[ROW][C]90[/C][C]14933[/C][C]12432.5897[/C][C]8432.3694[/C][C]17602.2278[/C][C]0.1716[/C][C]0.3997[/C][C]0.1889[/C][C]0.7162[/C][/ROW]
[ROW][C]91[/C][C]14147[/C][C]12663.027[/C][C]8455.1852[/C][C]18154.1267[/C][C]0.2982[/C][C]0.2089[/C][C]0.36[/C][C]0.7325[/C][/ROW]
[ROW][C]92[/C][C]14057[/C][C]14866.5975[/C][C]9963.6698[/C][C]21249.9678[/C][C]0.4018[/C][C]0.5874[/C][C]0.6363[/C][C]0.8869[/C][/ROW]
[ROW][C]93[/C][C]16234[/C][C]16024.1691[/C][C]10675.1656[/C][C]23014.2735[/C][C]0.4765[/C][C]0.7094[/C][C]0.6012[/C][C]0.9236[/C][/ROW]
[ROW][C]94[/C][C]12389[/C][C]12733.4716[/C][C]8091.9292[/C][C]18977.5421[/C][C]0.4569[/C][C]0.1359[/C][C]0.5683[/C][C]0.7149[/C][/ROW]
[ROW][C]95[/C][C]11595[/C][C]10977.0486[/C][C]6710.4491[/C][C]16853.3072[/C][C]0.4184[/C][C]0.3188[/C][C]0.5441[/C][C]0.5069[/C][/ROW]
[ROW][C]96[/C][C]12772[/C][C]12809.492[/C][C]7898.269[/C][C]19538.551[/C][C]0.4956[/C][C]0.6382[/C][C]0.5749[/C][C]0.7085[/C][/ROW]
[/TABLE]
Source: https://freestatistics.org/blog/index.php?pk=151761&T=1

Globally Unique Identifier (entire table): ba.freestatistics.org/blog/index.php?pk=151761&T=1

As an alternative you can also use a QR Code:  

The GUIDs for individual cells are displayed in the table below:

Univariate ARIMA Extrapolation Forecast
timeY[t]F[t]95% LB95% UBp-value(H0: Y[t] = F[t])P(F[t]>Y[t-1])P(F[t]>Y[t-s])P(F[t]>Y[72])
609614-------
618639-------
628772-------
6310894-------
6410455-------
6511179-------
6610588-------
6710794-------
6812770-------
6913812-------
7010857-------
719290-------
7210925-------
7394919417.80928302.205310634.33760.45310.00760.89520.0076
7489199559.07368313.888210929.27460.17990.53880.86990.0254
751160711808.220210236.500913541.54010.410.99950.84940.841
76885211343.58579706.254713165.0970.00370.38840.83050.6738
771253712109.693510286.90414147.36110.34050.99910.81470.8728
781475911484.3869633.37313571.04790.0010.16140.80010.7004
791366711702.4099734.390913933.32540.04220.00360.78760.7527
801373113790.422511477.812616410.97150.48230.53680.77730.9839
811511014889.340112346.895317777.35940.44050.78410.76770.9964
821218511769.07199543.476314334.75190.37530.00540.7570.7405
831064510108.90438047.050212514.80290.33120.04540.74770.2531
841216111841.01839456.191814617.94480.41070.80070.7410.741
851084010244.48327571.938613516.08720.36060.12540.67420.3417
861043610394.29797506.790113981.55430.49090.40380.78990.3859
871358912774.83769216.066317199.05810.35920.84990.69760.7938
881340212283.73418645.53116877.85640.31660.28880.92840.7189
891310313093.31529103.265518170.61080.49850.45260.5850.7987
901493312432.58978432.369417602.22780.17160.39970.18890.7162
911414712663.0278455.185218154.12670.29820.20890.360.7325
921405714866.59759963.669821249.96780.40180.58740.63630.8869
931623416024.169110675.165623014.27350.47650.70940.60120.9236
941238912733.47168091.929218977.54210.45690.13590.56830.7149
951159510977.04866710.449116853.30720.41840.31880.54410.5069
961277212809.4927898.26919538.5510.49560.63820.57490.7085


Univariate ARIMA Extrapolation Forecast Performance
time% S.E.PEMAPESq.EMSERMSE
730.06590.007805356.8900
740.0731-0.0670.0374409694.2317207525.5609455.5497
750.0749-0.0170.030640489.5507151846.8908389.6754
760.0819-0.21960.07796207999.44591665885.02961290.6917
770.08590.03530.0693182590.86491369226.19671170.1394
780.09270.28510.105310723096.66882928204.60871711.1998
790.09730.16790.11423859617.75423061263.62951749.6467
800.097-0.00430.10053531.02832679047.05431636.7795
810.0990.01480.09148690.79012386785.24721544.9224
820.11120.03530.0854172996.15562165406.3381471.532
830.12140.0530.0825287398.55991994678.35821412.3308
840.11970.0270.0779102388.28641836987.51891355.3551
850.16290.05810.0763354640.24431722960.80541312.616
860.17610.0040.07121739.06611600016.39551264.9175
870.17670.06370.0707662860.48691537539.33491239.9755
880.19080.0910.07191250518.65321519600.54231232.7208
890.19787e-040.067893.79471430217.79241195.9171
900.21210.20110.07526252051.50441698097.44311303.1107
910.22120.11720.07742202175.99131724627.8931313.2509
920.2191-0.05450.0762655448.08211671168.90251292.737
930.22260.01310.073244029.02241593686.0511262.4128
940.2502-0.02710.0711118660.65681526639.44221235.5725
950.27310.05630.0705381863.95811476866.59511215.264
960.268-0.00290.06771405.65131415389.05581189.7012

\begin{tabular}{lllllllll}
\hline
Univariate ARIMA Extrapolation Forecast Performance \tabularnewline
time & % S.E. & PE & MAPE & Sq.E & MSE & RMSE \tabularnewline
73 & 0.0659 & 0.0078 & 0 & 5356.89 & 0 & 0 \tabularnewline
74 & 0.0731 & -0.067 & 0.0374 & 409694.2317 & 207525.5609 & 455.5497 \tabularnewline
75 & 0.0749 & -0.017 & 0.0306 & 40489.5507 & 151846.8908 & 389.6754 \tabularnewline
76 & 0.0819 & -0.2196 & 0.0779 & 6207999.4459 & 1665885.0296 & 1290.6917 \tabularnewline
77 & 0.0859 & 0.0353 & 0.0693 & 182590.8649 & 1369226.1967 & 1170.1394 \tabularnewline
78 & 0.0927 & 0.2851 & 0.1053 & 10723096.6688 & 2928204.6087 & 1711.1998 \tabularnewline
79 & 0.0973 & 0.1679 & 0.1142 & 3859617.7542 & 3061263.6295 & 1749.6467 \tabularnewline
80 & 0.097 & -0.0043 & 0.1005 & 3531.0283 & 2679047.0543 & 1636.7795 \tabularnewline
81 & 0.099 & 0.0148 & 0.091 & 48690.7901 & 2386785.2472 & 1544.9224 \tabularnewline
82 & 0.1112 & 0.0353 & 0.0854 & 172996.1556 & 2165406.338 & 1471.532 \tabularnewline
83 & 0.1214 & 0.053 & 0.0825 & 287398.5599 & 1994678.3582 & 1412.3308 \tabularnewline
84 & 0.1197 & 0.027 & 0.0779 & 102388.2864 & 1836987.5189 & 1355.3551 \tabularnewline
85 & 0.1629 & 0.0581 & 0.0763 & 354640.2443 & 1722960.8054 & 1312.616 \tabularnewline
86 & 0.1761 & 0.004 & 0.0712 & 1739.0661 & 1600016.3955 & 1264.9175 \tabularnewline
87 & 0.1767 & 0.0637 & 0.0707 & 662860.4869 & 1537539.3349 & 1239.9755 \tabularnewline
88 & 0.1908 & 0.091 & 0.0719 & 1250518.6532 & 1519600.5423 & 1232.7208 \tabularnewline
89 & 0.1978 & 7e-04 & 0.0678 & 93.7947 & 1430217.7924 & 1195.9171 \tabularnewline
90 & 0.2121 & 0.2011 & 0.0752 & 6252051.5044 & 1698097.4431 & 1303.1107 \tabularnewline
91 & 0.2212 & 0.1172 & 0.0774 & 2202175.9913 & 1724627.893 & 1313.2509 \tabularnewline
92 & 0.2191 & -0.0545 & 0.0762 & 655448.0821 & 1671168.9025 & 1292.737 \tabularnewline
93 & 0.2226 & 0.0131 & 0.0732 & 44029.0224 & 1593686.051 & 1262.4128 \tabularnewline
94 & 0.2502 & -0.0271 & 0.0711 & 118660.6568 & 1526639.4422 & 1235.5725 \tabularnewline
95 & 0.2731 & 0.0563 & 0.0705 & 381863.9581 & 1476866.5951 & 1215.264 \tabularnewline
96 & 0.268 & -0.0029 & 0.0677 & 1405.6513 & 1415389.0558 & 1189.7012 \tabularnewline
\hline
\end{tabular}
%Source: https://freestatistics.org/blog/index.php?pk=151761&T=2

[TABLE]
[ROW][C]Univariate ARIMA Extrapolation Forecast Performance[/C][/ROW]
[ROW][C]time[/C][C]% S.E.[/C][C]PE[/C][C]MAPE[/C][C]Sq.E[/C][C]MSE[/C][C]RMSE[/C][/ROW]
[ROW][C]73[/C][C]0.0659[/C][C]0.0078[/C][C]0[/C][C]5356.89[/C][C]0[/C][C]0[/C][/ROW]
[ROW][C]74[/C][C]0.0731[/C][C]-0.067[/C][C]0.0374[/C][C]409694.2317[/C][C]207525.5609[/C][C]455.5497[/C][/ROW]
[ROW][C]75[/C][C]0.0749[/C][C]-0.017[/C][C]0.0306[/C][C]40489.5507[/C][C]151846.8908[/C][C]389.6754[/C][/ROW]
[ROW][C]76[/C][C]0.0819[/C][C]-0.2196[/C][C]0.0779[/C][C]6207999.4459[/C][C]1665885.0296[/C][C]1290.6917[/C][/ROW]
[ROW][C]77[/C][C]0.0859[/C][C]0.0353[/C][C]0.0693[/C][C]182590.8649[/C][C]1369226.1967[/C][C]1170.1394[/C][/ROW]
[ROW][C]78[/C][C]0.0927[/C][C]0.2851[/C][C]0.1053[/C][C]10723096.6688[/C][C]2928204.6087[/C][C]1711.1998[/C][/ROW]
[ROW][C]79[/C][C]0.0973[/C][C]0.1679[/C][C]0.1142[/C][C]3859617.7542[/C][C]3061263.6295[/C][C]1749.6467[/C][/ROW]
[ROW][C]80[/C][C]0.097[/C][C]-0.0043[/C][C]0.1005[/C][C]3531.0283[/C][C]2679047.0543[/C][C]1636.7795[/C][/ROW]
[ROW][C]81[/C][C]0.099[/C][C]0.0148[/C][C]0.091[/C][C]48690.7901[/C][C]2386785.2472[/C][C]1544.9224[/C][/ROW]
[ROW][C]82[/C][C]0.1112[/C][C]0.0353[/C][C]0.0854[/C][C]172996.1556[/C][C]2165406.338[/C][C]1471.532[/C][/ROW]
[ROW][C]83[/C][C]0.1214[/C][C]0.053[/C][C]0.0825[/C][C]287398.5599[/C][C]1994678.3582[/C][C]1412.3308[/C][/ROW]
[ROW][C]84[/C][C]0.1197[/C][C]0.027[/C][C]0.0779[/C][C]102388.2864[/C][C]1836987.5189[/C][C]1355.3551[/C][/ROW]
[ROW][C]85[/C][C]0.1629[/C][C]0.0581[/C][C]0.0763[/C][C]354640.2443[/C][C]1722960.8054[/C][C]1312.616[/C][/ROW]
[ROW][C]86[/C][C]0.1761[/C][C]0.004[/C][C]0.0712[/C][C]1739.0661[/C][C]1600016.3955[/C][C]1264.9175[/C][/ROW]
[ROW][C]87[/C][C]0.1767[/C][C]0.0637[/C][C]0.0707[/C][C]662860.4869[/C][C]1537539.3349[/C][C]1239.9755[/C][/ROW]
[ROW][C]88[/C][C]0.1908[/C][C]0.091[/C][C]0.0719[/C][C]1250518.6532[/C][C]1519600.5423[/C][C]1232.7208[/C][/ROW]
[ROW][C]89[/C][C]0.1978[/C][C]7e-04[/C][C]0.0678[/C][C]93.7947[/C][C]1430217.7924[/C][C]1195.9171[/C][/ROW]
[ROW][C]90[/C][C]0.2121[/C][C]0.2011[/C][C]0.0752[/C][C]6252051.5044[/C][C]1698097.4431[/C][C]1303.1107[/C][/ROW]
[ROW][C]91[/C][C]0.2212[/C][C]0.1172[/C][C]0.0774[/C][C]2202175.9913[/C][C]1724627.893[/C][C]1313.2509[/C][/ROW]
[ROW][C]92[/C][C]0.2191[/C][C]-0.0545[/C][C]0.0762[/C][C]655448.0821[/C][C]1671168.9025[/C][C]1292.737[/C][/ROW]
[ROW][C]93[/C][C]0.2226[/C][C]0.0131[/C][C]0.0732[/C][C]44029.0224[/C][C]1593686.051[/C][C]1262.4128[/C][/ROW]
[ROW][C]94[/C][C]0.2502[/C][C]-0.0271[/C][C]0.0711[/C][C]118660.6568[/C][C]1526639.4422[/C][C]1235.5725[/C][/ROW]
[ROW][C]95[/C][C]0.2731[/C][C]0.0563[/C][C]0.0705[/C][C]381863.9581[/C][C]1476866.5951[/C][C]1215.264[/C][/ROW]
[ROW][C]96[/C][C]0.268[/C][C]-0.0029[/C][C]0.0677[/C][C]1405.6513[/C][C]1415389.0558[/C][C]1189.7012[/C][/ROW]
[/TABLE]
Source: https://freestatistics.org/blog/index.php?pk=151761&T=2

Globally Unique Identifier (entire table): ba.freestatistics.org/blog/index.php?pk=151761&T=2

As an alternative you can also use a QR Code:  

The GUIDs for individual cells are displayed in the table below:

Univariate ARIMA Extrapolation Forecast Performance
time% S.E.PEMAPESq.EMSERMSE
730.06590.007805356.8900
740.0731-0.0670.0374409694.2317207525.5609455.5497
750.0749-0.0170.030640489.5507151846.8908389.6754
760.0819-0.21960.07796207999.44591665885.02961290.6917
770.08590.03530.0693182590.86491369226.19671170.1394
780.09270.28510.105310723096.66882928204.60871711.1998
790.09730.16790.11423859617.75423061263.62951749.6467
800.097-0.00430.10053531.02832679047.05431636.7795
810.0990.01480.09148690.79012386785.24721544.9224
820.11120.03530.0854172996.15562165406.3381471.532
830.12140.0530.0825287398.55991994678.35821412.3308
840.11970.0270.0779102388.28641836987.51891355.3551
850.16290.05810.0763354640.24431722960.80541312.616
860.17610.0040.07121739.06611600016.39551264.9175
870.17670.06370.0707662860.48691537539.33491239.9755
880.19080.0910.07191250518.65321519600.54231232.7208
890.19787e-040.067893.79471430217.79241195.9171
900.21210.20110.07526252051.50441698097.44311303.1107
910.22120.11720.07742202175.99131724627.8931313.2509
920.2191-0.05450.0762655448.08211671168.90251292.737
930.22260.01310.073244029.02241593686.0511262.4128
940.2502-0.02710.0711118660.65681526639.44221235.5725
950.27310.05630.0705381863.95811476866.59511215.264
960.268-0.00290.06771405.65131415389.05581189.7012


Parameters (Session):
par1 = 24 ; par2 = 0.3 ; par3 = 1 ; par4 = 1 ; par5 = 12 ; par6 = 0 ; par7 = 1 ; par8 = 0 ; par9 = 0 ; par10 = FALSE ;
Parameters (R input):
par1 = 24 ; par2 = 0.3 ; par3 = 1 ; par4 = 1 ; par5 = 12 ; par6 = 0 ; par7 = 1 ; par8 = 0 ; par9 = 0 ; par10 = FALSE ;
R code (references can be found in the software module):
par1 <- as.numeric(par1) #cut off periods
par2 <- as.numeric(par2) #lambda
par3 <- as.numeric(par3) #degree of non-seasonal differencing
par4 <- as.numeric(par4) #degree of seasonal differencing
par5 <- as.numeric(par5) #seasonal period
par6 <- as.numeric(par6) #p
par7 <- as.numeric(par7) #q
par8 <- as.numeric(par8) #P
par9 <- as.numeric(par9) #Q
if (par10 == 'TRUE') par10 <- TRUE
if (par10 == 'FALSE') par10 <- FALSE
if (par2 == 0) x <- log(x)
if (par2 != 0) x <- x^par2
lx <- length(x)
first <- lx - 2*par1
nx <- lx - par1
nx1 <- nx + 1
fx <- lx - nx
if (fx < 1) {
fx <- par5
nx1 <- lx + fx - 1
first <- lx - 2*fx
}
first <- 1
if (fx < 3) fx <- round(lx/10,0)
(arima.out <- arima(x[1:nx], order=c(par6,par3,par7), seasonal=list(order=c(par8,par4,par9), period=par5), include.mean=par10, method='ML'))
(forecast <- predict(arima.out,par1))
(lb <- forecast$pred - 1.96 * forecast$se)
(ub <- forecast$pred + 1.96 * forecast$se)
if (par2 == 0) {
x <- exp(x)
forecast$pred <- exp(forecast$pred)
lb <- exp(lb)
ub <- exp(ub)
}
if (par2 != 0) {
x <- x^(1/par2)
forecast$pred <- forecast$pred^(1/par2)
lb <- lb^(1/par2)
ub <- ub^(1/par2)
}
if (par2 < 0) {
olb <- lb
lb <- ub
ub <- olb
}
(actandfor <- c(x[1:nx], forecast$pred))
(perc.se <- (ub-forecast$pred)/1.96/forecast$pred)
bitmap(file='test1.png')
opar <- par(mar=c(4,4,2,2),las=1)
ylim <- c( min(x[first:nx],lb), max(x[first:nx],ub))
plot(x,ylim=ylim,type='n',xlim=c(first,lx))
usr <- par('usr')
rect(usr[1],usr[3],nx+1,usr[4],border=NA,col='lemonchiffon')
rect(nx1,usr[3],usr[2],usr[4],border=NA,col='lavender')
abline(h= (-3:3)*2 , col ='gray', lty =3)
polygon( c(nx1:lx,lx:nx1), c(lb,rev(ub)), col = 'orange', lty=2,border=NA)
lines(nx1:lx, lb , lty=2)
lines(nx1:lx, ub , lty=2)
lines(x, lwd=2)
lines(nx1:lx, forecast$pred , lwd=2 , col ='white')
box()
par(opar)
dev.off()
prob.dec <- array(NA, dim=fx)
prob.sdec <- array(NA, dim=fx)
prob.ldec <- array(NA, dim=fx)
prob.pval <- array(NA, dim=fx)
perf.pe <- array(0, dim=fx)
perf.mape <- array(0, dim=fx)
perf.mape1 <- array(0, dim=fx)
perf.se <- array(0, dim=fx)
perf.mse <- array(0, dim=fx)
perf.mse1 <- array(0, dim=fx)
perf.rmse <- array(0, dim=fx)
for (i in 1:fx) {
locSD <- (ub[i] - forecast$pred[i]) / 1.96
perf.pe[i] = (x[nx+i] - forecast$pred[i]) / forecast$pred[i]
perf.se[i] = (x[nx+i] - forecast$pred[i])^2
prob.dec[i] = pnorm((x[nx+i-1] - forecast$pred[i]) / locSD)
prob.sdec[i] = pnorm((x[nx+i-par5] - forecast$pred[i]) / locSD)
prob.ldec[i] = pnorm((x[nx] - forecast$pred[i]) / locSD)
prob.pval[i] = pnorm(abs(x[nx+i] - forecast$pred[i]) / locSD)
}
perf.mape[1] = abs(perf.pe[1])
perf.mse[1] = abs(perf.se[1])
for (i in 2:fx) {
perf.mape[i] = perf.mape[i-1] + abs(perf.pe[i])
perf.mape1[i] = perf.mape[i] / i
perf.mse[i] = perf.mse[i-1] + perf.se[i]
perf.mse1[i] = perf.mse[i] / i
}
perf.rmse = sqrt(perf.mse1)
bitmap(file='test2.png')
plot(forecast$pred, pch=19, type='b',main='ARIMA Extrapolation Forecast', ylab='Forecast and 95% CI', xlab='time',ylim=c(min(lb),max(ub)))
dum <- forecast$pred
dum[1:par1] <- x[(nx+1):lx]
lines(dum, lty=1)
lines(ub,lty=3)
lines(lb,lty=3)
dev.off()
load(file='createtable')
a<-table.start()
a<-table.row.start(a)
a<-table.element(a,'Univariate ARIMA Extrapolation Forecast',9,TRUE)
a<-table.row.end(a)
a<-table.row.start(a)
a<-table.element(a,'time',1,header=TRUE)
a<-table.element(a,'Y[t]',1,header=TRUE)
a<-table.element(a,'F[t]',1,header=TRUE)
a<-table.element(a,'95% LB',1,header=TRUE)
a<-table.element(a,'95% UB',1,header=TRUE)
a<-table.element(a,'p-value
(H0: Y[t] = F[t])',1,header=TRUE)
a<-table.element(a,'P(F[t]>Y[t-1])',1,header=TRUE)
a<-table.element(a,'P(F[t]>Y[t-s])',1,header=TRUE)
mylab <- paste('P(F[t]>Y[',nx,sep='')
mylab <- paste(mylab,'])',sep='')
a<-table.element(a,mylab,1,header=TRUE)
a<-table.row.end(a)
for (i in (nx-par5):nx) {
a<-table.row.start(a)
a<-table.element(a,i,header=TRUE)
a<-table.element(a,x[i])
a<-table.element(a,'-')
a<-table.row.end(a)
}
for (i in 1:fx) {
a<-table.row.start(a)
a<-table.element(a,nx+i,header=TRUE)
a<-table.element(a,round(x[nx+i],4))
a<-table.element(a,round(forecast$pred[i],4))
a<-table.element(a,round(lb[i],4))
a<-table.element(a,round(ub[i],4))
a<-table.element(a,round((1-prob.pval[i]),4))
a<-table.element(a,round((1-prob.dec[i]),4))
a<-table.element(a,round((1-prob.sdec[i]),4))
a<-table.element(a,round((1-prob.ldec[i]),4))
a<-table.row.end(a)
}
a<-table.end(a)
table.save(a,file='mytable.tab')
a<-table.start()
a<-table.row.start(a)
a<-table.element(a,'Univariate ARIMA Extrapolation Forecast Performance',7,TRUE)
a<-table.row.end(a)
a<-table.row.start(a)
a<-table.element(a,'time',1,header=TRUE)
a<-table.element(a,'% S.E.',1,header=TRUE)
a<-table.element(a,'PE',1,header=TRUE)
a<-table.element(a,'MAPE',1,header=TRUE)
a<-table.element(a,'Sq.E',1,header=TRUE)
a<-table.element(a,'MSE',1,header=TRUE)
a<-table.element(a,'RMSE',1,header=TRUE)
a<-table.row.end(a)
for (i in 1:fx) {
a<-table.row.start(a)
a<-table.element(a,nx+i,header=TRUE)
a<-table.element(a,round(perc.se[i],4))
a<-table.element(a,round(perf.pe[i],4))
a<-table.element(a,round(perf.mape1[i],4))
a<-table.element(a,round(perf.se[i],4))
a<-table.element(a,round(perf.mse1[i],4))
a<-table.element(a,round(perf.rmse[i],4))
a<-table.row.end(a)
}
a<-table.end(a)
table.save(a,file='mytable1.tab')