Free Statistics

of Irreproducible Research!

Author's title

Author*The author of this computation has been verified*
R Software Modulerwasp_arimaforecasting.wasp
Title produced by softwareARIMA Forecasting
Date of computationTue, 06 Dec 2011 10:52:05 -0500
Cite this page as followsStatistical Computations at FreeStatistics.org, Office for Research Development and Education, URL https://freestatistics.org/blog/index.php?v=date/2011/Dec/06/t1323186755i048lofwniqfdfs.htm/, Retrieved Mon, 29 Apr 2024 05:28:27 +0000
Statistical Computations at FreeStatistics.org, Office for Research Development and Education, URL https://freestatistics.org/blog/index.php?pk=151703, Retrieved Mon, 29 Apr 2024 05:28:27 +0000
QR Codes:

Original text written by user:
IsPrivate?No (this computation is public)
User-defined keywords
Estimated Impact75
Family? (F = Feedback message, R = changed R code, M = changed R Module, P = changed Parameters, D = changed Data)
-       [ARIMA Forecasting] [WS 9 Forcasting] [2011-12-06 15:52:05] [c98b04636162cea751932dfe577607eb] [Current]
Feedback Forum

Post a new message
Dataseries X:
22782
19169
13807
29743
25591
29096
26482
22405
27044
17970
18730
19684
19785
18479
10698
31956
29506
34506
27165
26736
23691
18157
17328
18205
20995
17382
9367
31124
26551
30651
25859
25100
25778
20418
18688
20424
24776
19814
12738
31566
30111
30019
31934
25826
26835
20205
17789
20520
22518
15572
11509
25447
24090
27786
26195
20516
22759
19028
16971
20036
22485
18730
14538
27561
25985
34670
32066
27186
29586
21359
21553
19573
24256
22380
16167
27297
28287
33474
28229
28785
25597
18130
20198
22849
23118


Summary of computational transaction
Raw Inputview raw input (R code)
Raw Outputview raw output of R engine
Computing time2 seconds
R Server'Gwilym Jenkins' @ jenkins.wessa.net

\begin{tabular}{lllllllll}
\hline
Summary of computational transaction \tabularnewline
Raw Input & view raw input (R code)  \tabularnewline
Raw Output & view raw output of R engine  \tabularnewline
Computing time & 2 seconds \tabularnewline
R Server & 'Gwilym Jenkins' @ jenkins.wessa.net \tabularnewline
\hline
\end{tabular}
%Source: https://freestatistics.org/blog/index.php?pk=151703&T=0

[TABLE]
[ROW][C]Summary of computational transaction[/C][/ROW]
[ROW][C]Raw Input[/C][C]view raw input (R code) [/C][/ROW]
[ROW][C]Raw Output[/C][C]view raw output of R engine [/C][/ROW]
[ROW][C]Computing time[/C][C]2 seconds[/C][/ROW]
[ROW][C]R Server[/C][C]'Gwilym Jenkins' @ jenkins.wessa.net[/C][/ROW]
[/TABLE]
Source: https://freestatistics.org/blog/index.php?pk=151703&T=0

Globally Unique Identifier (entire table): ba.freestatistics.org/blog/index.php?pk=151703&T=0

As an alternative you can also use a QR Code:  

The GUIDs for individual cells are displayed in the table below:

Summary of computational transaction
Raw Inputview raw input (R code)
Raw Outputview raw output of R engine
Computing time2 seconds
R Server'Gwilym Jenkins' @ jenkins.wessa.net


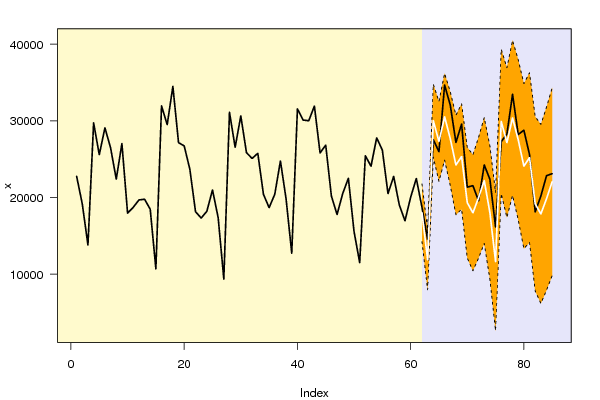
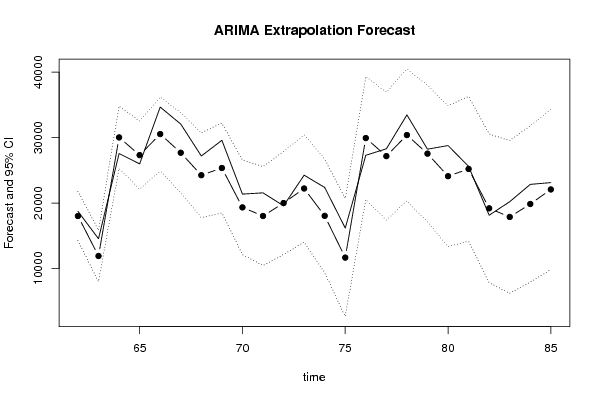
Univariate ARIMA Extrapolation Forecast
timeY[t]F[t]95% LB95% UBp-value(H0: Y[t] = F[t])P(F[t]>Y[t-1])P(F[t]>Y[t-s])P(F[t]>Y[61])
4922518-------
5015572-------
5111509-------
5225447-------
5324090-------
5427786-------
5526195-------
5620516-------
5722759-------
5819028-------
5916971-------
6020036-------
6122485-------
621873018011.649614243.075221780.22410.35430.010.89780.01
631453811895.18737961.356315829.01840.0943e-040.57630
642756130028.124725272.555834783.69370.154610.97050.9991
652598527321.934222105.962132537.90630.30770.46420.88770.9654
663467030539.527924884.296436194.75940.07610.94280.830.9974
673206627682.740921572.273533793.20830.07990.01250.68340.9523
682718624250.375117761.514730739.23540.18760.00910.87030.7031
692958625351.288218478.784732223.79170.11360.30040.77010.7932
702135919332.104812108.18226556.02770.29120.00270.53290.1962
712155318011.876210444.562225579.19020.17950.1930.60630.1233
721957319993.331812116.299527870.36410.45840.3490.49580.2676
732425622219.759714014.244130425.27530.31330.73640.47470.4747
742238018035.19419334.546526735.84170.16390.08060.43780.1581
751616711649.9972622.588220677.40590.16340.00990.26530.0093
762729729929.068720510.62639347.51150.29190.99790.68890.9393
772828727165.526617397.922336933.13080.4110.48950.59360.8262
783347430390.106520283.014840497.19820.27490.65830.20330.9374
792822927544.575717104.281637984.86980.44890.13280.1980.8289
802878524099.313339.919934858.68010.19670.22590.2870.6156
812559725208.840314138.261836279.41880.47260.26330.21920.6852
821813019185.57887813.835530557.32210.42780.13460.3540.2848
832019817866.47746194.166229538.78860.34770.48240.26790.219
842284919848.1567905.123631791.18830.31120.47710.5180.3326
852311822074.0179828.429834319.60410.43360.45060.36350.4738

\begin{tabular}{lllllllll}
\hline
Univariate ARIMA Extrapolation Forecast \tabularnewline
time & Y[t] & F[t] & 95% LB & 95% UB & p-value(H0: Y[t] = F[t]) & P(F[t]>Y[t-1]) & P(F[t]>Y[t-s]) & P(F[t]>Y[61]) \tabularnewline
49 & 22518 & - & - & - & - & - & - & - \tabularnewline
50 & 15572 & - & - & - & - & - & - & - \tabularnewline
51 & 11509 & - & - & - & - & - & - & - \tabularnewline
52 & 25447 & - & - & - & - & - & - & - \tabularnewline
53 & 24090 & - & - & - & - & - & - & - \tabularnewline
54 & 27786 & - & - & - & - & - & - & - \tabularnewline
55 & 26195 & - & - & - & - & - & - & - \tabularnewline
56 & 20516 & - & - & - & - & - & - & - \tabularnewline
57 & 22759 & - & - & - & - & - & - & - \tabularnewline
58 & 19028 & - & - & - & - & - & - & - \tabularnewline
59 & 16971 & - & - & - & - & - & - & - \tabularnewline
60 & 20036 & - & - & - & - & - & - & - \tabularnewline
61 & 22485 & - & - & - & - & - & - & - \tabularnewline
62 & 18730 & 18011.6496 & 14243.0752 & 21780.2241 & 0.3543 & 0.01 & 0.8978 & 0.01 \tabularnewline
63 & 14538 & 11895.1873 & 7961.3563 & 15829.0184 & 0.094 & 3e-04 & 0.5763 & 0 \tabularnewline
64 & 27561 & 30028.1247 & 25272.5558 & 34783.6937 & 0.1546 & 1 & 0.9705 & 0.9991 \tabularnewline
65 & 25985 & 27321.9342 & 22105.9621 & 32537.9063 & 0.3077 & 0.4642 & 0.8877 & 0.9654 \tabularnewline
66 & 34670 & 30539.5279 & 24884.2964 & 36194.7594 & 0.0761 & 0.9428 & 0.83 & 0.9974 \tabularnewline
67 & 32066 & 27682.7409 & 21572.2735 & 33793.2083 & 0.0799 & 0.0125 & 0.6834 & 0.9523 \tabularnewline
68 & 27186 & 24250.3751 & 17761.5147 & 30739.2354 & 0.1876 & 0.0091 & 0.8703 & 0.7031 \tabularnewline
69 & 29586 & 25351.2882 & 18478.7847 & 32223.7917 & 0.1136 & 0.3004 & 0.7701 & 0.7932 \tabularnewline
70 & 21359 & 19332.1048 & 12108.182 & 26556.0277 & 0.2912 & 0.0027 & 0.5329 & 0.1962 \tabularnewline
71 & 21553 & 18011.8762 & 10444.5622 & 25579.1902 & 0.1795 & 0.193 & 0.6063 & 0.1233 \tabularnewline
72 & 19573 & 19993.3318 & 12116.2995 & 27870.3641 & 0.4584 & 0.349 & 0.4958 & 0.2676 \tabularnewline
73 & 24256 & 22219.7597 & 14014.2441 & 30425.2753 & 0.3133 & 0.7364 & 0.4747 & 0.4747 \tabularnewline
74 & 22380 & 18035.1941 & 9334.5465 & 26735.8417 & 0.1639 & 0.0806 & 0.4378 & 0.1581 \tabularnewline
75 & 16167 & 11649.997 & 2622.5882 & 20677.4059 & 0.1634 & 0.0099 & 0.2653 & 0.0093 \tabularnewline
76 & 27297 & 29929.0687 & 20510.626 & 39347.5115 & 0.2919 & 0.9979 & 0.6889 & 0.9393 \tabularnewline
77 & 28287 & 27165.5266 & 17397.9223 & 36933.1308 & 0.411 & 0.4895 & 0.5936 & 0.8262 \tabularnewline
78 & 33474 & 30390.1065 & 20283.0148 & 40497.1982 & 0.2749 & 0.6583 & 0.2033 & 0.9374 \tabularnewline
79 & 28229 & 27544.5757 & 17104.2816 & 37984.8698 & 0.4489 & 0.1328 & 0.198 & 0.8289 \tabularnewline
80 & 28785 & 24099.3 & 13339.9199 & 34858.6801 & 0.1967 & 0.2259 & 0.287 & 0.6156 \tabularnewline
81 & 25597 & 25208.8403 & 14138.2618 & 36279.4188 & 0.4726 & 0.2633 & 0.2192 & 0.6852 \tabularnewline
82 & 18130 & 19185.5788 & 7813.8355 & 30557.3221 & 0.4278 & 0.1346 & 0.354 & 0.2848 \tabularnewline
83 & 20198 & 17866.4774 & 6194.1662 & 29538.7886 & 0.3477 & 0.4824 & 0.2679 & 0.219 \tabularnewline
84 & 22849 & 19848.156 & 7905.1236 & 31791.1883 & 0.3112 & 0.4771 & 0.518 & 0.3326 \tabularnewline
85 & 23118 & 22074.017 & 9828.4298 & 34319.6041 & 0.4336 & 0.4506 & 0.3635 & 0.4738 \tabularnewline
\hline
\end{tabular}
%Source: https://freestatistics.org/blog/index.php?pk=151703&T=1

[TABLE]
[ROW][C]Univariate ARIMA Extrapolation Forecast[/C][/ROW]
[ROW][C]time[/C][C]Y[t][/C][C]F[t][/C][C]95% LB[/C][C]95% UB[/C][C]p-value(H0: Y[t] = F[t])[/C][C]P(F[t]>Y[t-1])[/C][C]P(F[t]>Y[t-s])[/C][C]P(F[t]>Y[61])[/C][/ROW]
[ROW][C]49[/C][C]22518[/C][C]-[/C][C]-[/C][C]-[/C][C]-[/C][C]-[/C][C]-[/C][C]-[/C][/ROW]
[ROW][C]50[/C][C]15572[/C][C]-[/C][C]-[/C][C]-[/C][C]-[/C][C]-[/C][C]-[/C][C]-[/C][/ROW]
[ROW][C]51[/C][C]11509[/C][C]-[/C][C]-[/C][C]-[/C][C]-[/C][C]-[/C][C]-[/C][C]-[/C][/ROW]
[ROW][C]52[/C][C]25447[/C][C]-[/C][C]-[/C][C]-[/C][C]-[/C][C]-[/C][C]-[/C][C]-[/C][/ROW]
[ROW][C]53[/C][C]24090[/C][C]-[/C][C]-[/C][C]-[/C][C]-[/C][C]-[/C][C]-[/C][C]-[/C][/ROW]
[ROW][C]54[/C][C]27786[/C][C]-[/C][C]-[/C][C]-[/C][C]-[/C][C]-[/C][C]-[/C][C]-[/C][/ROW]
[ROW][C]55[/C][C]26195[/C][C]-[/C][C]-[/C][C]-[/C][C]-[/C][C]-[/C][C]-[/C][C]-[/C][/ROW]
[ROW][C]56[/C][C]20516[/C][C]-[/C][C]-[/C][C]-[/C][C]-[/C][C]-[/C][C]-[/C][C]-[/C][/ROW]
[ROW][C]57[/C][C]22759[/C][C]-[/C][C]-[/C][C]-[/C][C]-[/C][C]-[/C][C]-[/C][C]-[/C][/ROW]
[ROW][C]58[/C][C]19028[/C][C]-[/C][C]-[/C][C]-[/C][C]-[/C][C]-[/C][C]-[/C][C]-[/C][/ROW]
[ROW][C]59[/C][C]16971[/C][C]-[/C][C]-[/C][C]-[/C][C]-[/C][C]-[/C][C]-[/C][C]-[/C][/ROW]
[ROW][C]60[/C][C]20036[/C][C]-[/C][C]-[/C][C]-[/C][C]-[/C][C]-[/C][C]-[/C][C]-[/C][/ROW]
[ROW][C]61[/C][C]22485[/C][C]-[/C][C]-[/C][C]-[/C][C]-[/C][C]-[/C][C]-[/C][C]-[/C][/ROW]
[ROW][C]62[/C][C]18730[/C][C]18011.6496[/C][C]14243.0752[/C][C]21780.2241[/C][C]0.3543[/C][C]0.01[/C][C]0.8978[/C][C]0.01[/C][/ROW]
[ROW][C]63[/C][C]14538[/C][C]11895.1873[/C][C]7961.3563[/C][C]15829.0184[/C][C]0.094[/C][C]3e-04[/C][C]0.5763[/C][C]0[/C][/ROW]
[ROW][C]64[/C][C]27561[/C][C]30028.1247[/C][C]25272.5558[/C][C]34783.6937[/C][C]0.1546[/C][C]1[/C][C]0.9705[/C][C]0.9991[/C][/ROW]
[ROW][C]65[/C][C]25985[/C][C]27321.9342[/C][C]22105.9621[/C][C]32537.9063[/C][C]0.3077[/C][C]0.4642[/C][C]0.8877[/C][C]0.9654[/C][/ROW]
[ROW][C]66[/C][C]34670[/C][C]30539.5279[/C][C]24884.2964[/C][C]36194.7594[/C][C]0.0761[/C][C]0.9428[/C][C]0.83[/C][C]0.9974[/C][/ROW]
[ROW][C]67[/C][C]32066[/C][C]27682.7409[/C][C]21572.2735[/C][C]33793.2083[/C][C]0.0799[/C][C]0.0125[/C][C]0.6834[/C][C]0.9523[/C][/ROW]
[ROW][C]68[/C][C]27186[/C][C]24250.3751[/C][C]17761.5147[/C][C]30739.2354[/C][C]0.1876[/C][C]0.0091[/C][C]0.8703[/C][C]0.7031[/C][/ROW]
[ROW][C]69[/C][C]29586[/C][C]25351.2882[/C][C]18478.7847[/C][C]32223.7917[/C][C]0.1136[/C][C]0.3004[/C][C]0.7701[/C][C]0.7932[/C][/ROW]
[ROW][C]70[/C][C]21359[/C][C]19332.1048[/C][C]12108.182[/C][C]26556.0277[/C][C]0.2912[/C][C]0.0027[/C][C]0.5329[/C][C]0.1962[/C][/ROW]
[ROW][C]71[/C][C]21553[/C][C]18011.8762[/C][C]10444.5622[/C][C]25579.1902[/C][C]0.1795[/C][C]0.193[/C][C]0.6063[/C][C]0.1233[/C][/ROW]
[ROW][C]72[/C][C]19573[/C][C]19993.3318[/C][C]12116.2995[/C][C]27870.3641[/C][C]0.4584[/C][C]0.349[/C][C]0.4958[/C][C]0.2676[/C][/ROW]
[ROW][C]73[/C][C]24256[/C][C]22219.7597[/C][C]14014.2441[/C][C]30425.2753[/C][C]0.3133[/C][C]0.7364[/C][C]0.4747[/C][C]0.4747[/C][/ROW]
[ROW][C]74[/C][C]22380[/C][C]18035.1941[/C][C]9334.5465[/C][C]26735.8417[/C][C]0.1639[/C][C]0.0806[/C][C]0.4378[/C][C]0.1581[/C][/ROW]
[ROW][C]75[/C][C]16167[/C][C]11649.997[/C][C]2622.5882[/C][C]20677.4059[/C][C]0.1634[/C][C]0.0099[/C][C]0.2653[/C][C]0.0093[/C][/ROW]
[ROW][C]76[/C][C]27297[/C][C]29929.0687[/C][C]20510.626[/C][C]39347.5115[/C][C]0.2919[/C][C]0.9979[/C][C]0.6889[/C][C]0.9393[/C][/ROW]
[ROW][C]77[/C][C]28287[/C][C]27165.5266[/C][C]17397.9223[/C][C]36933.1308[/C][C]0.411[/C][C]0.4895[/C][C]0.5936[/C][C]0.8262[/C][/ROW]
[ROW][C]78[/C][C]33474[/C][C]30390.1065[/C][C]20283.0148[/C][C]40497.1982[/C][C]0.2749[/C][C]0.6583[/C][C]0.2033[/C][C]0.9374[/C][/ROW]
[ROW][C]79[/C][C]28229[/C][C]27544.5757[/C][C]17104.2816[/C][C]37984.8698[/C][C]0.4489[/C][C]0.1328[/C][C]0.198[/C][C]0.8289[/C][/ROW]
[ROW][C]80[/C][C]28785[/C][C]24099.3[/C][C]13339.9199[/C][C]34858.6801[/C][C]0.1967[/C][C]0.2259[/C][C]0.287[/C][C]0.6156[/C][/ROW]
[ROW][C]81[/C][C]25597[/C][C]25208.8403[/C][C]14138.2618[/C][C]36279.4188[/C][C]0.4726[/C][C]0.2633[/C][C]0.2192[/C][C]0.6852[/C][/ROW]
[ROW][C]82[/C][C]18130[/C][C]19185.5788[/C][C]7813.8355[/C][C]30557.3221[/C][C]0.4278[/C][C]0.1346[/C][C]0.354[/C][C]0.2848[/C][/ROW]
[ROW][C]83[/C][C]20198[/C][C]17866.4774[/C][C]6194.1662[/C][C]29538.7886[/C][C]0.3477[/C][C]0.4824[/C][C]0.2679[/C][C]0.219[/C][/ROW]
[ROW][C]84[/C][C]22849[/C][C]19848.156[/C][C]7905.1236[/C][C]31791.1883[/C][C]0.3112[/C][C]0.4771[/C][C]0.518[/C][C]0.3326[/C][/ROW]
[ROW][C]85[/C][C]23118[/C][C]22074.017[/C][C]9828.4298[/C][C]34319.6041[/C][C]0.4336[/C][C]0.4506[/C][C]0.3635[/C][C]0.4738[/C][/ROW]
[/TABLE]
Source: https://freestatistics.org/blog/index.php?pk=151703&T=1

Globally Unique Identifier (entire table): ba.freestatistics.org/blog/index.php?pk=151703&T=1

As an alternative you can also use a QR Code:  

The GUIDs for individual cells are displayed in the table below:

Univariate ARIMA Extrapolation Forecast
timeY[t]F[t]95% LB95% UBp-value(H0: Y[t] = F[t])P(F[t]>Y[t-1])P(F[t]>Y[t-s])P(F[t]>Y[61])
4922518-------
5015572-------
5111509-------
5225447-------
5324090-------
5427786-------
5526195-------
5620516-------
5722759-------
5819028-------
5916971-------
6020036-------
6122485-------
621873018011.649614243.075221780.22410.35430.010.89780.01
631453811895.18737961.356315829.01840.0943e-040.57630
642756130028.124725272.555834783.69370.154610.97050.9991
652598527321.934222105.962132537.90630.30770.46420.88770.9654
663467030539.527924884.296436194.75940.07610.94280.830.9974
673206627682.740921572.273533793.20830.07990.01250.68340.9523
682718624250.375117761.514730739.23540.18760.00910.87030.7031
692958625351.288218478.784732223.79170.11360.30040.77010.7932
702135919332.104812108.18226556.02770.29120.00270.53290.1962
712155318011.876210444.562225579.19020.17950.1930.60630.1233
721957319993.331812116.299527870.36410.45840.3490.49580.2676
732425622219.759714014.244130425.27530.31330.73640.47470.4747
742238018035.19419334.546526735.84170.16390.08060.43780.1581
751616711649.9972622.588220677.40590.16340.00990.26530.0093
762729729929.068720510.62639347.51150.29190.99790.68890.9393
772828727165.526617397.922336933.13080.4110.48950.59360.8262
783347430390.106520283.014840497.19820.27490.65830.20330.9374
792822927544.575717104.281637984.86980.44890.13280.1980.8289
802878524099.313339.919934858.68010.19670.22590.2870.6156
812559725208.840314138.261836279.41880.47260.26330.21920.6852
821813019185.57887813.835530557.32210.42780.13460.3540.2848
832019817866.47746194.166229538.78860.34770.48240.26790.219
842284919848.1567905.123631791.18830.31120.47710.5180.3326
852311822074.0179828.429834319.60410.43360.45060.36350.4738


Univariate ARIMA Extrapolation Forecast Performance
time% S.E.PEMAPESq.EMSERMSE
620.10670.03990516027.269200
630.16870.22220.1316984458.71753750242.99331936.5544
640.0808-0.08220.11476086704.50094529063.49582128.1596
650.0974-0.04890.09831787393.05683843645.88611960.5218
660.09450.13530.105717060799.77456487076.66382546.974
670.11260.15830.114519212960.37128608057.28172933.9491
680.13650.12110.11548617893.83048609462.50292934.1886
690.13830.1670.121917932784.09859774877.70243126.4801
700.19070.10480.124108303.98889145258.40093024.1128
710.21440.19660.127612539557.46679484688.30743079.7221
720.201-0.0210.1179176678.83368638505.6282939.1335
730.18840.09160.11574146274.54238264153.03752874.744
740.24610.24090.125418877338.27229080551.90173013.3954
750.39530.38770.144120403315.65569889320.74133144.729
760.1606-0.08790.14046927785.83399691885.08083113.1793
770.18340.04130.13421257702.61419164748.67663027.3336
780.16970.10150.13239510399.22489185081.06183030.6899
790.19340.02480.1263468436.67558700823.04042949.7158
800.22780.19440.129921955784.33799398452.58233065.6896
810.22410.01540.1241150667.95258936063.35092989.3249
820.3024-0.0550.12091114246.65928563595.88932926.3622
830.33330.13050.12135435997.59088421432.33032901.9704
840.3070.15120.12269005064.96638446807.66232906.3392
850.2830.04730.11951089900.60248140269.86822853.1158

\begin{tabular}{lllllllll}
\hline
Univariate ARIMA Extrapolation Forecast Performance \tabularnewline
time & % S.E. & PE & MAPE & Sq.E & MSE & RMSE \tabularnewline
62 & 0.1067 & 0.0399 & 0 & 516027.2692 & 0 & 0 \tabularnewline
63 & 0.1687 & 0.2222 & 0.131 & 6984458.7175 & 3750242.9933 & 1936.5544 \tabularnewline
64 & 0.0808 & -0.0822 & 0.1147 & 6086704.5009 & 4529063.4958 & 2128.1596 \tabularnewline
65 & 0.0974 & -0.0489 & 0.0983 & 1787393.0568 & 3843645.8861 & 1960.5218 \tabularnewline
66 & 0.0945 & 0.1353 & 0.1057 & 17060799.7745 & 6487076.6638 & 2546.974 \tabularnewline
67 & 0.1126 & 0.1583 & 0.1145 & 19212960.3712 & 8608057.2817 & 2933.9491 \tabularnewline
68 & 0.1365 & 0.1211 & 0.1154 & 8617893.8304 & 8609462.5029 & 2934.1886 \tabularnewline
69 & 0.1383 & 0.167 & 0.1219 & 17932784.0985 & 9774877.7024 & 3126.4801 \tabularnewline
70 & 0.1907 & 0.1048 & 0.12 & 4108303.9888 & 9145258.4009 & 3024.1128 \tabularnewline
71 & 0.2144 & 0.1966 & 0.1276 & 12539557.4667 & 9484688.3074 & 3079.7221 \tabularnewline
72 & 0.201 & -0.021 & 0.1179 & 176678.8336 & 8638505.628 & 2939.1335 \tabularnewline
73 & 0.1884 & 0.0916 & 0.1157 & 4146274.5423 & 8264153.0375 & 2874.744 \tabularnewline
74 & 0.2461 & 0.2409 & 0.1254 & 18877338.2722 & 9080551.9017 & 3013.3954 \tabularnewline
75 & 0.3953 & 0.3877 & 0.1441 & 20403315.6556 & 9889320.7413 & 3144.729 \tabularnewline
76 & 0.1606 & -0.0879 & 0.1404 & 6927785.8339 & 9691885.0808 & 3113.1793 \tabularnewline
77 & 0.1834 & 0.0413 & 0.1342 & 1257702.6141 & 9164748.6766 & 3027.3336 \tabularnewline
78 & 0.1697 & 0.1015 & 0.1323 & 9510399.2248 & 9185081.0618 & 3030.6899 \tabularnewline
79 & 0.1934 & 0.0248 & 0.1263 & 468436.6755 & 8700823.0404 & 2949.7158 \tabularnewline
80 & 0.2278 & 0.1944 & 0.1299 & 21955784.3379 & 9398452.5823 & 3065.6896 \tabularnewline
81 & 0.2241 & 0.0154 & 0.1241 & 150667.9525 & 8936063.3509 & 2989.3249 \tabularnewline
82 & 0.3024 & -0.055 & 0.1209 & 1114246.6592 & 8563595.8893 & 2926.3622 \tabularnewline
83 & 0.3333 & 0.1305 & 0.1213 & 5435997.5908 & 8421432.3303 & 2901.9704 \tabularnewline
84 & 0.307 & 0.1512 & 0.1226 & 9005064.9663 & 8446807.6623 & 2906.3392 \tabularnewline
85 & 0.283 & 0.0473 & 0.1195 & 1089900.6024 & 8140269.8682 & 2853.1158 \tabularnewline
\hline
\end{tabular}
%Source: https://freestatistics.org/blog/index.php?pk=151703&T=2

[TABLE]
[ROW][C]Univariate ARIMA Extrapolation Forecast Performance[/C][/ROW]
[ROW][C]time[/C][C]% S.E.[/C][C]PE[/C][C]MAPE[/C][C]Sq.E[/C][C]MSE[/C][C]RMSE[/C][/ROW]
[ROW][C]62[/C][C]0.1067[/C][C]0.0399[/C][C]0[/C][C]516027.2692[/C][C]0[/C][C]0[/C][/ROW]
[ROW][C]63[/C][C]0.1687[/C][C]0.2222[/C][C]0.131[/C][C]6984458.7175[/C][C]3750242.9933[/C][C]1936.5544[/C][/ROW]
[ROW][C]64[/C][C]0.0808[/C][C]-0.0822[/C][C]0.1147[/C][C]6086704.5009[/C][C]4529063.4958[/C][C]2128.1596[/C][/ROW]
[ROW][C]65[/C][C]0.0974[/C][C]-0.0489[/C][C]0.0983[/C][C]1787393.0568[/C][C]3843645.8861[/C][C]1960.5218[/C][/ROW]
[ROW][C]66[/C][C]0.0945[/C][C]0.1353[/C][C]0.1057[/C][C]17060799.7745[/C][C]6487076.6638[/C][C]2546.974[/C][/ROW]
[ROW][C]67[/C][C]0.1126[/C][C]0.1583[/C][C]0.1145[/C][C]19212960.3712[/C][C]8608057.2817[/C][C]2933.9491[/C][/ROW]
[ROW][C]68[/C][C]0.1365[/C][C]0.1211[/C][C]0.1154[/C][C]8617893.8304[/C][C]8609462.5029[/C][C]2934.1886[/C][/ROW]
[ROW][C]69[/C][C]0.1383[/C][C]0.167[/C][C]0.1219[/C][C]17932784.0985[/C][C]9774877.7024[/C][C]3126.4801[/C][/ROW]
[ROW][C]70[/C][C]0.1907[/C][C]0.1048[/C][C]0.12[/C][C]4108303.9888[/C][C]9145258.4009[/C][C]3024.1128[/C][/ROW]
[ROW][C]71[/C][C]0.2144[/C][C]0.1966[/C][C]0.1276[/C][C]12539557.4667[/C][C]9484688.3074[/C][C]3079.7221[/C][/ROW]
[ROW][C]72[/C][C]0.201[/C][C]-0.021[/C][C]0.1179[/C][C]176678.8336[/C][C]8638505.628[/C][C]2939.1335[/C][/ROW]
[ROW][C]73[/C][C]0.1884[/C][C]0.0916[/C][C]0.1157[/C][C]4146274.5423[/C][C]8264153.0375[/C][C]2874.744[/C][/ROW]
[ROW][C]74[/C][C]0.2461[/C][C]0.2409[/C][C]0.1254[/C][C]18877338.2722[/C][C]9080551.9017[/C][C]3013.3954[/C][/ROW]
[ROW][C]75[/C][C]0.3953[/C][C]0.3877[/C][C]0.1441[/C][C]20403315.6556[/C][C]9889320.7413[/C][C]3144.729[/C][/ROW]
[ROW][C]76[/C][C]0.1606[/C][C]-0.0879[/C][C]0.1404[/C][C]6927785.8339[/C][C]9691885.0808[/C][C]3113.1793[/C][/ROW]
[ROW][C]77[/C][C]0.1834[/C][C]0.0413[/C][C]0.1342[/C][C]1257702.6141[/C][C]9164748.6766[/C][C]3027.3336[/C][/ROW]
[ROW][C]78[/C][C]0.1697[/C][C]0.1015[/C][C]0.1323[/C][C]9510399.2248[/C][C]9185081.0618[/C][C]3030.6899[/C][/ROW]
[ROW][C]79[/C][C]0.1934[/C][C]0.0248[/C][C]0.1263[/C][C]468436.6755[/C][C]8700823.0404[/C][C]2949.7158[/C][/ROW]
[ROW][C]80[/C][C]0.2278[/C][C]0.1944[/C][C]0.1299[/C][C]21955784.3379[/C][C]9398452.5823[/C][C]3065.6896[/C][/ROW]
[ROW][C]81[/C][C]0.2241[/C][C]0.0154[/C][C]0.1241[/C][C]150667.9525[/C][C]8936063.3509[/C][C]2989.3249[/C][/ROW]
[ROW][C]82[/C][C]0.3024[/C][C]-0.055[/C][C]0.1209[/C][C]1114246.6592[/C][C]8563595.8893[/C][C]2926.3622[/C][/ROW]
[ROW][C]83[/C][C]0.3333[/C][C]0.1305[/C][C]0.1213[/C][C]5435997.5908[/C][C]8421432.3303[/C][C]2901.9704[/C][/ROW]
[ROW][C]84[/C][C]0.307[/C][C]0.1512[/C][C]0.1226[/C][C]9005064.9663[/C][C]8446807.6623[/C][C]2906.3392[/C][/ROW]
[ROW][C]85[/C][C]0.283[/C][C]0.0473[/C][C]0.1195[/C][C]1089900.6024[/C][C]8140269.8682[/C][C]2853.1158[/C][/ROW]
[/TABLE]
Source: https://freestatistics.org/blog/index.php?pk=151703&T=2

Globally Unique Identifier (entire table): ba.freestatistics.org/blog/index.php?pk=151703&T=2

As an alternative you can also use a QR Code:  

The GUIDs for individual cells are displayed in the table below:

Univariate ARIMA Extrapolation Forecast Performance
time% S.E.PEMAPESq.EMSERMSE
620.10670.03990516027.269200
630.16870.22220.1316984458.71753750242.99331936.5544
640.0808-0.08220.11476086704.50094529063.49582128.1596
650.0974-0.04890.09831787393.05683843645.88611960.5218
660.09450.13530.105717060799.77456487076.66382546.974
670.11260.15830.114519212960.37128608057.28172933.9491
680.13650.12110.11548617893.83048609462.50292934.1886
690.13830.1670.121917932784.09859774877.70243126.4801
700.19070.10480.124108303.98889145258.40093024.1128
710.21440.19660.127612539557.46679484688.30743079.7221
720.201-0.0210.1179176678.83368638505.6282939.1335
730.18840.09160.11574146274.54238264153.03752874.744
740.24610.24090.125418877338.27229080551.90173013.3954
750.39530.38770.144120403315.65569889320.74133144.729
760.1606-0.08790.14046927785.83399691885.08083113.1793
770.18340.04130.13421257702.61419164748.67663027.3336
780.16970.10150.13239510399.22489185081.06183030.6899
790.19340.02480.1263468436.67558700823.04042949.7158
800.22780.19440.129921955784.33799398452.58233065.6896
810.22410.01540.1241150667.95258936063.35092989.3249
820.3024-0.0550.12091114246.65928563595.88932926.3622
830.33330.13050.12135435997.59088421432.33032901.9704
840.3070.15120.12269005064.96638446807.66232906.3392
850.2830.04730.11951089900.60248140269.86822853.1158


Parameters (Session):
par1 = 24 ; par2 = 1 ; par3 = 1 ; par4 = 1 ; par5 = 12 ; par6 = 3 ; par7 = 1 ; par8 = 0 ; par9 = 1 ; par10 = FALSE ;
Parameters (R input):
par1 = 24 ; par2 = 1 ; par3 = 1 ; par4 = 1 ; par5 = 12 ; par6 = 3 ; par7 = 1 ; par8 = 0 ; par9 = 1 ; par10 = FALSE ;
R code (references can be found in the software module):
par1 <- as.numeric(par1) #cut off periods
par2 <- as.numeric(par2) #lambda
par3 <- as.numeric(par3) #degree of non-seasonal differencing
par4 <- as.numeric(par4) #degree of seasonal differencing
par5 <- as.numeric(par5) #seasonal period
par6 <- as.numeric(par6) #p
par7 <- as.numeric(par7) #q
par8 <- as.numeric(par8) #P
par9 <- as.numeric(par9) #Q
if (par10 == 'TRUE') par10 <- TRUE
if (par10 == 'FALSE') par10 <- FALSE
if (par2 == 0) x <- log(x)
if (par2 != 0) x <- x^par2
lx <- length(x)
first <- lx - 2*par1
nx <- lx - par1
nx1 <- nx + 1
fx <- lx - nx
if (fx < 1) {
fx <- par5
nx1 <- lx + fx - 1
first <- lx - 2*fx
}
first <- 1
if (fx < 3) fx <- round(lx/10,0)
(arima.out <- arima(x[1:nx], order=c(par6,par3,par7), seasonal=list(order=c(par8,par4,par9), period=par5), include.mean=par10, method='ML'))
(forecast <- predict(arima.out,par1))
(lb <- forecast$pred - 1.96 * forecast$se)
(ub <- forecast$pred + 1.96 * forecast$se)
if (par2 == 0) {
x <- exp(x)
forecast$pred <- exp(forecast$pred)
lb <- exp(lb)
ub <- exp(ub)
}
if (par2 != 0) {
x <- x^(1/par2)
forecast$pred <- forecast$pred^(1/par2)
lb <- lb^(1/par2)
ub <- ub^(1/par2)
}
if (par2 < 0) {
olb <- lb
lb <- ub
ub <- olb
}
(actandfor <- c(x[1:nx], forecast$pred))
(perc.se <- (ub-forecast$pred)/1.96/forecast$pred)
bitmap(file='test1.png')
opar <- par(mar=c(4,4,2,2),las=1)
ylim <- c( min(x[first:nx],lb), max(x[first:nx],ub))
plot(x,ylim=ylim,type='n',xlim=c(first,lx))
usr <- par('usr')
rect(usr[1],usr[3],nx+1,usr[4],border=NA,col='lemonchiffon')
rect(nx1,usr[3],usr[2],usr[4],border=NA,col='lavender')
abline(h= (-3:3)*2 , col ='gray', lty =3)
polygon( c(nx1:lx,lx:nx1), c(lb,rev(ub)), col = 'orange', lty=2,border=NA)
lines(nx1:lx, lb , lty=2)
lines(nx1:lx, ub , lty=2)
lines(x, lwd=2)
lines(nx1:lx, forecast$pred , lwd=2 , col ='white')
box()
par(opar)
dev.off()
prob.dec <- array(NA, dim=fx)
prob.sdec <- array(NA, dim=fx)
prob.ldec <- array(NA, dim=fx)
prob.pval <- array(NA, dim=fx)
perf.pe <- array(0, dim=fx)
perf.mape <- array(0, dim=fx)
perf.mape1 <- array(0, dim=fx)
perf.se <- array(0, dim=fx)
perf.mse <- array(0, dim=fx)
perf.mse1 <- array(0, dim=fx)
perf.rmse <- array(0, dim=fx)
for (i in 1:fx) {
locSD <- (ub[i] - forecast$pred[i]) / 1.96
perf.pe[i] = (x[nx+i] - forecast$pred[i]) / forecast$pred[i]
perf.se[i] = (x[nx+i] - forecast$pred[i])^2
prob.dec[i] = pnorm((x[nx+i-1] - forecast$pred[i]) / locSD)
prob.sdec[i] = pnorm((x[nx+i-par5] - forecast$pred[i]) / locSD)
prob.ldec[i] = pnorm((x[nx] - forecast$pred[i]) / locSD)
prob.pval[i] = pnorm(abs(x[nx+i] - forecast$pred[i]) / locSD)
}
perf.mape[1] = abs(perf.pe[1])
perf.mse[1] = abs(perf.se[1])
for (i in 2:fx) {
perf.mape[i] = perf.mape[i-1] + abs(perf.pe[i])
perf.mape1[i] = perf.mape[i] / i
perf.mse[i] = perf.mse[i-1] + perf.se[i]
perf.mse1[i] = perf.mse[i] / i
}
perf.rmse = sqrt(perf.mse1)
bitmap(file='test2.png')
plot(forecast$pred, pch=19, type='b',main='ARIMA Extrapolation Forecast', ylab='Forecast and 95% CI', xlab='time',ylim=c(min(lb),max(ub)))
dum <- forecast$pred
dum[1:par1] <- x[(nx+1):lx]
lines(dum, lty=1)
lines(ub,lty=3)
lines(lb,lty=3)
dev.off()
load(file='createtable')
a<-table.start()
a<-table.row.start(a)
a<-table.element(a,'Univariate ARIMA Extrapolation Forecast',9,TRUE)
a<-table.row.end(a)
a<-table.row.start(a)
a<-table.element(a,'time',1,header=TRUE)
a<-table.element(a,'Y[t]',1,header=TRUE)
a<-table.element(a,'F[t]',1,header=TRUE)
a<-table.element(a,'95% LB',1,header=TRUE)
a<-table.element(a,'95% UB',1,header=TRUE)
a<-table.element(a,'p-value
(H0: Y[t] = F[t])',1,header=TRUE)
a<-table.element(a,'P(F[t]>Y[t-1])',1,header=TRUE)
a<-table.element(a,'P(F[t]>Y[t-s])',1,header=TRUE)
mylab <- paste('P(F[t]>Y[',nx,sep='')
mylab <- paste(mylab,'])',sep='')
a<-table.element(a,mylab,1,header=TRUE)
a<-table.row.end(a)
for (i in (nx-par5):nx) {
a<-table.row.start(a)
a<-table.element(a,i,header=TRUE)
a<-table.element(a,x[i])
a<-table.element(a,'-')
a<-table.row.end(a)
}
for (i in 1:fx) {
a<-table.row.start(a)
a<-table.element(a,nx+i,header=TRUE)
a<-table.element(a,round(x[nx+i],4))
a<-table.element(a,round(forecast$pred[i],4))
a<-table.element(a,round(lb[i],4))
a<-table.element(a,round(ub[i],4))
a<-table.element(a,round((1-prob.pval[i]),4))
a<-table.element(a,round((1-prob.dec[i]),4))
a<-table.element(a,round((1-prob.sdec[i]),4))
a<-table.element(a,round((1-prob.ldec[i]),4))
a<-table.row.end(a)
}
a<-table.end(a)
table.save(a,file='mytable.tab')
a<-table.start()
a<-table.row.start(a)
a<-table.element(a,'Univariate ARIMA Extrapolation Forecast Performance',7,TRUE)
a<-table.row.end(a)
a<-table.row.start(a)
a<-table.element(a,'time',1,header=TRUE)
a<-table.element(a,'% S.E.',1,header=TRUE)
a<-table.element(a,'PE',1,header=TRUE)
a<-table.element(a,'MAPE',1,header=TRUE)
a<-table.element(a,'Sq.E',1,header=TRUE)
a<-table.element(a,'MSE',1,header=TRUE)
a<-table.element(a,'RMSE',1,header=TRUE)
a<-table.row.end(a)
for (i in 1:fx) {
a<-table.row.start(a)
a<-table.element(a,nx+i,header=TRUE)
a<-table.element(a,round(perc.se[i],4))
a<-table.element(a,round(perf.pe[i],4))
a<-table.element(a,round(perf.mape1[i],4))
a<-table.element(a,round(perf.se[i],4))
a<-table.element(a,round(perf.mse1[i],4))
a<-table.element(a,round(perf.rmse[i],4))
a<-table.row.end(a)
}
a<-table.end(a)
table.save(a,file='mytable1.tab')