Free Statistics

of Irreproducible Research!

Author's title

Author*The author of this computation has been verified*
R Software Modulerwasp_arimaforecasting.wasp
Title produced by softwareARIMA Forecasting
Date of computationTue, 06 Dec 2011 09:28:31 -0500
Cite this page as followsStatistical Computations at FreeStatistics.org, Office for Research Development and Education, URL https://freestatistics.org/blog/index.php?v=date/2011/Dec/06/t13231819486si29402r8i2u5x.htm/, Retrieved Mon, 29 Apr 2024 07:22:53 +0000
Statistical Computations at FreeStatistics.org, Office for Research Development and Education, URL https://freestatistics.org/blog/index.php?pk=151612, Retrieved Mon, 29 Apr 2024 07:22:53 +0000
QR Codes:

Original text written by user:
IsPrivate?No (this computation is public)
User-defined keywords
Estimated Impact146
Family? (F = Feedback message, R = changed R code, M = changed R Module, P = changed Parameters, D = changed Data)
-       [ARIMA Forecasting] [] [2011-12-06 14:28:31] [fe5ec8748c528a1557751a5a0f6a19ab] [Current]
- R P     [ARIMA Forecasting] [] [2011-12-06 15:22:46] [bdca8f3e7c3554be8c1291e54f61d441]
- RM        [ARIMA Forecasting] [] [2012-12-04 19:35:50] [74be16979710d4c4e7c6647856088456]
- RM        [ARIMA Forecasting] [] [2012-12-04 19:36:44] [74be16979710d4c4e7c6647856088456]
Feedback Forum

Post a new message
Dataseries X:
9007
8106
8928
9137
10017
10826
11317
10744
9713
9938
9161
8927
7750
6981
8038
8422
8714
9512
10120
9823
8743
9129
8710
8680
8162
7306
8124
7870
9387
9556
10093
9620
8285
8433
8160
8034
7717
7461
7776
7925
8634
8945
10078
9179
8037
8488
7874
8647
7792
6957
7726
8106
8890
9299
10625
9302
8314
8850
8265
8796
7836
6892
7791
8129
9115
9434
10484
9827
9110
9070
8633
9240


Summary of computational transaction
Raw Inputview raw input (R code)
Raw Outputview raw output of R engine
Computing time1 seconds
R Server'Gertrude Mary Cox' @ cox.wessa.net

\begin{tabular}{lllllllll}
\hline
Summary of computational transaction \tabularnewline
Raw Input & view raw input (R code)  \tabularnewline
Raw Output & view raw output of R engine  \tabularnewline
Computing time & 1 seconds \tabularnewline
R Server & 'Gertrude Mary Cox' @ cox.wessa.net \tabularnewline
\hline
\end{tabular}
%Source: https://freestatistics.org/blog/index.php?pk=151612&T=0

[TABLE]
[ROW][C]Summary of computational transaction[/C][/ROW]
[ROW][C]Raw Input[/C][C]view raw input (R code) [/C][/ROW]
[ROW][C]Raw Output[/C][C]view raw output of R engine [/C][/ROW]
[ROW][C]Computing time[/C][C]1 seconds[/C][/ROW]
[ROW][C]R Server[/C][C]'Gertrude Mary Cox' @ cox.wessa.net[/C][/ROW]
[/TABLE]
Source: https://freestatistics.org/blog/index.php?pk=151612&T=0

Globally Unique Identifier (entire table): ba.freestatistics.org/blog/index.php?pk=151612&T=0

As an alternative you can also use a QR Code:  

The GUIDs for individual cells are displayed in the table below:

Summary of computational transaction
Raw Inputview raw input (R code)
Raw Outputview raw output of R engine
Computing time1 seconds
R Server'Gertrude Mary Cox' @ cox.wessa.net


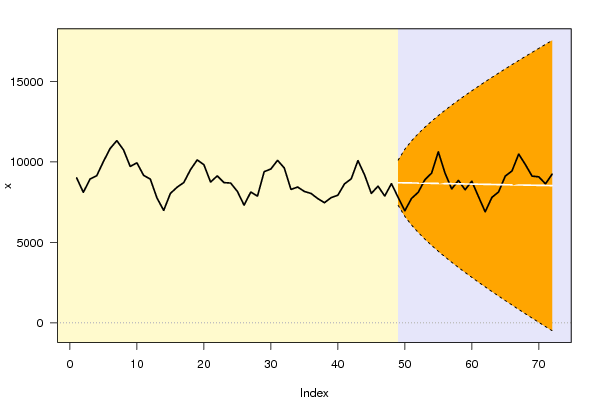
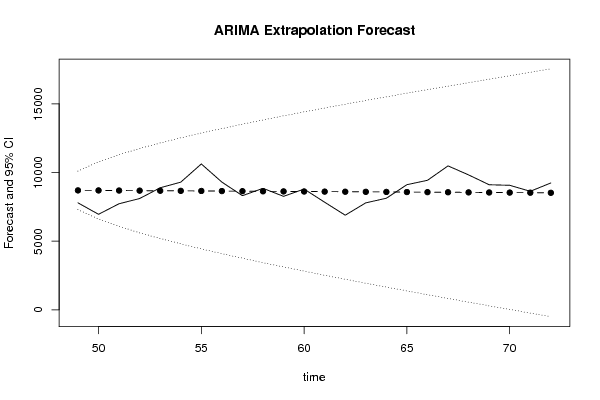
Univariate ARIMA Extrapolation Forecast
timeY[t]F[t]95% LB95% UBp-value(H0: Y[t] = F[t])P(F[t]>Y[t-1])P(F[t]>Y[t-s])P(F[t]>Y[48])
477874-------
488647-------
4977928699.18597295.869610102.50220.10260.52910.52910.5291
5069578695.9456612.401810779.48810.05090.80240.80240.5184
5177268688.44216074.252311302.63190.23530.90290.90290.5124
5281068680.61145610.635111750.58780.35690.72890.72890.5086
5388908672.75565192.57812152.93320.45130.62520.62520.5058
5492998664.89784805.559712524.23590.37370.45450.45450.5036
55106258657.03994441.212872.87980.18010.38270.38270.5019
5693028649.1824094.175713204.18830.38940.19760.19760.5004
5783148641.3243760.871313521.77680.44770.39540.39540.4991
5888508633.46613438.707613828.22460.46740.5480.5480.498
5982658625.60823125.774214125.44220.44890.46810.46810.497
6087968617.75022820.613714414.88680.4760.54750.54750.4961
6178368609.89232522.087214697.69740.40160.47610.47610.4952
6268928602.03442229.286914974.78190.29950.59310.59310.4945
6377918594.17641941.476915246.87590.40650.6920.6920.4938
6481298586.31851658.052415514.58460.44850.5890.5890.4932
6591158578.46061378.509715778.41140.44190.54870.54870.4926
6694348570.60261102.425316038.780.41040.44320.44320.492
67104848562.7447829.439116296.05030.31320.41260.41260.4915
6898278554.8867559.243116550.53040.37760.31810.31810.491
6991108547.0288291.571216802.48640.44680.38060.38060.4905
7090708539.170926.192317052.14940.45140.44770.44770.4901
7186338531.3129-237.095617299.72150.49090.45210.45210.4897
7292408523.455-498.470117545.38010.43810.49050.49050.4893

\begin{tabular}{lllllllll}
\hline
Univariate ARIMA Extrapolation Forecast \tabularnewline
time & Y[t] & F[t] & 95% LB & 95% UB & p-value(H0: Y[t] = F[t]) & P(F[t]>Y[t-1]) & P(F[t]>Y[t-s]) & P(F[t]>Y[48]) \tabularnewline
47 & 7874 & - & - & - & - & - & - & - \tabularnewline
48 & 8647 & - & - & - & - & - & - & - \tabularnewline
49 & 7792 & 8699.1859 & 7295.8696 & 10102.5022 & 0.1026 & 0.5291 & 0.5291 & 0.5291 \tabularnewline
50 & 6957 & 8695.945 & 6612.4018 & 10779.4881 & 0.0509 & 0.8024 & 0.8024 & 0.5184 \tabularnewline
51 & 7726 & 8688.4421 & 6074.2523 & 11302.6319 & 0.2353 & 0.9029 & 0.9029 & 0.5124 \tabularnewline
52 & 8106 & 8680.6114 & 5610.6351 & 11750.5878 & 0.3569 & 0.7289 & 0.7289 & 0.5086 \tabularnewline
53 & 8890 & 8672.7556 & 5192.578 & 12152.9332 & 0.4513 & 0.6252 & 0.6252 & 0.5058 \tabularnewline
54 & 9299 & 8664.8978 & 4805.5597 & 12524.2359 & 0.3737 & 0.4545 & 0.4545 & 0.5036 \tabularnewline
55 & 10625 & 8657.0399 & 4441.2 & 12872.8798 & 0.1801 & 0.3827 & 0.3827 & 0.5019 \tabularnewline
56 & 9302 & 8649.182 & 4094.1757 & 13204.1883 & 0.3894 & 0.1976 & 0.1976 & 0.5004 \tabularnewline
57 & 8314 & 8641.324 & 3760.8713 & 13521.7768 & 0.4477 & 0.3954 & 0.3954 & 0.4991 \tabularnewline
58 & 8850 & 8633.4661 & 3438.7076 & 13828.2246 & 0.4674 & 0.548 & 0.548 & 0.498 \tabularnewline
59 & 8265 & 8625.6082 & 3125.7742 & 14125.4422 & 0.4489 & 0.4681 & 0.4681 & 0.497 \tabularnewline
60 & 8796 & 8617.7502 & 2820.6137 & 14414.8868 & 0.476 & 0.5475 & 0.5475 & 0.4961 \tabularnewline
61 & 7836 & 8609.8923 & 2522.0872 & 14697.6974 & 0.4016 & 0.4761 & 0.4761 & 0.4952 \tabularnewline
62 & 6892 & 8602.0344 & 2229.2869 & 14974.7819 & 0.2995 & 0.5931 & 0.5931 & 0.4945 \tabularnewline
63 & 7791 & 8594.1764 & 1941.4769 & 15246.8759 & 0.4065 & 0.692 & 0.692 & 0.4938 \tabularnewline
64 & 8129 & 8586.3185 & 1658.0524 & 15514.5846 & 0.4485 & 0.589 & 0.589 & 0.4932 \tabularnewline
65 & 9115 & 8578.4606 & 1378.5097 & 15778.4114 & 0.4419 & 0.5487 & 0.5487 & 0.4926 \tabularnewline
66 & 9434 & 8570.6026 & 1102.4253 & 16038.78 & 0.4104 & 0.4432 & 0.4432 & 0.492 \tabularnewline
67 & 10484 & 8562.7447 & 829.4391 & 16296.0503 & 0.3132 & 0.4126 & 0.4126 & 0.4915 \tabularnewline
68 & 9827 & 8554.8867 & 559.2431 & 16550.5304 & 0.3776 & 0.3181 & 0.3181 & 0.491 \tabularnewline
69 & 9110 & 8547.0288 & 291.5712 & 16802.4864 & 0.4468 & 0.3806 & 0.3806 & 0.4905 \tabularnewline
70 & 9070 & 8539.1709 & 26.1923 & 17052.1494 & 0.4514 & 0.4477 & 0.4477 & 0.4901 \tabularnewline
71 & 8633 & 8531.3129 & -237.0956 & 17299.7215 & 0.4909 & 0.4521 & 0.4521 & 0.4897 \tabularnewline
72 & 9240 & 8523.455 & -498.4701 & 17545.3801 & 0.4381 & 0.4905 & 0.4905 & 0.4893 \tabularnewline
\hline
\end{tabular}
%Source: https://freestatistics.org/blog/index.php?pk=151612&T=1

[TABLE]
[ROW][C]Univariate ARIMA Extrapolation Forecast[/C][/ROW]
[ROW][C]time[/C][C]Y[t][/C][C]F[t][/C][C]95% LB[/C][C]95% UB[/C][C]p-value(H0: Y[t] = F[t])[/C][C]P(F[t]>Y[t-1])[/C][C]P(F[t]>Y[t-s])[/C][C]P(F[t]>Y[48])[/C][/ROW]
[ROW][C]47[/C][C]7874[/C][C]-[/C][C]-[/C][C]-[/C][C]-[/C][C]-[/C][C]-[/C][C]-[/C][/ROW]
[ROW][C]48[/C][C]8647[/C][C]-[/C][C]-[/C][C]-[/C][C]-[/C][C]-[/C][C]-[/C][C]-[/C][/ROW]
[ROW][C]49[/C][C]7792[/C][C]8699.1859[/C][C]7295.8696[/C][C]10102.5022[/C][C]0.1026[/C][C]0.5291[/C][C]0.5291[/C][C]0.5291[/C][/ROW]
[ROW][C]50[/C][C]6957[/C][C]8695.945[/C][C]6612.4018[/C][C]10779.4881[/C][C]0.0509[/C][C]0.8024[/C][C]0.8024[/C][C]0.5184[/C][/ROW]
[ROW][C]51[/C][C]7726[/C][C]8688.4421[/C][C]6074.2523[/C][C]11302.6319[/C][C]0.2353[/C][C]0.9029[/C][C]0.9029[/C][C]0.5124[/C][/ROW]
[ROW][C]52[/C][C]8106[/C][C]8680.6114[/C][C]5610.6351[/C][C]11750.5878[/C][C]0.3569[/C][C]0.7289[/C][C]0.7289[/C][C]0.5086[/C][/ROW]
[ROW][C]53[/C][C]8890[/C][C]8672.7556[/C][C]5192.578[/C][C]12152.9332[/C][C]0.4513[/C][C]0.6252[/C][C]0.6252[/C][C]0.5058[/C][/ROW]
[ROW][C]54[/C][C]9299[/C][C]8664.8978[/C][C]4805.5597[/C][C]12524.2359[/C][C]0.3737[/C][C]0.4545[/C][C]0.4545[/C][C]0.5036[/C][/ROW]
[ROW][C]55[/C][C]10625[/C][C]8657.0399[/C][C]4441.2[/C][C]12872.8798[/C][C]0.1801[/C][C]0.3827[/C][C]0.3827[/C][C]0.5019[/C][/ROW]
[ROW][C]56[/C][C]9302[/C][C]8649.182[/C][C]4094.1757[/C][C]13204.1883[/C][C]0.3894[/C][C]0.1976[/C][C]0.1976[/C][C]0.5004[/C][/ROW]
[ROW][C]57[/C][C]8314[/C][C]8641.324[/C][C]3760.8713[/C][C]13521.7768[/C][C]0.4477[/C][C]0.3954[/C][C]0.3954[/C][C]0.4991[/C][/ROW]
[ROW][C]58[/C][C]8850[/C][C]8633.4661[/C][C]3438.7076[/C][C]13828.2246[/C][C]0.4674[/C][C]0.548[/C][C]0.548[/C][C]0.498[/C][/ROW]
[ROW][C]59[/C][C]8265[/C][C]8625.6082[/C][C]3125.7742[/C][C]14125.4422[/C][C]0.4489[/C][C]0.4681[/C][C]0.4681[/C][C]0.497[/C][/ROW]
[ROW][C]60[/C][C]8796[/C][C]8617.7502[/C][C]2820.6137[/C][C]14414.8868[/C][C]0.476[/C][C]0.5475[/C][C]0.5475[/C][C]0.4961[/C][/ROW]
[ROW][C]61[/C][C]7836[/C][C]8609.8923[/C][C]2522.0872[/C][C]14697.6974[/C][C]0.4016[/C][C]0.4761[/C][C]0.4761[/C][C]0.4952[/C][/ROW]
[ROW][C]62[/C][C]6892[/C][C]8602.0344[/C][C]2229.2869[/C][C]14974.7819[/C][C]0.2995[/C][C]0.5931[/C][C]0.5931[/C][C]0.4945[/C][/ROW]
[ROW][C]63[/C][C]7791[/C][C]8594.1764[/C][C]1941.4769[/C][C]15246.8759[/C][C]0.4065[/C][C]0.692[/C][C]0.692[/C][C]0.4938[/C][/ROW]
[ROW][C]64[/C][C]8129[/C][C]8586.3185[/C][C]1658.0524[/C][C]15514.5846[/C][C]0.4485[/C][C]0.589[/C][C]0.589[/C][C]0.4932[/C][/ROW]
[ROW][C]65[/C][C]9115[/C][C]8578.4606[/C][C]1378.5097[/C][C]15778.4114[/C][C]0.4419[/C][C]0.5487[/C][C]0.5487[/C][C]0.4926[/C][/ROW]
[ROW][C]66[/C][C]9434[/C][C]8570.6026[/C][C]1102.4253[/C][C]16038.78[/C][C]0.4104[/C][C]0.4432[/C][C]0.4432[/C][C]0.492[/C][/ROW]
[ROW][C]67[/C][C]10484[/C][C]8562.7447[/C][C]829.4391[/C][C]16296.0503[/C][C]0.3132[/C][C]0.4126[/C][C]0.4126[/C][C]0.4915[/C][/ROW]
[ROW][C]68[/C][C]9827[/C][C]8554.8867[/C][C]559.2431[/C][C]16550.5304[/C][C]0.3776[/C][C]0.3181[/C][C]0.3181[/C][C]0.491[/C][/ROW]
[ROW][C]69[/C][C]9110[/C][C]8547.0288[/C][C]291.5712[/C][C]16802.4864[/C][C]0.4468[/C][C]0.3806[/C][C]0.3806[/C][C]0.4905[/C][/ROW]
[ROW][C]70[/C][C]9070[/C][C]8539.1709[/C][C]26.1923[/C][C]17052.1494[/C][C]0.4514[/C][C]0.4477[/C][C]0.4477[/C][C]0.4901[/C][/ROW]
[ROW][C]71[/C][C]8633[/C][C]8531.3129[/C][C]-237.0956[/C][C]17299.7215[/C][C]0.4909[/C][C]0.4521[/C][C]0.4521[/C][C]0.4897[/C][/ROW]
[ROW][C]72[/C][C]9240[/C][C]8523.455[/C][C]-498.4701[/C][C]17545.3801[/C][C]0.4381[/C][C]0.4905[/C][C]0.4905[/C][C]0.4893[/C][/ROW]
[/TABLE]
Source: https://freestatistics.org/blog/index.php?pk=151612&T=1

Globally Unique Identifier (entire table): ba.freestatistics.org/blog/index.php?pk=151612&T=1

As an alternative you can also use a QR Code:  

The GUIDs for individual cells are displayed in the table below:

Univariate ARIMA Extrapolation Forecast
timeY[t]F[t]95% LB95% UBp-value(H0: Y[t] = F[t])P(F[t]>Y[t-1])P(F[t]>Y[t-s])P(F[t]>Y[48])
477874-------
488647-------
4977928699.18597295.869610102.50220.10260.52910.52910.5291
5069578695.9456612.401810779.48810.05090.80240.80240.5184
5177268688.44216074.252311302.63190.23530.90290.90290.5124
5281068680.61145610.635111750.58780.35690.72890.72890.5086
5388908672.75565192.57812152.93320.45130.62520.62520.5058
5492998664.89784805.559712524.23590.37370.45450.45450.5036
55106258657.03994441.212872.87980.18010.38270.38270.5019
5693028649.1824094.175713204.18830.38940.19760.19760.5004
5783148641.3243760.871313521.77680.44770.39540.39540.4991
5888508633.46613438.707613828.22460.46740.5480.5480.498
5982658625.60823125.774214125.44220.44890.46810.46810.497
6087968617.75022820.613714414.88680.4760.54750.54750.4961
6178368609.89232522.087214697.69740.40160.47610.47610.4952
6268928602.03442229.286914974.78190.29950.59310.59310.4945
6377918594.17641941.476915246.87590.40650.6920.6920.4938
6481298586.31851658.052415514.58460.44850.5890.5890.4932
6591158578.46061378.509715778.41140.44190.54870.54870.4926
6694348570.60261102.425316038.780.41040.44320.44320.492
67104848562.7447829.439116296.05030.31320.41260.41260.4915
6898278554.8867559.243116550.53040.37760.31810.31810.491
6991108547.0288291.571216802.48640.44680.38060.38060.4905
7090708539.170926.192317052.14940.45140.44770.44770.4901
7186338531.3129-237.095617299.72150.49090.45210.45210.4897
7292408523.455-498.470117545.38010.43810.49050.49050.4893


Univariate ARIMA Extrapolation Forecast Performance
time% S.E.PEMAPESq.EMSERMSE
490.0823-0.10430822986.202300
500.1222-0.20.15213023929.65171923457.9271386.8879
510.1535-0.11080.1383926294.74471591070.19951261.3763
520.1804-0.06620.1203330178.30441275847.22581129.5341
530.20470.0250.101347195.12861030116.80631014.9467
540.22720.07320.0966402085.5649925444.9328962.0005
550.24850.22730.11533872866.93611346505.2191160.3901
560.26870.07550.1103426171.37971231463.4891109.7132
570.2882-0.03790.1022107141.02411106538.77071051.9215
580.3070.02510.094546886.92991000573.58661000.2868
590.3253-0.04180.0897130038.2484921434.0104959.9135
600.34320.02070.08431772.9807847295.5913920.4866
610.3608-0.08990.0844598909.2828828188.9522910.0489
620.378-0.19880.09262924217.5081977905.2776988.8909
630.3949-0.09350.0927645092.3672955717.7502977.6082
640.4117-0.05330.0902209140.1996909056.6533953.4446
650.42820.06250.0886287874.5784872516.5313934.0859
660.44460.10070.0892745455.0401865457.5595930.2997
670.46080.22440.09643691221.99611014182.00361007.066
680.47690.14870.0991618272.12871044386.50981021.9523
690.49280.06590.0974316936.55891009746.0361004.8612
700.50860.06220.0958281779.5586976656.6506988.2594
710.52440.01190.092110340.258934642.8944966.7693
720.540.08410.0918513436.7288917092.6375957.6495

\begin{tabular}{lllllllll}
\hline
Univariate ARIMA Extrapolation Forecast Performance \tabularnewline
time & % S.E. & PE & MAPE & Sq.E & MSE & RMSE \tabularnewline
49 & 0.0823 & -0.1043 & 0 & 822986.2023 & 0 & 0 \tabularnewline
50 & 0.1222 & -0.2 & 0.1521 & 3023929.6517 & 1923457.927 & 1386.8879 \tabularnewline
51 & 0.1535 & -0.1108 & 0.1383 & 926294.7447 & 1591070.1995 & 1261.3763 \tabularnewline
52 & 0.1804 & -0.0662 & 0.1203 & 330178.3044 & 1275847.2258 & 1129.5341 \tabularnewline
53 & 0.2047 & 0.025 & 0.1013 & 47195.1286 & 1030116.8063 & 1014.9467 \tabularnewline
54 & 0.2272 & 0.0732 & 0.0966 & 402085.5649 & 925444.9328 & 962.0005 \tabularnewline
55 & 0.2485 & 0.2273 & 0.1153 & 3872866.9361 & 1346505.219 & 1160.3901 \tabularnewline
56 & 0.2687 & 0.0755 & 0.1103 & 426171.3797 & 1231463.489 & 1109.7132 \tabularnewline
57 & 0.2882 & -0.0379 & 0.1022 & 107141.0241 & 1106538.7707 & 1051.9215 \tabularnewline
58 & 0.307 & 0.0251 & 0.0945 & 46886.9299 & 1000573.5866 & 1000.2868 \tabularnewline
59 & 0.3253 & -0.0418 & 0.0897 & 130038.2484 & 921434.0104 & 959.9135 \tabularnewline
60 & 0.3432 & 0.0207 & 0.084 & 31772.9807 & 847295.5913 & 920.4866 \tabularnewline
61 & 0.3608 & -0.0899 & 0.0844 & 598909.2828 & 828188.9522 & 910.0489 \tabularnewline
62 & 0.378 & -0.1988 & 0.0926 & 2924217.5081 & 977905.2776 & 988.8909 \tabularnewline
63 & 0.3949 & -0.0935 & 0.0927 & 645092.3672 & 955717.7502 & 977.6082 \tabularnewline
64 & 0.4117 & -0.0533 & 0.0902 & 209140.1996 & 909056.6533 & 953.4446 \tabularnewline
65 & 0.4282 & 0.0625 & 0.0886 & 287874.5784 & 872516.5313 & 934.0859 \tabularnewline
66 & 0.4446 & 0.1007 & 0.0892 & 745455.0401 & 865457.5595 & 930.2997 \tabularnewline
67 & 0.4608 & 0.2244 & 0.0964 & 3691221.9961 & 1014182.0036 & 1007.066 \tabularnewline
68 & 0.4769 & 0.1487 & 0.099 & 1618272.1287 & 1044386.5098 & 1021.9523 \tabularnewline
69 & 0.4928 & 0.0659 & 0.0974 & 316936.5589 & 1009746.036 & 1004.8612 \tabularnewline
70 & 0.5086 & 0.0622 & 0.0958 & 281779.5586 & 976656.6506 & 988.2594 \tabularnewline
71 & 0.5244 & 0.0119 & 0.0921 & 10340.258 & 934642.8944 & 966.7693 \tabularnewline
72 & 0.54 & 0.0841 & 0.0918 & 513436.7288 & 917092.6375 & 957.6495 \tabularnewline
\hline
\end{tabular}
%Source: https://freestatistics.org/blog/index.php?pk=151612&T=2

[TABLE]
[ROW][C]Univariate ARIMA Extrapolation Forecast Performance[/C][/ROW]
[ROW][C]time[/C][C]% S.E.[/C][C]PE[/C][C]MAPE[/C][C]Sq.E[/C][C]MSE[/C][C]RMSE[/C][/ROW]
[ROW][C]49[/C][C]0.0823[/C][C]-0.1043[/C][C]0[/C][C]822986.2023[/C][C]0[/C][C]0[/C][/ROW]
[ROW][C]50[/C][C]0.1222[/C][C]-0.2[/C][C]0.1521[/C][C]3023929.6517[/C][C]1923457.927[/C][C]1386.8879[/C][/ROW]
[ROW][C]51[/C][C]0.1535[/C][C]-0.1108[/C][C]0.1383[/C][C]926294.7447[/C][C]1591070.1995[/C][C]1261.3763[/C][/ROW]
[ROW][C]52[/C][C]0.1804[/C][C]-0.0662[/C][C]0.1203[/C][C]330178.3044[/C][C]1275847.2258[/C][C]1129.5341[/C][/ROW]
[ROW][C]53[/C][C]0.2047[/C][C]0.025[/C][C]0.1013[/C][C]47195.1286[/C][C]1030116.8063[/C][C]1014.9467[/C][/ROW]
[ROW][C]54[/C][C]0.2272[/C][C]0.0732[/C][C]0.0966[/C][C]402085.5649[/C][C]925444.9328[/C][C]962.0005[/C][/ROW]
[ROW][C]55[/C][C]0.2485[/C][C]0.2273[/C][C]0.1153[/C][C]3872866.9361[/C][C]1346505.219[/C][C]1160.3901[/C][/ROW]
[ROW][C]56[/C][C]0.2687[/C][C]0.0755[/C][C]0.1103[/C][C]426171.3797[/C][C]1231463.489[/C][C]1109.7132[/C][/ROW]
[ROW][C]57[/C][C]0.2882[/C][C]-0.0379[/C][C]0.1022[/C][C]107141.0241[/C][C]1106538.7707[/C][C]1051.9215[/C][/ROW]
[ROW][C]58[/C][C]0.307[/C][C]0.0251[/C][C]0.0945[/C][C]46886.9299[/C][C]1000573.5866[/C][C]1000.2868[/C][/ROW]
[ROW][C]59[/C][C]0.3253[/C][C]-0.0418[/C][C]0.0897[/C][C]130038.2484[/C][C]921434.0104[/C][C]959.9135[/C][/ROW]
[ROW][C]60[/C][C]0.3432[/C][C]0.0207[/C][C]0.084[/C][C]31772.9807[/C][C]847295.5913[/C][C]920.4866[/C][/ROW]
[ROW][C]61[/C][C]0.3608[/C][C]-0.0899[/C][C]0.0844[/C][C]598909.2828[/C][C]828188.9522[/C][C]910.0489[/C][/ROW]
[ROW][C]62[/C][C]0.378[/C][C]-0.1988[/C][C]0.0926[/C][C]2924217.5081[/C][C]977905.2776[/C][C]988.8909[/C][/ROW]
[ROW][C]63[/C][C]0.3949[/C][C]-0.0935[/C][C]0.0927[/C][C]645092.3672[/C][C]955717.7502[/C][C]977.6082[/C][/ROW]
[ROW][C]64[/C][C]0.4117[/C][C]-0.0533[/C][C]0.0902[/C][C]209140.1996[/C][C]909056.6533[/C][C]953.4446[/C][/ROW]
[ROW][C]65[/C][C]0.4282[/C][C]0.0625[/C][C]0.0886[/C][C]287874.5784[/C][C]872516.5313[/C][C]934.0859[/C][/ROW]
[ROW][C]66[/C][C]0.4446[/C][C]0.1007[/C][C]0.0892[/C][C]745455.0401[/C][C]865457.5595[/C][C]930.2997[/C][/ROW]
[ROW][C]67[/C][C]0.4608[/C][C]0.2244[/C][C]0.0964[/C][C]3691221.9961[/C][C]1014182.0036[/C][C]1007.066[/C][/ROW]
[ROW][C]68[/C][C]0.4769[/C][C]0.1487[/C][C]0.099[/C][C]1618272.1287[/C][C]1044386.5098[/C][C]1021.9523[/C][/ROW]
[ROW][C]69[/C][C]0.4928[/C][C]0.0659[/C][C]0.0974[/C][C]316936.5589[/C][C]1009746.036[/C][C]1004.8612[/C][/ROW]
[ROW][C]70[/C][C]0.5086[/C][C]0.0622[/C][C]0.0958[/C][C]281779.5586[/C][C]976656.6506[/C][C]988.2594[/C][/ROW]
[ROW][C]71[/C][C]0.5244[/C][C]0.0119[/C][C]0.0921[/C][C]10340.258[/C][C]934642.8944[/C][C]966.7693[/C][/ROW]
[ROW][C]72[/C][C]0.54[/C][C]0.0841[/C][C]0.0918[/C][C]513436.7288[/C][C]917092.6375[/C][C]957.6495[/C][/ROW]
[/TABLE]
Source: https://freestatistics.org/blog/index.php?pk=151612&T=2

Globally Unique Identifier (entire table): ba.freestatistics.org/blog/index.php?pk=151612&T=2

As an alternative you can also use a QR Code:  

The GUIDs for individual cells are displayed in the table below:

Univariate ARIMA Extrapolation Forecast Performance
time% S.E.PEMAPESq.EMSERMSE
490.0823-0.10430822986.202300
500.1222-0.20.15213023929.65171923457.9271386.8879
510.1535-0.11080.1383926294.74471591070.19951261.3763
520.1804-0.06620.1203330178.30441275847.22581129.5341
530.20470.0250.101347195.12861030116.80631014.9467
540.22720.07320.0966402085.5649925444.9328962.0005
550.24850.22730.11533872866.93611346505.2191160.3901
560.26870.07550.1103426171.37971231463.4891109.7132
570.2882-0.03790.1022107141.02411106538.77071051.9215
580.3070.02510.094546886.92991000573.58661000.2868
590.3253-0.04180.0897130038.2484921434.0104959.9135
600.34320.02070.08431772.9807847295.5913920.4866
610.3608-0.08990.0844598909.2828828188.9522910.0489
620.378-0.19880.09262924217.5081977905.2776988.8909
630.3949-0.09350.0927645092.3672955717.7502977.6082
640.4117-0.05330.0902209140.1996909056.6533953.4446
650.42820.06250.0886287874.5784872516.5313934.0859
660.44460.10070.0892745455.0401865457.5595930.2997
670.46080.22440.09643691221.99611014182.00361007.066
680.47690.14870.0991618272.12871044386.50981021.9523
690.49280.06590.0974316936.55891009746.0361004.8612
700.50860.06220.0958281779.5586976656.6506988.2594
710.52440.01190.092110340.258934642.8944966.7693
720.540.08410.0918513436.7288917092.6375957.6495


Parameters (Session):
par1 = 24 ; par2 = 1 ; par3 = 1 ; par4 = 1 ; par5 = 1 ; par6 = 0 ; par7 = 1 ; par8 = 1 ; par9 = 0 ; par10 = FALSE ;
Parameters (R input):
par1 = 24 ; par2 = 1 ; par3 = 1 ; par4 = 1 ; par5 = 1 ; par6 = 0 ; par7 = 1 ; par8 = 1 ; par9 = 0 ; par10 = FALSE ;
R code (references can be found in the software module):
par1 <- as.numeric(par1) #cut off periods
par2 <- as.numeric(par2) #lambda
par3 <- as.numeric(par3) #degree of non-seasonal differencing
par4 <- as.numeric(par4) #degree of seasonal differencing
par5 <- as.numeric(par5) #seasonal period
par6 <- as.numeric(par6) #p
par7 <- as.numeric(par7) #q
par8 <- as.numeric(par8) #P
par9 <- as.numeric(par9) #Q
if (par10 == 'TRUE') par10 <- TRUE
if (par10 == 'FALSE') par10 <- FALSE
if (par2 == 0) x <- log(x)
if (par2 != 0) x <- x^par2
lx <- length(x)
first <- lx - 2*par1
nx <- lx - par1
nx1 <- nx + 1
fx <- lx - nx
if (fx < 1) {
fx <- par5
nx1 <- lx + fx - 1
first <- lx - 2*fx
}
first <- 1
if (fx < 3) fx <- round(lx/10,0)
(arima.out <- arima(x[1:nx], order=c(par6,par3,par7), seasonal=list(order=c(par8,par4,par9), period=par5), include.mean=par10, method='ML'))
(forecast <- predict(arima.out,par1))
(lb <- forecast$pred - 1.96 * forecast$se)
(ub <- forecast$pred + 1.96 * forecast$se)
if (par2 == 0) {
x <- exp(x)
forecast$pred <- exp(forecast$pred)
lb <- exp(lb)
ub <- exp(ub)
}
if (par2 != 0) {
x <- x^(1/par2)
forecast$pred <- forecast$pred^(1/par2)
lb <- lb^(1/par2)
ub <- ub^(1/par2)
}
if (par2 < 0) {
olb <- lb
lb <- ub
ub <- olb
}
(actandfor <- c(x[1:nx], forecast$pred))
(perc.se <- (ub-forecast$pred)/1.96/forecast$pred)
bitmap(file='test1.png')
opar <- par(mar=c(4,4,2,2),las=1)
ylim <- c( min(x[first:nx],lb), max(x[first:nx],ub))
plot(x,ylim=ylim,type='n',xlim=c(first,lx))
usr <- par('usr')
rect(usr[1],usr[3],nx+1,usr[4],border=NA,col='lemonchiffon')
rect(nx1,usr[3],usr[2],usr[4],border=NA,col='lavender')
abline(h= (-3:3)*2 , col ='gray', lty =3)
polygon( c(nx1:lx,lx:nx1), c(lb,rev(ub)), col = 'orange', lty=2,border=NA)
lines(nx1:lx, lb , lty=2)
lines(nx1:lx, ub , lty=2)
lines(x, lwd=2)
lines(nx1:lx, forecast$pred , lwd=2 , col ='white')
box()
par(opar)
dev.off()
prob.dec <- array(NA, dim=fx)
prob.sdec <- array(NA, dim=fx)
prob.ldec <- array(NA, dim=fx)
prob.pval <- array(NA, dim=fx)
perf.pe <- array(0, dim=fx)
perf.mape <- array(0, dim=fx)
perf.mape1 <- array(0, dim=fx)
perf.se <- array(0, dim=fx)
perf.mse <- array(0, dim=fx)
perf.mse1 <- array(0, dim=fx)
perf.rmse <- array(0, dim=fx)
for (i in 1:fx) {
locSD <- (ub[i] - forecast$pred[i]) / 1.96
perf.pe[i] = (x[nx+i] - forecast$pred[i]) / forecast$pred[i]
perf.se[i] = (x[nx+i] - forecast$pred[i])^2
prob.dec[i] = pnorm((x[nx+i-1] - forecast$pred[i]) / locSD)
prob.sdec[i] = pnorm((x[nx+i-par5] - forecast$pred[i]) / locSD)
prob.ldec[i] = pnorm((x[nx] - forecast$pred[i]) / locSD)
prob.pval[i] = pnorm(abs(x[nx+i] - forecast$pred[i]) / locSD)
}
perf.mape[1] = abs(perf.pe[1])
perf.mse[1] = abs(perf.se[1])
for (i in 2:fx) {
perf.mape[i] = perf.mape[i-1] + abs(perf.pe[i])
perf.mape1[i] = perf.mape[i] / i
perf.mse[i] = perf.mse[i-1] + perf.se[i]
perf.mse1[i] = perf.mse[i] / i
}
perf.rmse = sqrt(perf.mse1)
bitmap(file='test2.png')
plot(forecast$pred, pch=19, type='b',main='ARIMA Extrapolation Forecast', ylab='Forecast and 95% CI', xlab='time',ylim=c(min(lb),max(ub)))
dum <- forecast$pred
dum[1:par1] <- x[(nx+1):lx]
lines(dum, lty=1)
lines(ub,lty=3)
lines(lb,lty=3)
dev.off()
load(file='createtable')
a<-table.start()
a<-table.row.start(a)
a<-table.element(a,'Univariate ARIMA Extrapolation Forecast',9,TRUE)
a<-table.row.end(a)
a<-table.row.start(a)
a<-table.element(a,'time',1,header=TRUE)
a<-table.element(a,'Y[t]',1,header=TRUE)
a<-table.element(a,'F[t]',1,header=TRUE)
a<-table.element(a,'95% LB',1,header=TRUE)
a<-table.element(a,'95% UB',1,header=TRUE)
a<-table.element(a,'p-value
(H0: Y[t] = F[t])',1,header=TRUE)
a<-table.element(a,'P(F[t]>Y[t-1])',1,header=TRUE)
a<-table.element(a,'P(F[t]>Y[t-s])',1,header=TRUE)
mylab <- paste('P(F[t]>Y[',nx,sep='')
mylab <- paste(mylab,'])',sep='')
a<-table.element(a,mylab,1,header=TRUE)
a<-table.row.end(a)
for (i in (nx-par5):nx) {
a<-table.row.start(a)
a<-table.element(a,i,header=TRUE)
a<-table.element(a,x[i])
a<-table.element(a,'-')
a<-table.row.end(a)
}
for (i in 1:fx) {
a<-table.row.start(a)
a<-table.element(a,nx+i,header=TRUE)
a<-table.element(a,round(x[nx+i],4))
a<-table.element(a,round(forecast$pred[i],4))
a<-table.element(a,round(lb[i],4))
a<-table.element(a,round(ub[i],4))
a<-table.element(a,round((1-prob.pval[i]),4))
a<-table.element(a,round((1-prob.dec[i]),4))
a<-table.element(a,round((1-prob.sdec[i]),4))
a<-table.element(a,round((1-prob.ldec[i]),4))
a<-table.row.end(a)
}
a<-table.end(a)
table.save(a,file='mytable.tab')
a<-table.start()
a<-table.row.start(a)
a<-table.element(a,'Univariate ARIMA Extrapolation Forecast Performance',7,TRUE)
a<-table.row.end(a)
a<-table.row.start(a)
a<-table.element(a,'time',1,header=TRUE)
a<-table.element(a,'% S.E.',1,header=TRUE)
a<-table.element(a,'PE',1,header=TRUE)
a<-table.element(a,'MAPE',1,header=TRUE)
a<-table.element(a,'Sq.E',1,header=TRUE)
a<-table.element(a,'MSE',1,header=TRUE)
a<-table.element(a,'RMSE',1,header=TRUE)
a<-table.row.end(a)
for (i in 1:fx) {
a<-table.row.start(a)
a<-table.element(a,nx+i,header=TRUE)
a<-table.element(a,round(perc.se[i],4))
a<-table.element(a,round(perf.pe[i],4))
a<-table.element(a,round(perf.mape1[i],4))
a<-table.element(a,round(perf.se[i],4))
a<-table.element(a,round(perf.mse1[i],4))
a<-table.element(a,round(perf.rmse[i],4))
a<-table.row.end(a)
}
a<-table.end(a)
table.save(a,file='mytable1.tab')