Free Statistics

of Irreproducible Research!

Author's title

Author*The author of this computation has been verified*
R Software Modulerwasp_arimaforecasting.wasp
Title produced by softwareARIMA Forecasting
Date of computationTue, 06 Dec 2011 08:07:35 -0500
Cite this page as followsStatistical Computations at FreeStatistics.org, Office for Research Development and Education, URL https://freestatistics.org/blog/index.php?v=date/2011/Dec/06/t1323176905o856cbdygafc8wt.htm/, Retrieved Sun, 28 Apr 2024 21:58:33 +0000
Statistical Computations at FreeStatistics.org, Office for Research Development and Education, URL https://freestatistics.org/blog/index.php?pk=151539, Retrieved Sun, 28 Apr 2024 21:58:33 +0000
QR Codes:

Original text written by user:
IsPrivate?No (this computation is public)
User-defined keywords
Estimated Impact81
Family? (F = Feedback message, R = changed R code, M = changed R Module, P = changed Parameters, D = changed Data)
-     [Spectral Analysis] [] [2011-12-02 13:00:58] [8845143a6d3c316a3d9f23c370a4d275]
- RMP   [ARIMA Forecasting] [] [2011-12-02 16:01:07] [8845143a6d3c316a3d9f23c370a4d275]
-           [ARIMA Forecasting] [] [2011-12-06 13:07:35] [cd8b9934e81fda54a97eda68755efa21] [Current]
- R P         [ARIMA Forecasting] [] [2011-12-06 13:42:36] [8845143a6d3c316a3d9f23c370a4d275]
- R P         [ARIMA Forecasting] [] [2011-12-06 13:47:24] [8845143a6d3c316a3d9f23c370a4d275]
Feedback Forum

Post a new message
Dataseries X:
26.663
23.598
26.931
24.740
25.806
24.364
24.477
23.901
23.175
23.227
21.672
21.870
21.439
21.089
23.709
21.669
21.752
20.761
23.479
23.824
23.105
23.110
21.759
22.073
21.937
20.035
23.590
21.672
22.222
22.123
23.950
23.504
22.238
23.142
21.059
21.573
21.548
20.000
22.424
20.615
21.761
22.874
24.104
23.748
23.262
22.907
21.519
22.025
22.604
20.894
24.677
23.673
25.320
23.583
24.671
24.454
24.122
24.252
22.084
22.991
23.287
23.049
25.076
24.037
24.430
24.667
26.451
25.618
25.014
25.110
22.964
23.981
23.798
22.270
24.775
22.646
23.988
24.737
26.276
25.816
25.210
25.199
23.162
24.707
24.364
22.644
25.565
24.062
25.431
24.635
27.009
26.606
26.268
26.462
25.246
25.180
24.657
23.304
26.982
26.199
27.210
26.122
26.706
26.878
26.152
26.379
24.712
25.688
24.990
24.239
26.721
23.475
24.767
26.219
28.361
28.599
27.914
27.784
25.693
26.881
26.217
24.218
27.914
26.975
28.527
27.139
28.982
28.169
28.056
29.136
26.291
26.987
26.589
24.848
27.543
26.896
28.878
27.390
28.065
28.141
29.048
28.484
26.634
27.735
27.132
24.924
28.963
26.589
27.931
28.009
29.229
28.759
28.405
27.945
25.912
26.619
26.076
25.286
27.660
25.951
26.398
25.565
28.865
30.000
29.261
29.012
26.992
27.897


Summary of computational transaction
Raw Inputview raw input (R code)
Raw Outputview raw output of R engine
Computing time2 seconds
R Server'Gertrude Mary Cox' @ cox.wessa.net

\begin{tabular}{lllllllll}
\hline
Summary of computational transaction \tabularnewline
Raw Input & view raw input (R code)  \tabularnewline
Raw Output & view raw output of R engine  \tabularnewline
Computing time & 2 seconds \tabularnewline
R Server & 'Gertrude Mary Cox' @ cox.wessa.net \tabularnewline
\hline
\end{tabular}
%Source: https://freestatistics.org/blog/index.php?pk=151539&T=0

[TABLE]
[ROW][C]Summary of computational transaction[/C][/ROW]
[ROW][C]Raw Input[/C][C]view raw input (R code) [/C][/ROW]
[ROW][C]Raw Output[/C][C]view raw output of R engine [/C][/ROW]
[ROW][C]Computing time[/C][C]2 seconds[/C][/ROW]
[ROW][C]R Server[/C][C]'Gertrude Mary Cox' @ cox.wessa.net[/C][/ROW]
[/TABLE]
Source: https://freestatistics.org/blog/index.php?pk=151539&T=0

Globally Unique Identifier (entire table): ba.freestatistics.org/blog/index.php?pk=151539&T=0

As an alternative you can also use a QR Code:  

The GUIDs for individual cells are displayed in the table below:

Summary of computational transaction
Raw Inputview raw input (R code)
Raw Outputview raw output of R engine
Computing time2 seconds
R Server'Gertrude Mary Cox' @ cox.wessa.net


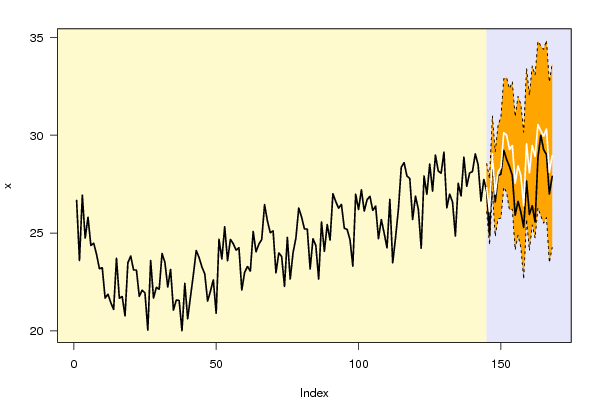
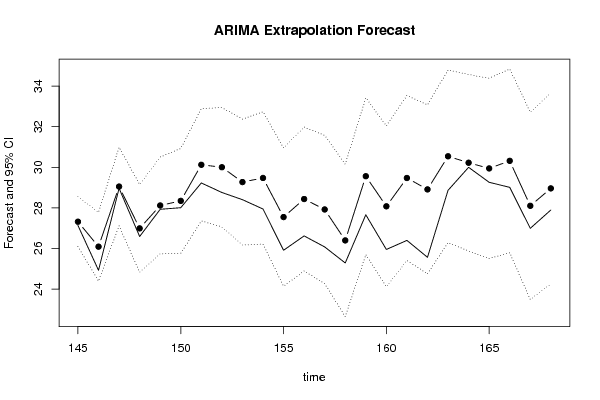
Univariate ARIMA Extrapolation Forecast
timeY[t]F[t]95% LB95% UBp-value(H0: Y[t] = F[t])P(F[t]>Y[t-1])P(F[t]>Y[t-s])P(F[t]>Y[144])
13226.987-------
13326.589-------
13424.848-------
13527.543-------
13626.896-------
13728.878-------
13827.39-------
13928.065-------
14028.141-------
14129.048-------
14228.484-------
14326.634-------
14427.735-------
14527.13227.319126.091528.54660.38260.25330.87810.2533
14624.92426.089424.395227.78370.08880.11390.92450.0285
14728.96329.05127.113530.98860.464510.93640.9085
14826.58926.990324.826929.15380.35810.0370.5340.2499
14927.93128.118325.733230.50340.43880.89560.26620.6236
15028.00928.34625.760630.93140.39920.62350.76570.6784
15129.22930.125227.356632.89380.26290.9330.92770.9547
15228.75930.004127.063232.9450.20330.69730.89280.9348
15328.40529.272126.16832.37620.2920.6270.55630.8341
15427.94529.474426.215432.73340.17880.73990.72430.8522
15525.91227.547524.140730.95440.17340.40960.70040.4571
15626.61928.436624.888131.98520.15770.91840.65080.6508
15726.07627.92224.268531.57550.1610.75770.66420.54
15825.28626.396922.6430.15390.28110.56650.77890.2426
15927.6629.560525.697633.42340.16740.9850.61910.8228
16025.95128.076224.110832.04170.14680.58150.76890.567
16126.39829.473325.408733.53780.0690.95530.77150.799
16225.56528.911324.749933.07270.05750.88170.66460.7102
16328.86530.54326.286834.79910.21980.98910.72740.902
1643030.225125.876234.5740.45960.73010.74560.8691
16529.26129.945825.506234.38550.38120.49050.75180.8355
16629.01230.318825.790234.84730.28580.67650.84790.8683
16726.99228.102923.487132.71870.31860.34970.82390.5621
16827.89728.961124.259733.66250.32870.79410.83560.6954

\begin{tabular}{lllllllll}
\hline
Univariate ARIMA Extrapolation Forecast \tabularnewline
time & Y[t] & F[t] & 95% LB & 95% UB & p-value(H0: Y[t] = F[t]) & P(F[t]>Y[t-1]) & P(F[t]>Y[t-s]) & P(F[t]>Y[144]) \tabularnewline
132 & 26.987 & - & - & - & - & - & - & - \tabularnewline
133 & 26.589 & - & - & - & - & - & - & - \tabularnewline
134 & 24.848 & - & - & - & - & - & - & - \tabularnewline
135 & 27.543 & - & - & - & - & - & - & - \tabularnewline
136 & 26.896 & - & - & - & - & - & - & - \tabularnewline
137 & 28.878 & - & - & - & - & - & - & - \tabularnewline
138 & 27.39 & - & - & - & - & - & - & - \tabularnewline
139 & 28.065 & - & - & - & - & - & - & - \tabularnewline
140 & 28.141 & - & - & - & - & - & - & - \tabularnewline
141 & 29.048 & - & - & - & - & - & - & - \tabularnewline
142 & 28.484 & - & - & - & - & - & - & - \tabularnewline
143 & 26.634 & - & - & - & - & - & - & - \tabularnewline
144 & 27.735 & - & - & - & - & - & - & - \tabularnewline
145 & 27.132 & 27.3191 & 26.0915 & 28.5466 & 0.3826 & 0.2533 & 0.8781 & 0.2533 \tabularnewline
146 & 24.924 & 26.0894 & 24.3952 & 27.7837 & 0.0888 & 0.1139 & 0.9245 & 0.0285 \tabularnewline
147 & 28.963 & 29.051 & 27.1135 & 30.9886 & 0.4645 & 1 & 0.9364 & 0.9085 \tabularnewline
148 & 26.589 & 26.9903 & 24.8269 & 29.1538 & 0.3581 & 0.037 & 0.534 & 0.2499 \tabularnewline
149 & 27.931 & 28.1183 & 25.7332 & 30.5034 & 0.4388 & 0.8956 & 0.2662 & 0.6236 \tabularnewline
150 & 28.009 & 28.346 & 25.7606 & 30.9314 & 0.3992 & 0.6235 & 0.7657 & 0.6784 \tabularnewline
151 & 29.229 & 30.1252 & 27.3566 & 32.8938 & 0.2629 & 0.933 & 0.9277 & 0.9547 \tabularnewline
152 & 28.759 & 30.0041 & 27.0632 & 32.945 & 0.2033 & 0.6973 & 0.8928 & 0.9348 \tabularnewline
153 & 28.405 & 29.2721 & 26.168 & 32.3762 & 0.292 & 0.627 & 0.5563 & 0.8341 \tabularnewline
154 & 27.945 & 29.4744 & 26.2154 & 32.7334 & 0.1788 & 0.7399 & 0.7243 & 0.8522 \tabularnewline
155 & 25.912 & 27.5475 & 24.1407 & 30.9544 & 0.1734 & 0.4096 & 0.7004 & 0.4571 \tabularnewline
156 & 26.619 & 28.4366 & 24.8881 & 31.9852 & 0.1577 & 0.9184 & 0.6508 & 0.6508 \tabularnewline
157 & 26.076 & 27.922 & 24.2685 & 31.5755 & 0.161 & 0.7577 & 0.6642 & 0.54 \tabularnewline
158 & 25.286 & 26.3969 & 22.64 & 30.1539 & 0.2811 & 0.5665 & 0.7789 & 0.2426 \tabularnewline
159 & 27.66 & 29.5605 & 25.6976 & 33.4234 & 0.1674 & 0.985 & 0.6191 & 0.8228 \tabularnewline
160 & 25.951 & 28.0762 & 24.1108 & 32.0417 & 0.1468 & 0.5815 & 0.7689 & 0.567 \tabularnewline
161 & 26.398 & 29.4733 & 25.4087 & 33.5378 & 0.069 & 0.9553 & 0.7715 & 0.799 \tabularnewline
162 & 25.565 & 28.9113 & 24.7499 & 33.0727 & 0.0575 & 0.8817 & 0.6646 & 0.7102 \tabularnewline
163 & 28.865 & 30.543 & 26.2868 & 34.7991 & 0.2198 & 0.9891 & 0.7274 & 0.902 \tabularnewline
164 & 30 & 30.2251 & 25.8762 & 34.574 & 0.4596 & 0.7301 & 0.7456 & 0.8691 \tabularnewline
165 & 29.261 & 29.9458 & 25.5062 & 34.3855 & 0.3812 & 0.4905 & 0.7518 & 0.8355 \tabularnewline
166 & 29.012 & 30.3188 & 25.7902 & 34.8473 & 0.2858 & 0.6765 & 0.8479 & 0.8683 \tabularnewline
167 & 26.992 & 28.1029 & 23.4871 & 32.7187 & 0.3186 & 0.3497 & 0.8239 & 0.5621 \tabularnewline
168 & 27.897 & 28.9611 & 24.2597 & 33.6625 & 0.3287 & 0.7941 & 0.8356 & 0.6954 \tabularnewline
\hline
\end{tabular}
%Source: https://freestatistics.org/blog/index.php?pk=151539&T=1

[TABLE]
[ROW][C]Univariate ARIMA Extrapolation Forecast[/C][/ROW]
[ROW][C]time[/C][C]Y[t][/C][C]F[t][/C][C]95% LB[/C][C]95% UB[/C][C]p-value(H0: Y[t] = F[t])[/C][C]P(F[t]>Y[t-1])[/C][C]P(F[t]>Y[t-s])[/C][C]P(F[t]>Y[144])[/C][/ROW]
[ROW][C]132[/C][C]26.987[/C][C]-[/C][C]-[/C][C]-[/C][C]-[/C][C]-[/C][C]-[/C][C]-[/C][/ROW]
[ROW][C]133[/C][C]26.589[/C][C]-[/C][C]-[/C][C]-[/C][C]-[/C][C]-[/C][C]-[/C][C]-[/C][/ROW]
[ROW][C]134[/C][C]24.848[/C][C]-[/C][C]-[/C][C]-[/C][C]-[/C][C]-[/C][C]-[/C][C]-[/C][/ROW]
[ROW][C]135[/C][C]27.543[/C][C]-[/C][C]-[/C][C]-[/C][C]-[/C][C]-[/C][C]-[/C][C]-[/C][/ROW]
[ROW][C]136[/C][C]26.896[/C][C]-[/C][C]-[/C][C]-[/C][C]-[/C][C]-[/C][C]-[/C][C]-[/C][/ROW]
[ROW][C]137[/C][C]28.878[/C][C]-[/C][C]-[/C][C]-[/C][C]-[/C][C]-[/C][C]-[/C][C]-[/C][/ROW]
[ROW][C]138[/C][C]27.39[/C][C]-[/C][C]-[/C][C]-[/C][C]-[/C][C]-[/C][C]-[/C][C]-[/C][/ROW]
[ROW][C]139[/C][C]28.065[/C][C]-[/C][C]-[/C][C]-[/C][C]-[/C][C]-[/C][C]-[/C][C]-[/C][/ROW]
[ROW][C]140[/C][C]28.141[/C][C]-[/C][C]-[/C][C]-[/C][C]-[/C][C]-[/C][C]-[/C][C]-[/C][/ROW]
[ROW][C]141[/C][C]29.048[/C][C]-[/C][C]-[/C][C]-[/C][C]-[/C][C]-[/C][C]-[/C][C]-[/C][/ROW]
[ROW][C]142[/C][C]28.484[/C][C]-[/C][C]-[/C][C]-[/C][C]-[/C][C]-[/C][C]-[/C][C]-[/C][/ROW]
[ROW][C]143[/C][C]26.634[/C][C]-[/C][C]-[/C][C]-[/C][C]-[/C][C]-[/C][C]-[/C][C]-[/C][/ROW]
[ROW][C]144[/C][C]27.735[/C][C]-[/C][C]-[/C][C]-[/C][C]-[/C][C]-[/C][C]-[/C][C]-[/C][/ROW]
[ROW][C]145[/C][C]27.132[/C][C]27.3191[/C][C]26.0915[/C][C]28.5466[/C][C]0.3826[/C][C]0.2533[/C][C]0.8781[/C][C]0.2533[/C][/ROW]
[ROW][C]146[/C][C]24.924[/C][C]26.0894[/C][C]24.3952[/C][C]27.7837[/C][C]0.0888[/C][C]0.1139[/C][C]0.9245[/C][C]0.0285[/C][/ROW]
[ROW][C]147[/C][C]28.963[/C][C]29.051[/C][C]27.1135[/C][C]30.9886[/C][C]0.4645[/C][C]1[/C][C]0.9364[/C][C]0.9085[/C][/ROW]
[ROW][C]148[/C][C]26.589[/C][C]26.9903[/C][C]24.8269[/C][C]29.1538[/C][C]0.3581[/C][C]0.037[/C][C]0.534[/C][C]0.2499[/C][/ROW]
[ROW][C]149[/C][C]27.931[/C][C]28.1183[/C][C]25.7332[/C][C]30.5034[/C][C]0.4388[/C][C]0.8956[/C][C]0.2662[/C][C]0.6236[/C][/ROW]
[ROW][C]150[/C][C]28.009[/C][C]28.346[/C][C]25.7606[/C][C]30.9314[/C][C]0.3992[/C][C]0.6235[/C][C]0.7657[/C][C]0.6784[/C][/ROW]
[ROW][C]151[/C][C]29.229[/C][C]30.1252[/C][C]27.3566[/C][C]32.8938[/C][C]0.2629[/C][C]0.933[/C][C]0.9277[/C][C]0.9547[/C][/ROW]
[ROW][C]152[/C][C]28.759[/C][C]30.0041[/C][C]27.0632[/C][C]32.945[/C][C]0.2033[/C][C]0.6973[/C][C]0.8928[/C][C]0.9348[/C][/ROW]
[ROW][C]153[/C][C]28.405[/C][C]29.2721[/C][C]26.168[/C][C]32.3762[/C][C]0.292[/C][C]0.627[/C][C]0.5563[/C][C]0.8341[/C][/ROW]
[ROW][C]154[/C][C]27.945[/C][C]29.4744[/C][C]26.2154[/C][C]32.7334[/C][C]0.1788[/C][C]0.7399[/C][C]0.7243[/C][C]0.8522[/C][/ROW]
[ROW][C]155[/C][C]25.912[/C][C]27.5475[/C][C]24.1407[/C][C]30.9544[/C][C]0.1734[/C][C]0.4096[/C][C]0.7004[/C][C]0.4571[/C][/ROW]
[ROW][C]156[/C][C]26.619[/C][C]28.4366[/C][C]24.8881[/C][C]31.9852[/C][C]0.1577[/C][C]0.9184[/C][C]0.6508[/C][C]0.6508[/C][/ROW]
[ROW][C]157[/C][C]26.076[/C][C]27.922[/C][C]24.2685[/C][C]31.5755[/C][C]0.161[/C][C]0.7577[/C][C]0.6642[/C][C]0.54[/C][/ROW]
[ROW][C]158[/C][C]25.286[/C][C]26.3969[/C][C]22.64[/C][C]30.1539[/C][C]0.2811[/C][C]0.5665[/C][C]0.7789[/C][C]0.2426[/C][/ROW]
[ROW][C]159[/C][C]27.66[/C][C]29.5605[/C][C]25.6976[/C][C]33.4234[/C][C]0.1674[/C][C]0.985[/C][C]0.6191[/C][C]0.8228[/C][/ROW]
[ROW][C]160[/C][C]25.951[/C][C]28.0762[/C][C]24.1108[/C][C]32.0417[/C][C]0.1468[/C][C]0.5815[/C][C]0.7689[/C][C]0.567[/C][/ROW]
[ROW][C]161[/C][C]26.398[/C][C]29.4733[/C][C]25.4087[/C][C]33.5378[/C][C]0.069[/C][C]0.9553[/C][C]0.7715[/C][C]0.799[/C][/ROW]
[ROW][C]162[/C][C]25.565[/C][C]28.9113[/C][C]24.7499[/C][C]33.0727[/C][C]0.0575[/C][C]0.8817[/C][C]0.6646[/C][C]0.7102[/C][/ROW]
[ROW][C]163[/C][C]28.865[/C][C]30.543[/C][C]26.2868[/C][C]34.7991[/C][C]0.2198[/C][C]0.9891[/C][C]0.7274[/C][C]0.902[/C][/ROW]
[ROW][C]164[/C][C]30[/C][C]30.2251[/C][C]25.8762[/C][C]34.574[/C][C]0.4596[/C][C]0.7301[/C][C]0.7456[/C][C]0.8691[/C][/ROW]
[ROW][C]165[/C][C]29.261[/C][C]29.9458[/C][C]25.5062[/C][C]34.3855[/C][C]0.3812[/C][C]0.4905[/C][C]0.7518[/C][C]0.8355[/C][/ROW]
[ROW][C]166[/C][C]29.012[/C][C]30.3188[/C][C]25.7902[/C][C]34.8473[/C][C]0.2858[/C][C]0.6765[/C][C]0.8479[/C][C]0.8683[/C][/ROW]
[ROW][C]167[/C][C]26.992[/C][C]28.1029[/C][C]23.4871[/C][C]32.7187[/C][C]0.3186[/C][C]0.3497[/C][C]0.8239[/C][C]0.5621[/C][/ROW]
[ROW][C]168[/C][C]27.897[/C][C]28.9611[/C][C]24.2597[/C][C]33.6625[/C][C]0.3287[/C][C]0.7941[/C][C]0.8356[/C][C]0.6954[/C][/ROW]
[/TABLE]
Source: https://freestatistics.org/blog/index.php?pk=151539&T=1

Globally Unique Identifier (entire table): ba.freestatistics.org/blog/index.php?pk=151539&T=1

As an alternative you can also use a QR Code:  

The GUIDs for individual cells are displayed in the table below:

Univariate ARIMA Extrapolation Forecast
timeY[t]F[t]95% LB95% UBp-value(H0: Y[t] = F[t])P(F[t]>Y[t-1])P(F[t]>Y[t-s])P(F[t]>Y[144])
13226.987-------
13326.589-------
13424.848-------
13527.543-------
13626.896-------
13728.878-------
13827.39-------
13928.065-------
14028.141-------
14129.048-------
14228.484-------
14326.634-------
14427.735-------
14527.13227.319126.091528.54660.38260.25330.87810.2533
14624.92426.089424.395227.78370.08880.11390.92450.0285
14728.96329.05127.113530.98860.464510.93640.9085
14826.58926.990324.826929.15380.35810.0370.5340.2499
14927.93128.118325.733230.50340.43880.89560.26620.6236
15028.00928.34625.760630.93140.39920.62350.76570.6784
15129.22930.125227.356632.89380.26290.9330.92770.9547
15228.75930.004127.063232.9450.20330.69730.89280.9348
15328.40529.272126.16832.37620.2920.6270.55630.8341
15427.94529.474426.215432.73340.17880.73990.72430.8522
15525.91227.547524.140730.95440.17340.40960.70040.4571
15626.61928.436624.888131.98520.15770.91840.65080.6508
15726.07627.92224.268531.57550.1610.75770.66420.54
15825.28626.396922.6430.15390.28110.56650.77890.2426
15927.6629.560525.697633.42340.16740.9850.61910.8228
16025.95128.076224.110832.04170.14680.58150.76890.567
16126.39829.473325.408733.53780.0690.95530.77150.799
16225.56528.911324.749933.07270.05750.88170.66460.7102
16328.86530.54326.286834.79910.21980.98910.72740.902
1643030.225125.876234.5740.45960.73010.74560.8691
16529.26129.945825.506234.38550.38120.49050.75180.8355
16629.01230.318825.790234.84730.28580.67650.84790.8683
16726.99228.102923.487132.71870.31860.34970.82390.5621
16827.89728.961124.259733.66250.32870.79410.83560.6954


Univariate ARIMA Extrapolation Forecast Performance
time% S.E.PEMAPESq.EMSERMSE
1450.0229-0.006800.03500
1460.0331-0.04470.02581.35820.69660.8346
1470.034-0.0030.01820.00770.4670.6834
1480.0409-0.01490.01740.16110.39050.6249
1490.0433-0.00670.01520.03510.31940.5652
1500.0465-0.01190.01470.11350.28510.534
1510.0469-0.02980.01680.80320.35910.5993
1520.05-0.04150.01991.55030.5080.7128
1530.0541-0.02960.0210.75180.53510.7315
1540.0564-0.05190.02412.33910.71550.8459
1550.0631-0.05940.02732.6750.89360.9453
1560.0637-0.06390.03033.30381.09451.0462
1570.0668-0.06610.03313.40781.27241.128
1580.0726-0.04210.03371.23411.26971.1268
1590.0667-0.06430.03583.61191.42581.1941
1600.0721-0.07570.03834.51661.6191.2724
1610.0704-0.10430.04219.45732.08011.4423
1620.0734-0.11570.046211.19782.58661.6083
1630.0711-0.05490.04672.81562.59871.612
1640.0734-0.00740.04470.05072.47131.572
1650.0756-0.02290.04370.4692.37591.5414
1660.0762-0.04310.04371.70762.34561.5315
1670.0838-0.03950.04351.23412.29721.5157
1680.0828-0.03670.04321.13222.24871.4996

\begin{tabular}{lllllllll}
\hline
Univariate ARIMA Extrapolation Forecast Performance \tabularnewline
time & % S.E. & PE & MAPE & Sq.E & MSE & RMSE \tabularnewline
145 & 0.0229 & -0.0068 & 0 & 0.035 & 0 & 0 \tabularnewline
146 & 0.0331 & -0.0447 & 0.0258 & 1.3582 & 0.6966 & 0.8346 \tabularnewline
147 & 0.034 & -0.003 & 0.0182 & 0.0077 & 0.467 & 0.6834 \tabularnewline
148 & 0.0409 & -0.0149 & 0.0174 & 0.1611 & 0.3905 & 0.6249 \tabularnewline
149 & 0.0433 & -0.0067 & 0.0152 & 0.0351 & 0.3194 & 0.5652 \tabularnewline
150 & 0.0465 & -0.0119 & 0.0147 & 0.1135 & 0.2851 & 0.534 \tabularnewline
151 & 0.0469 & -0.0298 & 0.0168 & 0.8032 & 0.3591 & 0.5993 \tabularnewline
152 & 0.05 & -0.0415 & 0.0199 & 1.5503 & 0.508 & 0.7128 \tabularnewline
153 & 0.0541 & -0.0296 & 0.021 & 0.7518 & 0.5351 & 0.7315 \tabularnewline
154 & 0.0564 & -0.0519 & 0.0241 & 2.3391 & 0.7155 & 0.8459 \tabularnewline
155 & 0.0631 & -0.0594 & 0.0273 & 2.675 & 0.8936 & 0.9453 \tabularnewline
156 & 0.0637 & -0.0639 & 0.0303 & 3.3038 & 1.0945 & 1.0462 \tabularnewline
157 & 0.0668 & -0.0661 & 0.0331 & 3.4078 & 1.2724 & 1.128 \tabularnewline
158 & 0.0726 & -0.0421 & 0.0337 & 1.2341 & 1.2697 & 1.1268 \tabularnewline
159 & 0.0667 & -0.0643 & 0.0358 & 3.6119 & 1.4258 & 1.1941 \tabularnewline
160 & 0.0721 & -0.0757 & 0.0383 & 4.5166 & 1.619 & 1.2724 \tabularnewline
161 & 0.0704 & -0.1043 & 0.0421 & 9.4573 & 2.0801 & 1.4423 \tabularnewline
162 & 0.0734 & -0.1157 & 0.0462 & 11.1978 & 2.5866 & 1.6083 \tabularnewline
163 & 0.0711 & -0.0549 & 0.0467 & 2.8156 & 2.5987 & 1.612 \tabularnewline
164 & 0.0734 & -0.0074 & 0.0447 & 0.0507 & 2.4713 & 1.572 \tabularnewline
165 & 0.0756 & -0.0229 & 0.0437 & 0.469 & 2.3759 & 1.5414 \tabularnewline
166 & 0.0762 & -0.0431 & 0.0437 & 1.7076 & 2.3456 & 1.5315 \tabularnewline
167 & 0.0838 & -0.0395 & 0.0435 & 1.2341 & 2.2972 & 1.5157 \tabularnewline
168 & 0.0828 & -0.0367 & 0.0432 & 1.1322 & 2.2487 & 1.4996 \tabularnewline
\hline
\end{tabular}
%Source: https://freestatistics.org/blog/index.php?pk=151539&T=2

[TABLE]
[ROW][C]Univariate ARIMA Extrapolation Forecast Performance[/C][/ROW]
[ROW][C]time[/C][C]% S.E.[/C][C]PE[/C][C]MAPE[/C][C]Sq.E[/C][C]MSE[/C][C]RMSE[/C][/ROW]
[ROW][C]145[/C][C]0.0229[/C][C]-0.0068[/C][C]0[/C][C]0.035[/C][C]0[/C][C]0[/C][/ROW]
[ROW][C]146[/C][C]0.0331[/C][C]-0.0447[/C][C]0.0258[/C][C]1.3582[/C][C]0.6966[/C][C]0.8346[/C][/ROW]
[ROW][C]147[/C][C]0.034[/C][C]-0.003[/C][C]0.0182[/C][C]0.0077[/C][C]0.467[/C][C]0.6834[/C][/ROW]
[ROW][C]148[/C][C]0.0409[/C][C]-0.0149[/C][C]0.0174[/C][C]0.1611[/C][C]0.3905[/C][C]0.6249[/C][/ROW]
[ROW][C]149[/C][C]0.0433[/C][C]-0.0067[/C][C]0.0152[/C][C]0.0351[/C][C]0.3194[/C][C]0.5652[/C][/ROW]
[ROW][C]150[/C][C]0.0465[/C][C]-0.0119[/C][C]0.0147[/C][C]0.1135[/C][C]0.2851[/C][C]0.534[/C][/ROW]
[ROW][C]151[/C][C]0.0469[/C][C]-0.0298[/C][C]0.0168[/C][C]0.8032[/C][C]0.3591[/C][C]0.5993[/C][/ROW]
[ROW][C]152[/C][C]0.05[/C][C]-0.0415[/C][C]0.0199[/C][C]1.5503[/C][C]0.508[/C][C]0.7128[/C][/ROW]
[ROW][C]153[/C][C]0.0541[/C][C]-0.0296[/C][C]0.021[/C][C]0.7518[/C][C]0.5351[/C][C]0.7315[/C][/ROW]
[ROW][C]154[/C][C]0.0564[/C][C]-0.0519[/C][C]0.0241[/C][C]2.3391[/C][C]0.7155[/C][C]0.8459[/C][/ROW]
[ROW][C]155[/C][C]0.0631[/C][C]-0.0594[/C][C]0.0273[/C][C]2.675[/C][C]0.8936[/C][C]0.9453[/C][/ROW]
[ROW][C]156[/C][C]0.0637[/C][C]-0.0639[/C][C]0.0303[/C][C]3.3038[/C][C]1.0945[/C][C]1.0462[/C][/ROW]
[ROW][C]157[/C][C]0.0668[/C][C]-0.0661[/C][C]0.0331[/C][C]3.4078[/C][C]1.2724[/C][C]1.128[/C][/ROW]
[ROW][C]158[/C][C]0.0726[/C][C]-0.0421[/C][C]0.0337[/C][C]1.2341[/C][C]1.2697[/C][C]1.1268[/C][/ROW]
[ROW][C]159[/C][C]0.0667[/C][C]-0.0643[/C][C]0.0358[/C][C]3.6119[/C][C]1.4258[/C][C]1.1941[/C][/ROW]
[ROW][C]160[/C][C]0.0721[/C][C]-0.0757[/C][C]0.0383[/C][C]4.5166[/C][C]1.619[/C][C]1.2724[/C][/ROW]
[ROW][C]161[/C][C]0.0704[/C][C]-0.1043[/C][C]0.0421[/C][C]9.4573[/C][C]2.0801[/C][C]1.4423[/C][/ROW]
[ROW][C]162[/C][C]0.0734[/C][C]-0.1157[/C][C]0.0462[/C][C]11.1978[/C][C]2.5866[/C][C]1.6083[/C][/ROW]
[ROW][C]163[/C][C]0.0711[/C][C]-0.0549[/C][C]0.0467[/C][C]2.8156[/C][C]2.5987[/C][C]1.612[/C][/ROW]
[ROW][C]164[/C][C]0.0734[/C][C]-0.0074[/C][C]0.0447[/C][C]0.0507[/C][C]2.4713[/C][C]1.572[/C][/ROW]
[ROW][C]165[/C][C]0.0756[/C][C]-0.0229[/C][C]0.0437[/C][C]0.469[/C][C]2.3759[/C][C]1.5414[/C][/ROW]
[ROW][C]166[/C][C]0.0762[/C][C]-0.0431[/C][C]0.0437[/C][C]1.7076[/C][C]2.3456[/C][C]1.5315[/C][/ROW]
[ROW][C]167[/C][C]0.0838[/C][C]-0.0395[/C][C]0.0435[/C][C]1.2341[/C][C]2.2972[/C][C]1.5157[/C][/ROW]
[ROW][C]168[/C][C]0.0828[/C][C]-0.0367[/C][C]0.0432[/C][C]1.1322[/C][C]2.2487[/C][C]1.4996[/C][/ROW]
[/TABLE]
Source: https://freestatistics.org/blog/index.php?pk=151539&T=2

Globally Unique Identifier (entire table): ba.freestatistics.org/blog/index.php?pk=151539&T=2

As an alternative you can also use a QR Code:  

The GUIDs for individual cells are displayed in the table below:

Univariate ARIMA Extrapolation Forecast Performance
time% S.E.PEMAPESq.EMSERMSE
1450.0229-0.006800.03500
1460.0331-0.04470.02581.35820.69660.8346
1470.034-0.0030.01820.00770.4670.6834
1480.0409-0.01490.01740.16110.39050.6249
1490.0433-0.00670.01520.03510.31940.5652
1500.0465-0.01190.01470.11350.28510.534
1510.0469-0.02980.01680.80320.35910.5993
1520.05-0.04150.01991.55030.5080.7128
1530.0541-0.02960.0210.75180.53510.7315
1540.0564-0.05190.02412.33910.71550.8459
1550.0631-0.05940.02732.6750.89360.9453
1560.0637-0.06390.03033.30381.09451.0462
1570.0668-0.06610.03313.40781.27241.128
1580.0726-0.04210.03371.23411.26971.1268
1590.0667-0.06430.03583.61191.42581.1941
1600.0721-0.07570.03834.51661.6191.2724
1610.0704-0.10430.04219.45732.08011.4423
1620.0734-0.11570.046211.19782.58661.6083
1630.0711-0.05490.04672.81562.59871.612
1640.0734-0.00740.04470.05072.47131.572
1650.0756-0.02290.04370.4692.37591.5414
1660.0762-0.04310.04371.70762.34561.5315
1670.0838-0.03950.04351.23412.29721.5157
1680.0828-0.03670.04321.13222.24871.4996


Parameters (Session):
par1 = 24 ; par2 = 1 ; par3 = 1 ; par4 = 1 ; par5 = 12 ; par6 = 2 ; par7 = 0 ; par8 = 2 ; par9 = 1 ; par10 = FALSE ;
Parameters (R input):
par1 = 24 ; par2 = 1 ; par3 = 1 ; par4 = 1 ; par5 = 12 ; par6 = 2 ; par7 = 0 ; par8 = 2 ; par9 = 1 ; par10 = FALSE ;
R code (references can be found in the software module):
par1 <- as.numeric(par1) #cut off periods
par2 <- as.numeric(par2) #lambda
par3 <- as.numeric(par3) #degree of non-seasonal differencing
par4 <- as.numeric(par4) #degree of seasonal differencing
par5 <- as.numeric(par5) #seasonal period
par6 <- as.numeric(par6) #p
par7 <- as.numeric(par7) #q
par8 <- as.numeric(par8) #P
par9 <- as.numeric(par9) #Q
if (par10 == 'TRUE') par10 <- TRUE
if (par10 == 'FALSE') par10 <- FALSE
if (par2 == 0) x <- log(x)
if (par2 != 0) x <- x^par2
lx <- length(x)
first <- lx - 2*par1
nx <- lx - par1
nx1 <- nx + 1
fx <- lx - nx
if (fx < 1) {
fx <- par5
nx1 <- lx + fx - 1
first <- lx - 2*fx
}
first <- 1
if (fx < 3) fx <- round(lx/10,0)
(arima.out <- arima(x[1:nx], order=c(par6,par3,par7), seasonal=list(order=c(par8,par4,par9), period=par5), include.mean=par10, method='ML'))
(forecast <- predict(arima.out,par1))
(lb <- forecast$pred - 1.96 * forecast$se)
(ub <- forecast$pred + 1.96 * forecast$se)
if (par2 == 0) {
x <- exp(x)
forecast$pred <- exp(forecast$pred)
lb <- exp(lb)
ub <- exp(ub)
}
if (par2 != 0) {
x <- x^(1/par2)
forecast$pred <- forecast$pred^(1/par2)
lb <- lb^(1/par2)
ub <- ub^(1/par2)
}
if (par2 < 0) {
olb <- lb
lb <- ub
ub <- olb
}
(actandfor <- c(x[1:nx], forecast$pred))
(perc.se <- (ub-forecast$pred)/1.96/forecast$pred)
bitmap(file='test1.png')
opar <- par(mar=c(4,4,2,2),las=1)
ylim <- c( min(x[first:nx],lb), max(x[first:nx],ub))
plot(x,ylim=ylim,type='n',xlim=c(first,lx))
usr <- par('usr')
rect(usr[1],usr[3],nx+1,usr[4],border=NA,col='lemonchiffon')
rect(nx1,usr[3],usr[2],usr[4],border=NA,col='lavender')
abline(h= (-3:3)*2 , col ='gray', lty =3)
polygon( c(nx1:lx,lx:nx1), c(lb,rev(ub)), col = 'orange', lty=2,border=NA)
lines(nx1:lx, lb , lty=2)
lines(nx1:lx, ub , lty=2)
lines(x, lwd=2)
lines(nx1:lx, forecast$pred , lwd=2 , col ='white')
box()
par(opar)
dev.off()
prob.dec <- array(NA, dim=fx)
prob.sdec <- array(NA, dim=fx)
prob.ldec <- array(NA, dim=fx)
prob.pval <- array(NA, dim=fx)
perf.pe <- array(0, dim=fx)
perf.mape <- array(0, dim=fx)
perf.mape1 <- array(0, dim=fx)
perf.se <- array(0, dim=fx)
perf.mse <- array(0, dim=fx)
perf.mse1 <- array(0, dim=fx)
perf.rmse <- array(0, dim=fx)
for (i in 1:fx) {
locSD <- (ub[i] - forecast$pred[i]) / 1.96
perf.pe[i] = (x[nx+i] - forecast$pred[i]) / forecast$pred[i]
perf.se[i] = (x[nx+i] - forecast$pred[i])^2
prob.dec[i] = pnorm((x[nx+i-1] - forecast$pred[i]) / locSD)
prob.sdec[i] = pnorm((x[nx+i-par5] - forecast$pred[i]) / locSD)
prob.ldec[i] = pnorm((x[nx] - forecast$pred[i]) / locSD)
prob.pval[i] = pnorm(abs(x[nx+i] - forecast$pred[i]) / locSD)
}
perf.mape[1] = abs(perf.pe[1])
perf.mse[1] = abs(perf.se[1])
for (i in 2:fx) {
perf.mape[i] = perf.mape[i-1] + abs(perf.pe[i])
perf.mape1[i] = perf.mape[i] / i
perf.mse[i] = perf.mse[i-1] + perf.se[i]
perf.mse1[i] = perf.mse[i] / i
}
perf.rmse = sqrt(perf.mse1)
bitmap(file='test2.png')
plot(forecast$pred, pch=19, type='b',main='ARIMA Extrapolation Forecast', ylab='Forecast and 95% CI', xlab='time',ylim=c(min(lb),max(ub)))
dum <- forecast$pred
dum[1:par1] <- x[(nx+1):lx]
lines(dum, lty=1)
lines(ub,lty=3)
lines(lb,lty=3)
dev.off()
load(file='createtable')
a<-table.start()
a<-table.row.start(a)
a<-table.element(a,'Univariate ARIMA Extrapolation Forecast',9,TRUE)
a<-table.row.end(a)
a<-table.row.start(a)
a<-table.element(a,'time',1,header=TRUE)
a<-table.element(a,'Y[t]',1,header=TRUE)
a<-table.element(a,'F[t]',1,header=TRUE)
a<-table.element(a,'95% LB',1,header=TRUE)
a<-table.element(a,'95% UB',1,header=TRUE)
a<-table.element(a,'p-value
(H0: Y[t] = F[t])',1,header=TRUE)
a<-table.element(a,'P(F[t]>Y[t-1])',1,header=TRUE)
a<-table.element(a,'P(F[t]>Y[t-s])',1,header=TRUE)
mylab <- paste('P(F[t]>Y[',nx,sep='')
mylab <- paste(mylab,'])',sep='')
a<-table.element(a,mylab,1,header=TRUE)
a<-table.row.end(a)
for (i in (nx-par5):nx) {
a<-table.row.start(a)
a<-table.element(a,i,header=TRUE)
a<-table.element(a,x[i])
a<-table.element(a,'-')
a<-table.row.end(a)
}
for (i in 1:fx) {
a<-table.row.start(a)
a<-table.element(a,nx+i,header=TRUE)
a<-table.element(a,round(x[nx+i],4))
a<-table.element(a,round(forecast$pred[i],4))
a<-table.element(a,round(lb[i],4))
a<-table.element(a,round(ub[i],4))
a<-table.element(a,round((1-prob.pval[i]),4))
a<-table.element(a,round((1-prob.dec[i]),4))
a<-table.element(a,round((1-prob.sdec[i]),4))
a<-table.element(a,round((1-prob.ldec[i]),4))
a<-table.row.end(a)
}
a<-table.end(a)
table.save(a,file='mytable.tab')
a<-table.start()
a<-table.row.start(a)
a<-table.element(a,'Univariate ARIMA Extrapolation Forecast Performance',7,TRUE)
a<-table.row.end(a)
a<-table.row.start(a)
a<-table.element(a,'time',1,header=TRUE)
a<-table.element(a,'% S.E.',1,header=TRUE)
a<-table.element(a,'PE',1,header=TRUE)
a<-table.element(a,'MAPE',1,header=TRUE)
a<-table.element(a,'Sq.E',1,header=TRUE)
a<-table.element(a,'MSE',1,header=TRUE)
a<-table.element(a,'RMSE',1,header=TRUE)
a<-table.row.end(a)
for (i in 1:fx) {
a<-table.row.start(a)
a<-table.element(a,nx+i,header=TRUE)
a<-table.element(a,round(perc.se[i],4))
a<-table.element(a,round(perf.pe[i],4))
a<-table.element(a,round(perf.mape1[i],4))
a<-table.element(a,round(perf.se[i],4))
a<-table.element(a,round(perf.mse1[i],4))
a<-table.element(a,round(perf.rmse[i],4))
a<-table.row.end(a)
}
a<-table.end(a)
table.save(a,file='mytable1.tab')