Free Statistics

of Irreproducible Research!

Author's title

Author*Unverified author*
R Software Modulerwasp_smp.wasp
Title produced by softwareStandard Deviation-Mean Plot
Date of computationTue, 06 Dec 2011 07:56:35 -0500
Cite this page as followsStatistical Computations at FreeStatistics.org, Office for Research Development and Education, URL https://freestatistics.org/blog/index.php?v=date/2011/Dec/06/t1323176289xcrofpxa7rslbcz.htm/, Retrieved Mon, 29 Apr 2024 07:07:18 +0000
Statistical Computations at FreeStatistics.org, Office for Research Development and Education, URL https://freestatistics.org/blog/index.php?pk=151533, Retrieved Mon, 29 Apr 2024 07:07:18 +0000
QR Codes:

Original text written by user:
IsPrivate?No (this computation is public)
User-defined keywordsKDGP2W83
Estimated Impact83
Family? (F = Feedback message, R = changed R code, M = changed R Module, P = changed Parameters, D = changed Data)
-       [Standard Deviation-Mean Plot] [opgave 8] [2011-12-06 12:56:35] [0756924702977927793c865c7c536cb0] [Current]
Feedback Forum

Post a new message
Dataseries X:
162.9
164.7
165
167.2
168.6
169.5
169.8
171.9
172
173.7
173.9
175.9
175.6
176.1
176.3
179.4
179.7
179.9
180.4
182.5
183.6
183.9
184.5
187.6
188
188.5
188.6
191.9
193.5
194.9
194.9
196.2
196.2
198
198.6
201.3
203.5
204.1
204.8
206.5
207.8
208.6
209.7
210
211.7
212.4
213.7
214.8
216.4
217.5
218.6
220.4
221.8
222.5
223.4
225.5
226.5
227.8
228.5
229.1
229.9
230.8
231.9
236
237.5
239.1
240.5
241.4
243.2
243.6
244.3
244.5
245.1
245.8
246.7
247.7
248.5


Summary of computational transaction
Raw Inputview raw input (R code)
Raw Outputview raw output of R engine
Computing time1 seconds
R Server'Gwilym Jenkins' @ jenkins.wessa.net
R Framework error message
Warning: there are blank lines in the 'Data' field.
Please, use NA for missing data - blank lines are simply
 deleted and are NOT treated as missing values.

\begin{tabular}{lllllllll}
\hline
Summary of computational transaction \tabularnewline
Raw Input & view raw input (R code)  \tabularnewline
Raw Output & view raw output of R engine  \tabularnewline
Computing time & 1 seconds \tabularnewline
R Server & 'Gwilym Jenkins' @ jenkins.wessa.net \tabularnewline
R Framework error message & 
Warning: there are blank lines in the 'Data' field.
Please, use NA for missing data - blank lines are simply
 deleted and are NOT treated as missing values.
\tabularnewline \hline \end{tabular} %Source: https://freestatistics.org/blog/index.php?pk=151533&T=0

[TABLE]
[ROW][C]Summary of computational transaction[/C][/ROW]
[ROW][C]Raw Input[/C][C]view raw input (R code) [/C][/ROW]
[ROW][C]Raw Output[/C][C]view raw output of R engine [/C][/ROW]
[ROW][C]Computing time[/C][C]1 seconds[/C][/ROW]
[ROW][C]R Server[/C][C]'Gwilym Jenkins' @ jenkins.wessa.net[/C][/ROW]
[ROW][C]R Framework error message[/C][C]
Warning: there are blank lines in the 'Data' field.
Please, use NA for missing data - blank lines are simply
 deleted and are NOT treated as missing values.
[/C][/ROW] [/TABLE] Source: https://freestatistics.org/blog/index.php?pk=151533&T=0

Globally Unique Identifier (entire table): ba.freestatistics.org/blog/index.php?pk=151533&T=0

As an alternative you can also use a QR Code:  

The GUIDs for individual cells are displayed in the table below:

Summary of computational transaction
Raw Inputview raw input (R code)
Raw Outputview raw output of R engine
Computing time1 seconds
R Server'Gwilym Jenkins' @ jenkins.wessa.net
R Framework error message
Warning: there are blank lines in the 'Data' field.
Please, use NA for missing data - blank lines are simply
 deleted and are NOT treated as missing values.


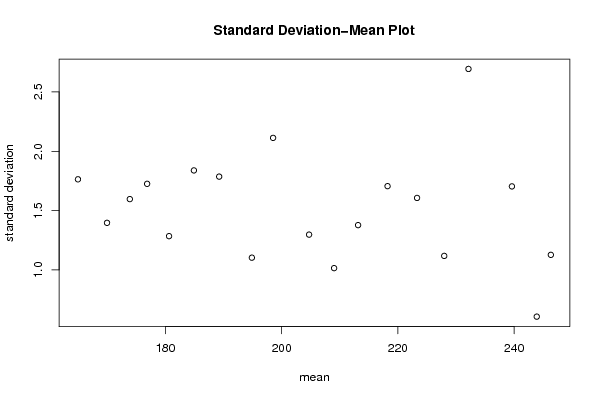
Standard Deviation-Mean Plot
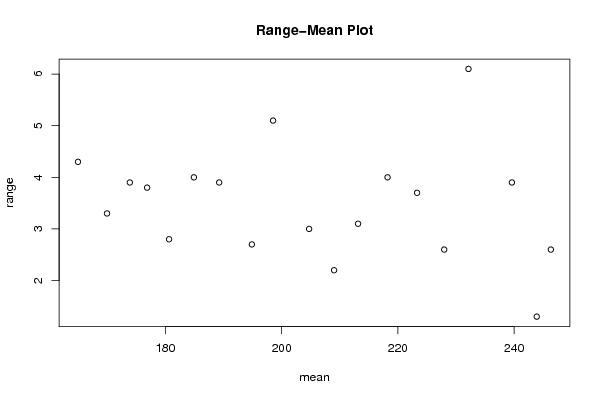
SectionMeanStandard DeviationRange
1164.951.763519208854834.29999999999998
2169.951.39642400437693.30000000000001
3173.8751.596610994158153.90000000000001
4176.851.725301905947683.80000000000001
5180.6251.284198842339722.80000000000001
6184.91.838477631085024
7189.251.786057109949183.90000000000001
8194.8751.102648327134872.69999999999999
9198.5252.112463017427775.10000000000002
10204.7251.297112177107293
11209.0251.014478519568872.19999999999999
12213.151.377195217340913.10000000000002
13218.2251.705627939108254
14223.31.60623784042093.69999999999999
15227.9751.117661248619932.59999999999999
16232.152.693820088028646.09999999999999
17239.6251.703672503740083.90000000000001
18243.90.6055300708195061.30000000000001
19246.3251.126572974408072.59999999999999

\begin{tabular}{lllllllll}
\hline
Standard Deviation-Mean Plot \tabularnewline
Section & Mean & Standard Deviation & Range \tabularnewline
1 & 164.95 & 1.76351920885483 & 4.29999999999998 \tabularnewline
2 & 169.95 & 1.3964240043769 & 3.30000000000001 \tabularnewline
3 & 173.875 & 1.59661099415815 & 3.90000000000001 \tabularnewline
4 & 176.85 & 1.72530190594768 & 3.80000000000001 \tabularnewline
5 & 180.625 & 1.28419884233972 & 2.80000000000001 \tabularnewline
6 & 184.9 & 1.83847763108502 & 4 \tabularnewline
7 & 189.25 & 1.78605710994918 & 3.90000000000001 \tabularnewline
8 & 194.875 & 1.10264832713487 & 2.69999999999999 \tabularnewline
9 & 198.525 & 2.11246301742777 & 5.10000000000002 \tabularnewline
10 & 204.725 & 1.29711217710729 & 3 \tabularnewline
11 & 209.025 & 1.01447851956887 & 2.19999999999999 \tabularnewline
12 & 213.15 & 1.37719521734091 & 3.10000000000002 \tabularnewline
13 & 218.225 & 1.70562793910825 & 4 \tabularnewline
14 & 223.3 & 1.6062378404209 & 3.69999999999999 \tabularnewline
15 & 227.975 & 1.11766124861993 & 2.59999999999999 \tabularnewline
16 & 232.15 & 2.69382008802864 & 6.09999999999999 \tabularnewline
17 & 239.625 & 1.70367250374008 & 3.90000000000001 \tabularnewline
18 & 243.9 & 0.605530070819506 & 1.30000000000001 \tabularnewline
19 & 246.325 & 1.12657297440807 & 2.59999999999999 \tabularnewline
\hline
\end{tabular}
%Source: https://freestatistics.org/blog/index.php?pk=151533&T=1

[TABLE]
[ROW][C]Standard Deviation-Mean Plot[/C][/ROW]
[ROW][C]Section[/C][C]Mean[/C][C]Standard Deviation[/C][C]Range[/C][/ROW]
[ROW][C]1[/C][C]164.95[/C][C]1.76351920885483[/C][C]4.29999999999998[/C][/ROW]
[ROW][C]2[/C][C]169.95[/C][C]1.3964240043769[/C][C]3.30000000000001[/C][/ROW]
[ROW][C]3[/C][C]173.875[/C][C]1.59661099415815[/C][C]3.90000000000001[/C][/ROW]
[ROW][C]4[/C][C]176.85[/C][C]1.72530190594768[/C][C]3.80000000000001[/C][/ROW]
[ROW][C]5[/C][C]180.625[/C][C]1.28419884233972[/C][C]2.80000000000001[/C][/ROW]
[ROW][C]6[/C][C]184.9[/C][C]1.83847763108502[/C][C]4[/C][/ROW]
[ROW][C]7[/C][C]189.25[/C][C]1.78605710994918[/C][C]3.90000000000001[/C][/ROW]
[ROW][C]8[/C][C]194.875[/C][C]1.10264832713487[/C][C]2.69999999999999[/C][/ROW]
[ROW][C]9[/C][C]198.525[/C][C]2.11246301742777[/C][C]5.10000000000002[/C][/ROW]
[ROW][C]10[/C][C]204.725[/C][C]1.29711217710729[/C][C]3[/C][/ROW]
[ROW][C]11[/C][C]209.025[/C][C]1.01447851956887[/C][C]2.19999999999999[/C][/ROW]
[ROW][C]12[/C][C]213.15[/C][C]1.37719521734091[/C][C]3.10000000000002[/C][/ROW]
[ROW][C]13[/C][C]218.225[/C][C]1.70562793910825[/C][C]4[/C][/ROW]
[ROW][C]14[/C][C]223.3[/C][C]1.6062378404209[/C][C]3.69999999999999[/C][/ROW]
[ROW][C]15[/C][C]227.975[/C][C]1.11766124861993[/C][C]2.59999999999999[/C][/ROW]
[ROW][C]16[/C][C]232.15[/C][C]2.69382008802864[/C][C]6.09999999999999[/C][/ROW]
[ROW][C]17[/C][C]239.625[/C][C]1.70367250374008[/C][C]3.90000000000001[/C][/ROW]
[ROW][C]18[/C][C]243.9[/C][C]0.605530070819506[/C][C]1.30000000000001[/C][/ROW]
[ROW][C]19[/C][C]246.325[/C][C]1.12657297440807[/C][C]2.59999999999999[/C][/ROW]
[/TABLE]
Source: https://freestatistics.org/blog/index.php?pk=151533&T=1

Globally Unique Identifier (entire table): ba.freestatistics.org/blog/index.php?pk=151533&T=1

As an alternative you can also use a QR Code:  

The GUIDs for individual cells are displayed in the table below:

Standard Deviation-Mean Plot
SectionMeanStandard DeviationRange
1164.951.763519208854834.29999999999998
2169.951.39642400437693.30000000000001
3173.8751.596610994158153.90000000000001
4176.851.725301905947683.80000000000001
5180.6251.284198842339722.80000000000001
6184.91.838477631085024
7189.251.786057109949183.90000000000001
8194.8751.102648327134872.69999999999999
9198.5252.112463017427775.10000000000002
10204.7251.297112177107293
11209.0251.014478519568872.19999999999999
12213.151.377195217340913.10000000000002
13218.2251.705627939108254
14223.31.60623784042093.69999999999999
15227.9751.117661248619932.59999999999999
16232.152.693820088028646.09999999999999
17239.6251.703672503740083.90000000000001
18243.90.6055300708195061.30000000000001
19246.3251.126572974408072.59999999999999


Regression: S.E.(k) = alpha + beta * Mean(k)
alpha2.18680733976438
beta-0.00326183902037063
S.D.0.00420013170423803
T-STAT-0.776603985317737
p-value0.448063969903216

\begin{tabular}{lllllllll}
\hline
Regression: S.E.(k) = alpha + beta * Mean(k) \tabularnewline
alpha & 2.18680733976438 \tabularnewline
beta & -0.00326183902037063 \tabularnewline
S.D. & 0.00420013170423803 \tabularnewline
T-STAT & -0.776603985317737 \tabularnewline
p-value & 0.448063969903216 \tabularnewline
\hline
\end{tabular}
%Source: https://freestatistics.org/blog/index.php?pk=151533&T=2

[TABLE]
[ROW][C]Regression: S.E.(k) = alpha + beta * Mean(k)[/C][/ROW]
[ROW][C]alpha[/C][C]2.18680733976438[/C][/ROW]
[ROW][C]beta[/C][C]-0.00326183902037063[/C][/ROW]
[ROW][C]S.D.[/C][C]0.00420013170423803[/C][/ROW]
[ROW][C]T-STAT[/C][C]-0.776603985317737[/C][/ROW]
[ROW][C]p-value[/C][C]0.448063969903216[/C][/ROW]
[/TABLE]
Source: https://freestatistics.org/blog/index.php?pk=151533&T=2

Globally Unique Identifier (entire table): ba.freestatistics.org/blog/index.php?pk=151533&T=2

As an alternative you can also use a QR Code:  

The GUIDs for individual cells are displayed in the table below:

Regression: S.E.(k) = alpha + beta * Mean(k)
alpha2.18680733976438
beta-0.00326183902037063
S.D.0.00420013170423803
T-STAT-0.776603985317737
p-value0.448063969903216


Regression: ln S.E.(k) = alpha + beta * ln Mean(k)
alpha4.23832102753369
beta-0.727633992160913
S.D.0.588803509743403
T-STAT-1.23578406059096
p-value0.233343660096893
Lambda1.72763399216091

\begin{tabular}{lllllllll}
\hline
Regression: ln S.E.(k) = alpha + beta * ln Mean(k) \tabularnewline
alpha & 4.23832102753369 \tabularnewline
beta & -0.727633992160913 \tabularnewline
S.D. & 0.588803509743403 \tabularnewline
T-STAT & -1.23578406059096 \tabularnewline
p-value & 0.233343660096893 \tabularnewline
Lambda & 1.72763399216091 \tabularnewline
\hline
\end{tabular}
%Source: https://freestatistics.org/blog/index.php?pk=151533&T=3

[TABLE]
[ROW][C]Regression: ln S.E.(k) = alpha + beta * ln Mean(k)[/C][/ROW]
[ROW][C]alpha[/C][C]4.23832102753369[/C][/ROW]
[ROW][C]beta[/C][C]-0.727633992160913[/C][/ROW]
[ROW][C]S.D.[/C][C]0.588803509743403[/C][/ROW]
[ROW][C]T-STAT[/C][C]-1.23578406059096[/C][/ROW]
[ROW][C]p-value[/C][C]0.233343660096893[/C][/ROW]
[ROW][C]Lambda[/C][C]1.72763399216091[/C][/ROW]
[/TABLE]
Source: https://freestatistics.org/blog/index.php?pk=151533&T=3

Globally Unique Identifier (entire table): ba.freestatistics.org/blog/index.php?pk=151533&T=3

As an alternative you can also use a QR Code:  

The GUIDs for individual cells are displayed in the table below:

Regression: ln S.E.(k) = alpha + beta * ln Mean(k)
alpha4.23832102753369
beta-0.727633992160913
S.D.0.588803509743403
T-STAT-1.23578406059096
p-value0.233343660096893
Lambda1.72763399216091


Parameters (Session):
par1 = 4 ;
Parameters (R input):
par1 = 4 ;
R code (references can be found in the software module):
par1 <- as.numeric(par1)
(n <- length(x))
(np <- floor(n / par1))
arr <- array(NA,dim=c(par1,np))
j <- 0
k <- 1
for (i in 1:(np*par1))
{
j = j + 1
arr[j,k] <- x[i]
if (j == par1) {
j = 0
k=k+1
}
}
arr
arr.mean <- array(NA,dim=np)
arr.sd <- array(NA,dim=np)
arr.range <- array(NA,dim=np)
for (j in 1:np)
{
arr.mean[j] <- mean(arr[,j],na.rm=TRUE)
arr.sd[j] <- sd(arr[,j],na.rm=TRUE)
arr.range[j] <- max(arr[,j],na.rm=TRUE) - min(arr[,j],na.rm=TRUE)
}
arr.mean
arr.sd
arr.range
(lm1 <- lm(arr.sd~arr.mean))
(lnlm1 <- lm(log(arr.sd)~log(arr.mean)))
(lm2 <- lm(arr.range~arr.mean))
bitmap(file='test1.png')
plot(arr.mean,arr.sd,main='Standard Deviation-Mean Plot',xlab='mean',ylab='standard deviation')
dev.off()
bitmap(file='test2.png')
plot(arr.mean,arr.range,main='Range-Mean Plot',xlab='mean',ylab='range')
dev.off()
load(file='createtable')
a<-table.start()
a<-table.row.start(a)
a<-table.element(a,'Standard Deviation-Mean Plot',4,TRUE)
a<-table.row.end(a)
a<-table.row.start(a)
a<-table.element(a,'Section',header=TRUE)
a<-table.element(a,'Mean',header=TRUE)
a<-table.element(a,'Standard Deviation',header=TRUE)
a<-table.element(a,'Range',header=TRUE)
a<-table.row.end(a)
for (j in 1:np) {
a<-table.row.start(a)
a<-table.element(a,j,header=TRUE)
a<-table.element(a,arr.mean[j])
a<-table.element(a,arr.sd[j] )
a<-table.element(a,arr.range[j] )
a<-table.row.end(a)
}
a<-table.end(a)
table.save(a,file='mytable.tab')
a<-table.start()
a<-table.row.start(a)
a<-table.element(a,'Regression: S.E.(k) = alpha + beta * Mean(k)',2,TRUE)
a<-table.row.end(a)
a<-table.row.start(a)
a<-table.element(a,'alpha',header=TRUE)
a<-table.element(a,lm1$coefficients[[1]])
a<-table.row.end(a)
a<-table.row.start(a)
a<-table.element(a,'beta',header=TRUE)
a<-table.element(a,lm1$coefficients[[2]])
a<-table.row.end(a)
a<-table.row.start(a)
a<-table.element(a,'S.D.',header=TRUE)
a<-table.element(a,summary(lm1)$coefficients[2,2])
a<-table.row.end(a)
a<-table.row.start(a)
a<-table.element(a,'T-STAT',header=TRUE)
a<-table.element(a,summary(lm1)$coefficients[2,3])
a<-table.row.end(a)
a<-table.row.start(a)
a<-table.element(a,'p-value',header=TRUE)
a<-table.element(a,summary(lm1)$coefficients[2,4])
a<-table.row.end(a)
a<-table.end(a)
table.save(a,file='mytable1.tab')
a<-table.start()
a<-table.row.start(a)
a<-table.element(a,'Regression: ln S.E.(k) = alpha + beta * ln Mean(k)',2,TRUE)
a<-table.row.end(a)
a<-table.row.start(a)
a<-table.element(a,'alpha',header=TRUE)
a<-table.element(a,lnlm1$coefficients[[1]])
a<-table.row.end(a)
a<-table.row.start(a)
a<-table.element(a,'beta',header=TRUE)
a<-table.element(a,lnlm1$coefficients[[2]])
a<-table.row.end(a)
a<-table.row.start(a)
a<-table.element(a,'S.D.',header=TRUE)
a<-table.element(a,summary(lnlm1)$coefficients[2,2])
a<-table.row.end(a)
a<-table.row.start(a)
a<-table.element(a,'T-STAT',header=TRUE)
a<-table.element(a,summary(lnlm1)$coefficients[2,3])
a<-table.row.end(a)
a<-table.row.start(a)
a<-table.element(a,'p-value',header=TRUE)
a<-table.element(a,summary(lnlm1)$coefficients[2,4])
a<-table.row.end(a)
a<-table.row.start(a)
a<-table.element(a,'Lambda',header=TRUE)
a<-table.element(a,1-lnlm1$coefficients[[2]])
a<-table.row.end(a)
a<-table.end(a)
table.save(a,file='mytable2.tab')