Free Statistics

of Irreproducible Research!

Author's title

Author*The author of this computation has been verified*
R Software Modulerwasp_arimaforecasting.wasp
Title produced by softwareARIMA Forecasting
Date of computationTue, 06 Dec 2011 05:40:33 -0500
Cite this page as followsStatistical Computations at FreeStatistics.org, Office for Research Development and Education, URL https://freestatistics.org/blog/index.php?v=date/2011/Dec/06/t1323168077rbyw64wh51k5yvb.htm/, Retrieved Sun, 28 Apr 2024 21:03:25 +0000
Statistical Computations at FreeStatistics.org, Office for Research Development and Education, URL https://freestatistics.org/blog/index.php?pk=151444, Retrieved Sun, 28 Apr 2024 21:03:25 +0000
QR Codes:

Original text written by user:
IsPrivate?No (this computation is public)
User-defined keywords
Estimated Impact137
Family? (F = Feedback message, R = changed R code, M = changed R Module, P = changed Parameters, D = changed Data)
-     [Univariate Data Series] [data set] [2008-12-01 19:54:57] [b98453cac15ba1066b407e146608df68]
- RMP   [Standard Deviation-Mean Plot] [Unemployment] [2010-11-29 10:34:47] [b98453cac15ba1066b407e146608df68]
- RMP     [ARIMA Forecasting] [Unemployment] [2010-11-29 20:46:45] [b98453cac15ba1066b407e146608df68]
- R PD      [ARIMA Forecasting] [ws9 5 Arima FOUTM...] [2010-12-07 16:14:08] [afe9379cca749d06b3d6872e02cc47ed]
- R PD          [ARIMA Forecasting] [ws9-10] [2011-12-06 10:40:33] [47995d3a8fac585eeb070a274b466f8c] [Current]
-  MP             [ARIMA Forecasting] [paper2-10] [2011-12-21 20:57:31] [f7a862281046b7153543b12c78921b36]
Feedback Forum

Post a new message
Dataseries X:
1770
2203
2836
1976
2837
2150
2180
2631
1781
2327
2260
2051
2250
2102
2957
2485
2871
2447
2570
2622
1840
2682
2369
2119
2531
2214
3206
2709
2734
2348
2702
2642
2064
2647
2534
2297
2718
2321
3112
2664
2808
2668
2934
2616
2228
2463
2416
2407
2582
2101
3305
2818
2401
3019
2507
2948
2210
2467
2596
2451


Summary of computational transaction
Raw Inputview raw input (R code)
Raw Outputview raw output of R engine
Computing time1 seconds
R Server'Herman Ole Andreas Wold' @ wold.wessa.net

\begin{tabular}{lllllllll}
\hline
Summary of computational transaction \tabularnewline
Raw Input & view raw input (R code)  \tabularnewline
Raw Output & view raw output of R engine  \tabularnewline
Computing time & 1 seconds \tabularnewline
R Server & 'Herman Ole Andreas Wold' @ wold.wessa.net \tabularnewline
\hline
\end{tabular}
%Source: https://freestatistics.org/blog/index.php?pk=151444&T=0

[TABLE]
[ROW][C]Summary of computational transaction[/C][/ROW]
[ROW][C]Raw Input[/C][C]view raw input (R code) [/C][/ROW]
[ROW][C]Raw Output[/C][C]view raw output of R engine [/C][/ROW]
[ROW][C]Computing time[/C][C]1 seconds[/C][/ROW]
[ROW][C]R Server[/C][C]'Herman Ole Andreas Wold' @ wold.wessa.net[/C][/ROW]
[/TABLE]
Source: https://freestatistics.org/blog/index.php?pk=151444&T=0

Globally Unique Identifier (entire table): ba.freestatistics.org/blog/index.php?pk=151444&T=0

As an alternative you can also use a QR Code:  

The GUIDs for individual cells are displayed in the table below:

Summary of computational transaction
Raw Inputview raw input (R code)
Raw Outputview raw output of R engine
Computing time1 seconds
R Server'Herman Ole Andreas Wold' @ wold.wessa.net


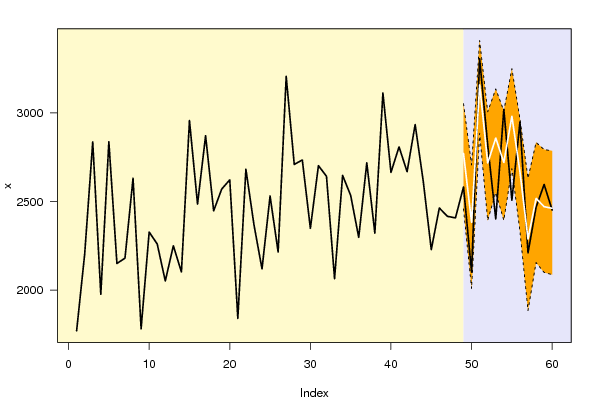
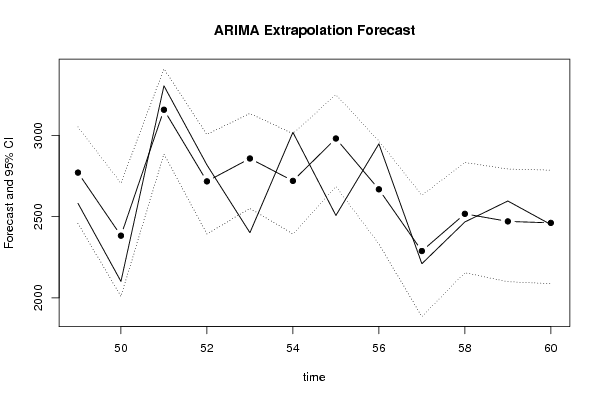
Univariate ARIMA Extrapolation Forecast
timeY[t]F[t]95% LB95% UBp-value(H0: Y[t] = F[t])P(F[t]>Y[t-1])P(F[t]>Y[t-s])P(F[t]>Y[48])
362297-------
372718-------
382321-------
393112-------
402664-------
412808-------
422668-------
432934-------
442616-------
452228-------
462463-------
472416-------
482407-------
4925822770.82492457.74513051.95520.0940.99440.64370.9944
5021012382.61092008.62362705.38360.04360.1130.64580.4411
5133053157.78942884.91753408.88810.125310.63961
5228182716.86132392.90553006.10620.246600.63990.9821
5324012857.742550.49553135.01656e-040.61060.63740.9993
5430192719.82282393.6613010.85680.0220.98410.63650.9824
5525072980.77012685.35483249.43843e-040.39020.63351
5629482667.87112331.90312966.02440.03280.85490.63340.9568
5722102288.1291884.14272630.79350.32751e-040.63460.2483
5824672517.02452155.04552833.12610.37820.97150.63120.7524
5925962470.54962099.26072792.9080.22280.50860.62990.6504
6024512461.24922087.01182785.65560.47530.20780.62850.6285

\begin{tabular}{lllllllll}
\hline
Univariate ARIMA Extrapolation Forecast \tabularnewline
time & Y[t] & F[t] & 95% LB & 95% UB & p-value(H0: Y[t] = F[t]) & P(F[t]>Y[t-1]) & P(F[t]>Y[t-s]) & P(F[t]>Y[48]) \tabularnewline
36 & 2297 & - & - & - & - & - & - & - \tabularnewline
37 & 2718 & - & - & - & - & - & - & - \tabularnewline
38 & 2321 & - & - & - & - & - & - & - \tabularnewline
39 & 3112 & - & - & - & - & - & - & - \tabularnewline
40 & 2664 & - & - & - & - & - & - & - \tabularnewline
41 & 2808 & - & - & - & - & - & - & - \tabularnewline
42 & 2668 & - & - & - & - & - & - & - \tabularnewline
43 & 2934 & - & - & - & - & - & - & - \tabularnewline
44 & 2616 & - & - & - & - & - & - & - \tabularnewline
45 & 2228 & - & - & - & - & - & - & - \tabularnewline
46 & 2463 & - & - & - & - & - & - & - \tabularnewline
47 & 2416 & - & - & - & - & - & - & - \tabularnewline
48 & 2407 & - & - & - & - & - & - & - \tabularnewline
49 & 2582 & 2770.8249 & 2457.7451 & 3051.9552 & 0.094 & 0.9944 & 0.6437 & 0.9944 \tabularnewline
50 & 2101 & 2382.6109 & 2008.6236 & 2705.3836 & 0.0436 & 0.113 & 0.6458 & 0.4411 \tabularnewline
51 & 3305 & 3157.7894 & 2884.9175 & 3408.8881 & 0.1253 & 1 & 0.6396 & 1 \tabularnewline
52 & 2818 & 2716.8613 & 2392.9055 & 3006.1062 & 0.2466 & 0 & 0.6399 & 0.9821 \tabularnewline
53 & 2401 & 2857.74 & 2550.4955 & 3135.0165 & 6e-04 & 0.6106 & 0.6374 & 0.9993 \tabularnewline
54 & 3019 & 2719.8228 & 2393.661 & 3010.8568 & 0.022 & 0.9841 & 0.6365 & 0.9824 \tabularnewline
55 & 2507 & 2980.7701 & 2685.3548 & 3249.4384 & 3e-04 & 0.3902 & 0.6335 & 1 \tabularnewline
56 & 2948 & 2667.8711 & 2331.9031 & 2966.0244 & 0.0328 & 0.8549 & 0.6334 & 0.9568 \tabularnewline
57 & 2210 & 2288.129 & 1884.1427 & 2630.7935 & 0.3275 & 1e-04 & 0.6346 & 0.2483 \tabularnewline
58 & 2467 & 2517.0245 & 2155.0455 & 2833.1261 & 0.3782 & 0.9715 & 0.6312 & 0.7524 \tabularnewline
59 & 2596 & 2470.5496 & 2099.2607 & 2792.908 & 0.2228 & 0.5086 & 0.6299 & 0.6504 \tabularnewline
60 & 2451 & 2461.2492 & 2087.0118 & 2785.6556 & 0.4753 & 0.2078 & 0.6285 & 0.6285 \tabularnewline
\hline
\end{tabular}
%Source: https://freestatistics.org/blog/index.php?pk=151444&T=1

[TABLE]
[ROW][C]Univariate ARIMA Extrapolation Forecast[/C][/ROW]
[ROW][C]time[/C][C]Y[t][/C][C]F[t][/C][C]95% LB[/C][C]95% UB[/C][C]p-value(H0: Y[t] = F[t])[/C][C]P(F[t]>Y[t-1])[/C][C]P(F[t]>Y[t-s])[/C][C]P(F[t]>Y[48])[/C][/ROW]
[ROW][C]36[/C][C]2297[/C][C]-[/C][C]-[/C][C]-[/C][C]-[/C][C]-[/C][C]-[/C][C]-[/C][/ROW]
[ROW][C]37[/C][C]2718[/C][C]-[/C][C]-[/C][C]-[/C][C]-[/C][C]-[/C][C]-[/C][C]-[/C][/ROW]
[ROW][C]38[/C][C]2321[/C][C]-[/C][C]-[/C][C]-[/C][C]-[/C][C]-[/C][C]-[/C][C]-[/C][/ROW]
[ROW][C]39[/C][C]3112[/C][C]-[/C][C]-[/C][C]-[/C][C]-[/C][C]-[/C][C]-[/C][C]-[/C][/ROW]
[ROW][C]40[/C][C]2664[/C][C]-[/C][C]-[/C][C]-[/C][C]-[/C][C]-[/C][C]-[/C][C]-[/C][/ROW]
[ROW][C]41[/C][C]2808[/C][C]-[/C][C]-[/C][C]-[/C][C]-[/C][C]-[/C][C]-[/C][C]-[/C][/ROW]
[ROW][C]42[/C][C]2668[/C][C]-[/C][C]-[/C][C]-[/C][C]-[/C][C]-[/C][C]-[/C][C]-[/C][/ROW]
[ROW][C]43[/C][C]2934[/C][C]-[/C][C]-[/C][C]-[/C][C]-[/C][C]-[/C][C]-[/C][C]-[/C][/ROW]
[ROW][C]44[/C][C]2616[/C][C]-[/C][C]-[/C][C]-[/C][C]-[/C][C]-[/C][C]-[/C][C]-[/C][/ROW]
[ROW][C]45[/C][C]2228[/C][C]-[/C][C]-[/C][C]-[/C][C]-[/C][C]-[/C][C]-[/C][C]-[/C][/ROW]
[ROW][C]46[/C][C]2463[/C][C]-[/C][C]-[/C][C]-[/C][C]-[/C][C]-[/C][C]-[/C][C]-[/C][/ROW]
[ROW][C]47[/C][C]2416[/C][C]-[/C][C]-[/C][C]-[/C][C]-[/C][C]-[/C][C]-[/C][C]-[/C][/ROW]
[ROW][C]48[/C][C]2407[/C][C]-[/C][C]-[/C][C]-[/C][C]-[/C][C]-[/C][C]-[/C][C]-[/C][/ROW]
[ROW][C]49[/C][C]2582[/C][C]2770.8249[/C][C]2457.7451[/C][C]3051.9552[/C][C]0.094[/C][C]0.9944[/C][C]0.6437[/C][C]0.9944[/C][/ROW]
[ROW][C]50[/C][C]2101[/C][C]2382.6109[/C][C]2008.6236[/C][C]2705.3836[/C][C]0.0436[/C][C]0.113[/C][C]0.6458[/C][C]0.4411[/C][/ROW]
[ROW][C]51[/C][C]3305[/C][C]3157.7894[/C][C]2884.9175[/C][C]3408.8881[/C][C]0.1253[/C][C]1[/C][C]0.6396[/C][C]1[/C][/ROW]
[ROW][C]52[/C][C]2818[/C][C]2716.8613[/C][C]2392.9055[/C][C]3006.1062[/C][C]0.2466[/C][C]0[/C][C]0.6399[/C][C]0.9821[/C][/ROW]
[ROW][C]53[/C][C]2401[/C][C]2857.74[/C][C]2550.4955[/C][C]3135.0165[/C][C]6e-04[/C][C]0.6106[/C][C]0.6374[/C][C]0.9993[/C][/ROW]
[ROW][C]54[/C][C]3019[/C][C]2719.8228[/C][C]2393.661[/C][C]3010.8568[/C][C]0.022[/C][C]0.9841[/C][C]0.6365[/C][C]0.9824[/C][/ROW]
[ROW][C]55[/C][C]2507[/C][C]2980.7701[/C][C]2685.3548[/C][C]3249.4384[/C][C]3e-04[/C][C]0.3902[/C][C]0.6335[/C][C]1[/C][/ROW]
[ROW][C]56[/C][C]2948[/C][C]2667.8711[/C][C]2331.9031[/C][C]2966.0244[/C][C]0.0328[/C][C]0.8549[/C][C]0.6334[/C][C]0.9568[/C][/ROW]
[ROW][C]57[/C][C]2210[/C][C]2288.129[/C][C]1884.1427[/C][C]2630.7935[/C][C]0.3275[/C][C]1e-04[/C][C]0.6346[/C][C]0.2483[/C][/ROW]
[ROW][C]58[/C][C]2467[/C][C]2517.0245[/C][C]2155.0455[/C][C]2833.1261[/C][C]0.3782[/C][C]0.9715[/C][C]0.6312[/C][C]0.7524[/C][/ROW]
[ROW][C]59[/C][C]2596[/C][C]2470.5496[/C][C]2099.2607[/C][C]2792.908[/C][C]0.2228[/C][C]0.5086[/C][C]0.6299[/C][C]0.6504[/C][/ROW]
[ROW][C]60[/C][C]2451[/C][C]2461.2492[/C][C]2087.0118[/C][C]2785.6556[/C][C]0.4753[/C][C]0.2078[/C][C]0.6285[/C][C]0.6285[/C][/ROW]
[/TABLE]
Source: https://freestatistics.org/blog/index.php?pk=151444&T=1

Globally Unique Identifier (entire table): ba.freestatistics.org/blog/index.php?pk=151444&T=1

As an alternative you can also use a QR Code:  

The GUIDs for individual cells are displayed in the table below:

Univariate ARIMA Extrapolation Forecast
timeY[t]F[t]95% LB95% UBp-value(H0: Y[t] = F[t])P(F[t]>Y[t-1])P(F[t]>Y[t-s])P(F[t]>Y[48])
362297-------
372718-------
382321-------
393112-------
402664-------
412808-------
422668-------
432934-------
442616-------
452228-------
462463-------
472416-------
482407-------
4925822770.82492457.74513051.95520.0940.99440.64370.9944
5021012382.61092008.62362705.38360.04360.1130.64580.4411
5133053157.78942884.91753408.88810.125310.63961
5228182716.86132392.90553006.10620.246600.63990.9821
5324012857.742550.49553135.01656e-040.61060.63740.9993
5430192719.82282393.6613010.85680.0220.98410.63650.9824
5525072980.77012685.35483249.43843e-040.39020.63351
5629482667.87112331.90312966.02440.03280.85490.63340.9568
5722102288.1291884.14272630.79350.32751e-040.63460.2483
5824672517.02452155.04552833.12610.37820.97150.63120.7524
5925962470.54962099.26072792.9080.22280.50860.62990.6504
6024512461.24922087.01182785.65560.47530.20780.62850.6285


Univariate ARIMA Extrapolation Forecast Performance
time% S.E.PEMAPESq.EMSERMSE
490.0518-0.0681035654.841500
500.0691-0.11820.093279304.687957479.7647239.7494
510.04060.04660.077721670.971945543.5004213.4092
520.05430.03720.067510229.026736714.882191.6113
530.0495-0.15980.086208611.388571094.1833266.6349
540.05460.110.0989507.006174162.9871272.3288
550.046-0.15890.0999224458.096395633.717309.247
560.0570.1050.100578472.174993488.5242305.7589
570.0764-0.03410.09316104.135283779.1477289.4463
580.0641-0.01990.08582502.448675651.4777275.0481
590.06660.05080.082615737.796870204.7795264.9618
600.0672-0.00420.0761105.04664363.135253.6989

\begin{tabular}{lllllllll}
\hline
Univariate ARIMA Extrapolation Forecast Performance \tabularnewline
time & % S.E. & PE & MAPE & Sq.E & MSE & RMSE \tabularnewline
49 & 0.0518 & -0.0681 & 0 & 35654.8415 & 0 & 0 \tabularnewline
50 & 0.0691 & -0.1182 & 0.0932 & 79304.6879 & 57479.7647 & 239.7494 \tabularnewline
51 & 0.0406 & 0.0466 & 0.0777 & 21670.9719 & 45543.5004 & 213.4092 \tabularnewline
52 & 0.0543 & 0.0372 & 0.0675 & 10229.0267 & 36714.882 & 191.6113 \tabularnewline
53 & 0.0495 & -0.1598 & 0.086 & 208611.3885 & 71094.1833 & 266.6349 \tabularnewline
54 & 0.0546 & 0.11 & 0.09 & 89507.0061 & 74162.9871 & 272.3288 \tabularnewline
55 & 0.046 & -0.1589 & 0.0999 & 224458.0963 & 95633.717 & 309.247 \tabularnewline
56 & 0.057 & 0.105 & 0.1005 & 78472.1749 & 93488.5242 & 305.7589 \tabularnewline
57 & 0.0764 & -0.0341 & 0.0931 & 6104.1352 & 83779.1477 & 289.4463 \tabularnewline
58 & 0.0641 & -0.0199 & 0.0858 & 2502.4486 & 75651.4777 & 275.0481 \tabularnewline
59 & 0.0666 & 0.0508 & 0.0826 & 15737.7968 & 70204.7795 & 264.9618 \tabularnewline
60 & 0.0672 & -0.0042 & 0.0761 & 105.046 & 64363.135 & 253.6989 \tabularnewline
\hline
\end{tabular}
%Source: https://freestatistics.org/blog/index.php?pk=151444&T=2

[TABLE]
[ROW][C]Univariate ARIMA Extrapolation Forecast Performance[/C][/ROW]
[ROW][C]time[/C][C]% S.E.[/C][C]PE[/C][C]MAPE[/C][C]Sq.E[/C][C]MSE[/C][C]RMSE[/C][/ROW]
[ROW][C]49[/C][C]0.0518[/C][C]-0.0681[/C][C]0[/C][C]35654.8415[/C][C]0[/C][C]0[/C][/ROW]
[ROW][C]50[/C][C]0.0691[/C][C]-0.1182[/C][C]0.0932[/C][C]79304.6879[/C][C]57479.7647[/C][C]239.7494[/C][/ROW]
[ROW][C]51[/C][C]0.0406[/C][C]0.0466[/C][C]0.0777[/C][C]21670.9719[/C][C]45543.5004[/C][C]213.4092[/C][/ROW]
[ROW][C]52[/C][C]0.0543[/C][C]0.0372[/C][C]0.0675[/C][C]10229.0267[/C][C]36714.882[/C][C]191.6113[/C][/ROW]
[ROW][C]53[/C][C]0.0495[/C][C]-0.1598[/C][C]0.086[/C][C]208611.3885[/C][C]71094.1833[/C][C]266.6349[/C][/ROW]
[ROW][C]54[/C][C]0.0546[/C][C]0.11[/C][C]0.09[/C][C]89507.0061[/C][C]74162.9871[/C][C]272.3288[/C][/ROW]
[ROW][C]55[/C][C]0.046[/C][C]-0.1589[/C][C]0.0999[/C][C]224458.0963[/C][C]95633.717[/C][C]309.247[/C][/ROW]
[ROW][C]56[/C][C]0.057[/C][C]0.105[/C][C]0.1005[/C][C]78472.1749[/C][C]93488.5242[/C][C]305.7589[/C][/ROW]
[ROW][C]57[/C][C]0.0764[/C][C]-0.0341[/C][C]0.0931[/C][C]6104.1352[/C][C]83779.1477[/C][C]289.4463[/C][/ROW]
[ROW][C]58[/C][C]0.0641[/C][C]-0.0199[/C][C]0.0858[/C][C]2502.4486[/C][C]75651.4777[/C][C]275.0481[/C][/ROW]
[ROW][C]59[/C][C]0.0666[/C][C]0.0508[/C][C]0.0826[/C][C]15737.7968[/C][C]70204.7795[/C][C]264.9618[/C][/ROW]
[ROW][C]60[/C][C]0.0672[/C][C]-0.0042[/C][C]0.0761[/C][C]105.046[/C][C]64363.135[/C][C]253.6989[/C][/ROW]
[/TABLE]
Source: https://freestatistics.org/blog/index.php?pk=151444&T=2

Globally Unique Identifier (entire table): ba.freestatistics.org/blog/index.php?pk=151444&T=2

As an alternative you can also use a QR Code:  

The GUIDs for individual cells are displayed in the table below:

Univariate ARIMA Extrapolation Forecast Performance
time% S.E.PEMAPESq.EMSERMSE
490.0518-0.0681035654.841500
500.0691-0.11820.093279304.687957479.7647239.7494
510.04060.04660.077721670.971945543.5004213.4092
520.05430.03720.067510229.026736714.882191.6113
530.0495-0.15980.086208611.388571094.1833266.6349
540.05460.110.0989507.006174162.9871272.3288
550.046-0.15890.0999224458.096395633.717309.247
560.0570.1050.100578472.174993488.5242305.7589
570.0764-0.03410.09316104.135283779.1477289.4463
580.0641-0.01990.08582502.448675651.4777275.0481
590.06660.05080.082615737.796870204.7795264.9618
600.0672-0.00420.0761105.04664363.135253.6989


Parameters (Session):
par1 = 24 ; par2 = 1 ; par3 = 1 ; par4 = 1 ; par5 = 12 ; par6 = 1 ; par7 = 1 ; par8 = 2 ; par9 = 1 ; par10 = FALSE ;
Parameters (R input):
par1 = 12 ; par2 = 2.0 ; par3 = 0 ; par4 = 1 ; par5 = 12 ; par6 = 2 ; par7 = 1 ; par8 = 0 ; par9 = 0 ; par10 = FALSE ;
R code (references can be found in the software module):
par1 <- as.numeric(par1) #cut off periods
par2 <- as.numeric(par2) #lambda
par3 <- as.numeric(par3) #degree of non-seasonal differencing
par4 <- as.numeric(par4) #degree of seasonal differencing
par5 <- as.numeric(par5) #seasonal period
par6 <- as.numeric(par6) #p
par7 <- as.numeric(par7) #q
par8 <- as.numeric(par8) #P
par9 <- as.numeric(par9) #Q
if (par10 == 'TRUE') par10 <- TRUE
if (par10 == 'FALSE') par10 <- FALSE
if (par2 == 0) x <- log(x)
if (par2 != 0) x <- x^par2
lx <- length(x)
first <- lx - 2*par1
nx <- lx - par1
nx1 <- nx + 1
fx <- lx - nx
if (fx < 1) {
fx <- par5
nx1 <- lx + fx - 1
first <- lx - 2*fx
}
first <- 1
if (fx < 3) fx <- round(lx/10,0)
(arima.out <- arima(x[1:nx], order=c(par6,par3,par7), seasonal=list(order=c(par8,par4,par9), period=par5), include.mean=par10, method='ML'))
(forecast <- predict(arima.out,par1))
(lb <- forecast$pred - 1.96 * forecast$se)
(ub <- forecast$pred + 1.96 * forecast$se)
if (par2 == 0) {
x <- exp(x)
forecast$pred <- exp(forecast$pred)
lb <- exp(lb)
ub <- exp(ub)
}
if (par2 != 0) {
x <- x^(1/par2)
forecast$pred <- forecast$pred^(1/par2)
lb <- lb^(1/par2)
ub <- ub^(1/par2)
}
if (par2 < 0) {
olb <- lb
lb <- ub
ub <- olb
}
(actandfor <- c(x[1:nx], forecast$pred))
(perc.se <- (ub-forecast$pred)/1.96/forecast$pred)
bitmap(file='test1.png')
opar <- par(mar=c(4,4,2,2),las=1)
ylim <- c( min(x[first:nx],lb), max(x[first:nx],ub))
plot(x,ylim=ylim,type='n',xlim=c(first,lx))
usr <- par('usr')
rect(usr[1],usr[3],nx+1,usr[4],border=NA,col='lemonchiffon')
rect(nx1,usr[3],usr[2],usr[4],border=NA,col='lavender')
abline(h= (-3:3)*2 , col ='gray', lty =3)
polygon( c(nx1:lx,lx:nx1), c(lb,rev(ub)), col = 'orange', lty=2,border=NA)
lines(nx1:lx, lb , lty=2)
lines(nx1:lx, ub , lty=2)
lines(x, lwd=2)
lines(nx1:lx, forecast$pred , lwd=2 , col ='white')
box()
par(opar)
dev.off()
prob.dec <- array(NA, dim=fx)
prob.sdec <- array(NA, dim=fx)
prob.ldec <- array(NA, dim=fx)
prob.pval <- array(NA, dim=fx)
perf.pe <- array(0, dim=fx)
perf.mape <- array(0, dim=fx)
perf.mape1 <- array(0, dim=fx)
perf.se <- array(0, dim=fx)
perf.mse <- array(0, dim=fx)
perf.mse1 <- array(0, dim=fx)
perf.rmse <- array(0, dim=fx)
for (i in 1:fx) {
locSD <- (ub[i] - forecast$pred[i]) / 1.96
perf.pe[i] = (x[nx+i] - forecast$pred[i]) / forecast$pred[i]
perf.se[i] = (x[nx+i] - forecast$pred[i])^2
prob.dec[i] = pnorm((x[nx+i-1] - forecast$pred[i]) / locSD)
prob.sdec[i] = pnorm((x[nx+i-par5] - forecast$pred[i]) / locSD)
prob.ldec[i] = pnorm((x[nx] - forecast$pred[i]) / locSD)
prob.pval[i] = pnorm(abs(x[nx+i] - forecast$pred[i]) / locSD)
}
perf.mape[1] = abs(perf.pe[1])
perf.mse[1] = abs(perf.se[1])
for (i in 2:fx) {
perf.mape[i] = perf.mape[i-1] + abs(perf.pe[i])
perf.mape1[i] = perf.mape[i] / i
perf.mse[i] = perf.mse[i-1] + perf.se[i]
perf.mse1[i] = perf.mse[i] / i
}
perf.rmse = sqrt(perf.mse1)
bitmap(file='test2.png')
plot(forecast$pred, pch=19, type='b',main='ARIMA Extrapolation Forecast', ylab='Forecast and 95% CI', xlab='time',ylim=c(min(lb),max(ub)))
dum <- forecast$pred
dum[1:par1] <- x[(nx+1):lx]
lines(dum, lty=1)
lines(ub,lty=3)
lines(lb,lty=3)
dev.off()
load(file='createtable')
a<-table.start()
a<-table.row.start(a)
a<-table.element(a,'Univariate ARIMA Extrapolation Forecast',9,TRUE)
a<-table.row.end(a)
a<-table.row.start(a)
a<-table.element(a,'time',1,header=TRUE)
a<-table.element(a,'Y[t]',1,header=TRUE)
a<-table.element(a,'F[t]',1,header=TRUE)
a<-table.element(a,'95% LB',1,header=TRUE)
a<-table.element(a,'95% UB',1,header=TRUE)
a<-table.element(a,'p-value
(H0: Y[t] = F[t])',1,header=TRUE)
a<-table.element(a,'P(F[t]>Y[t-1])',1,header=TRUE)
a<-table.element(a,'P(F[t]>Y[t-s])',1,header=TRUE)
mylab <- paste('P(F[t]>Y[',nx,sep='')
mylab <- paste(mylab,'])',sep='')
a<-table.element(a,mylab,1,header=TRUE)
a<-table.row.end(a)
for (i in (nx-par5):nx) {
a<-table.row.start(a)
a<-table.element(a,i,header=TRUE)
a<-table.element(a,x[i])
a<-table.element(a,'-')
a<-table.row.end(a)
}
for (i in 1:fx) {
a<-table.row.start(a)
a<-table.element(a,nx+i,header=TRUE)
a<-table.element(a,round(x[nx+i],4))
a<-table.element(a,round(forecast$pred[i],4))
a<-table.element(a,round(lb[i],4))
a<-table.element(a,round(ub[i],4))
a<-table.element(a,round((1-prob.pval[i]),4))
a<-table.element(a,round((1-prob.dec[i]),4))
a<-table.element(a,round((1-prob.sdec[i]),4))
a<-table.element(a,round((1-prob.ldec[i]),4))
a<-table.row.end(a)
}
a<-table.end(a)
table.save(a,file='mytable.tab')
a<-table.start()
a<-table.row.start(a)
a<-table.element(a,'Univariate ARIMA Extrapolation Forecast Performance',7,TRUE)
a<-table.row.end(a)
a<-table.row.start(a)
a<-table.element(a,'time',1,header=TRUE)
a<-table.element(a,'% S.E.',1,header=TRUE)
a<-table.element(a,'PE',1,header=TRUE)
a<-table.element(a,'MAPE',1,header=TRUE)
a<-table.element(a,'Sq.E',1,header=TRUE)
a<-table.element(a,'MSE',1,header=TRUE)
a<-table.element(a,'RMSE',1,header=TRUE)
a<-table.row.end(a)
for (i in 1:fx) {
a<-table.row.start(a)
a<-table.element(a,nx+i,header=TRUE)
a<-table.element(a,round(perc.se[i],4))
a<-table.element(a,round(perf.pe[i],4))
a<-table.element(a,round(perf.mape1[i],4))
a<-table.element(a,round(perf.se[i],4))
a<-table.element(a,round(perf.mse1[i],4))
a<-table.element(a,round(perf.rmse[i],4))
a<-table.row.end(a)
}
a<-table.end(a)
table.save(a,file='mytable1.tab')