Free Statistics

of Irreproducible Research!

Author's title

Author*The author of this computation has been verified*
R Software Modulerwasp_arimabackwardselection.wasp
Title produced by softwareARIMA Backward Selection
Date of computationTue, 06 Dec 2011 04:46:03 -0500
Cite this page as followsStatistical Computations at FreeStatistics.org, Office for Research Development and Education, URL https://freestatistics.org/blog/index.php?v=date/2011/Dec/06/t13231647780hzzadvhz2guucu.htm/, Retrieved Mon, 29 Apr 2024 03:24:06 +0000
Statistical Computations at FreeStatistics.org, Office for Research Development and Education, URL https://freestatistics.org/blog/index.php?pk=151416, Retrieved Mon, 29 Apr 2024 03:24:06 +0000
QR Codes:

Original text written by user:
IsPrivate?No (this computation is public)
User-defined keywords
Estimated Impact176
Family? (F = Feedback message, R = changed R code, M = changed R Module, P = changed Parameters, D = changed Data)
-     [Standard Deviation-Mean Plot] [stand dev mean plot] [2011-12-06 09:20:11] [bcad5ea7a7be31884500e96b7abaff18]
- RMP     [ARIMA Backward Selection] [ARIMA B S] [2011-12-06 09:46:03] [d14d64ba86ecc27fb5997ae1bd82937b] [Current]
- R P       [ARIMA Backward Selection] [] [2011-12-06 19:26:35] [74be16979710d4c4e7c6647856088456]
- R P       [ARIMA Backward Selection] [] [2011-12-06 19:38:29] [74be16979710d4c4e7c6647856088456]
-   P         [ARIMA Backward Selection] [] [2011-12-06 20:04:26] [25b6caf3839c2bdc14961e5bff2d6373]
-               [ARIMA Backward Selection] [] [2011-12-06 20:12:17] [bcad5ea7a7be31884500e96b7abaff18]
- RMP           [ARIMA Forecasting] [] [2011-12-06 20:28:02] [bcad5ea7a7be31884500e96b7abaff18]
- RMP         [ARIMA Forecasting] [] [2011-12-06 20:26:47] [25b6caf3839c2bdc14961e5bff2d6373]
- R P       [ARIMA Backward Selection] [] [2011-12-06 19:31:21] [74be16979710d4c4e7c6647856088456]
Feedback Forum

Post a new message
Dataseries X:
2851
2672
2755
2721
2946
3036
2282
2212
2922
4301
5764
7132
2541
2475
3031
3266
3776
3230
3028
1759
3595
4474
6838
8357
3113
3006
4047
3523
3937
3986
3260
1573
3528
5211
7614
9254
5375
3088
3718
4514
4520
4539
3663
1643
4739
5428
8314
10651
3633
4292
4154
4121
4647
4753
3965
1723
5048
6922
9858
11331
4016
3957
4510
4276
4968
4677
3523
1821
5222
6873
10803
13916
2639
2899
3370
3740
2927
3986
4217
1738
5221
6424
9842
13076
3934
3162
4286
4676
5010
4874
4633
1659
5951
6981
9851
12670


Summary of computational transaction
Raw Inputview raw input (R code)
Raw Outputview raw output of R engine
Computing time8 seconds
R Server'Gertrude Mary Cox' @ cox.wessa.net

\begin{tabular}{lllllllll}
\hline
Summary of computational transaction \tabularnewline
Raw Input & view raw input (R code)  \tabularnewline
Raw Output & view raw output of R engine  \tabularnewline
Computing time & 8 seconds \tabularnewline
R Server & 'Gertrude Mary Cox' @ cox.wessa.net \tabularnewline
\hline
\end{tabular}
%Source: https://freestatistics.org/blog/index.php?pk=151416&T=0

[TABLE]
[ROW][C]Summary of computational transaction[/C][/ROW]
[ROW][C]Raw Input[/C][C]view raw input (R code) [/C][/ROW]
[ROW][C]Raw Output[/C][C]view raw output of R engine [/C][/ROW]
[ROW][C]Computing time[/C][C]8 seconds[/C][/ROW]
[ROW][C]R Server[/C][C]'Gertrude Mary Cox' @ cox.wessa.net[/C][/ROW]
[/TABLE]
Source: https://freestatistics.org/blog/index.php?pk=151416&T=0

Globally Unique Identifier (entire table): ba.freestatistics.org/blog/index.php?pk=151416&T=0

As an alternative you can also use a QR Code:  

The GUIDs for individual cells are displayed in the table below:

Summary of computational transaction
Raw Inputview raw input (R code)
Raw Outputview raw output of R engine
Computing time8 seconds
R Server'Gertrude Mary Cox' @ cox.wessa.net


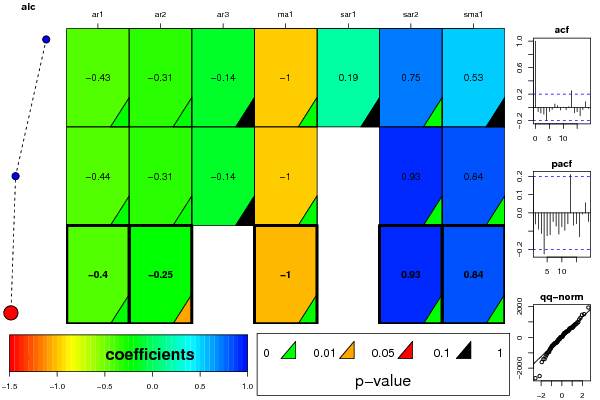
ARIMA Parameter Estimation and Backward Selection
Iterationar1ar2ar3ma1sar1sar2sma1
Estimates ( 1 )-0.4302-0.3107-0.1371-10.19430.74880.5272
(p-val)(1e-04 )(0.0055 )(0.1847 )(0 )(0.5123 )(0.0082 )(0.1839 )
Estimates ( 2 )-0.4367-0.3053-0.138-100.92660.8385
(p-val)(1e-04 )(0.0068 )(0.1831 )(0 )(NA )(0 )(0 )
Estimates ( 3 )-0.4001-0.24530-100.92690.8406
(p-val)(3e-04 )(0.0178 )(NA )(0 )(NA )(0 )(0 )
Estimates ( 4 )NANANANANANANA
(p-val)(NA )(NA )(NA )(NA )(NA )(NA )(NA )
Estimates ( 5 )NANANANANANANA
(p-val)(NA )(NA )(NA )(NA )(NA )(NA )(NA )
Estimates ( 6 )NANANANANANANA
(p-val)(NA )(NA )(NA )(NA )(NA )(NA )(NA )
Estimates ( 7 )NANANANANANANA
(p-val)(NA )(NA )(NA )(NA )(NA )(NA )(NA )
Estimates ( 8 )NANANANANANANA
(p-val)(NA )(NA )(NA )(NA )(NA )(NA )(NA )
Estimates ( 9 )NANANANANANANA
(p-val)(NA )(NA )(NA )(NA )(NA )(NA )(NA )
Estimates ( 10 )NANANANANANANA
(p-val)(NA )(NA )(NA )(NA )(NA )(NA )(NA )
Estimates ( 11 )NANANANANANANA
(p-val)(NA )(NA )(NA )(NA )(NA )(NA )(NA )
Estimates ( 12 )NANANANANANANA
(p-val)(NA )(NA )(NA )(NA )(NA )(NA )(NA )
Estimates ( 13 )NANANANANANANA
(p-val)(NA )(NA )(NA )(NA )(NA )(NA )(NA )

\begin{tabular}{lllllllll}
\hline
ARIMA Parameter Estimation and Backward Selection \tabularnewline
Iteration & ar1 & ar2 & ar3 & ma1 & sar1 & sar2 & sma1 \tabularnewline
Estimates ( 1 ) & -0.4302 & -0.3107 & -0.1371 & -1 & 0.1943 & 0.7488 & 0.5272 \tabularnewline
(p-val) & (1e-04 ) & (0.0055 ) & (0.1847 ) & (0 ) & (0.5123 ) & (0.0082 ) & (0.1839 ) \tabularnewline
Estimates ( 2 ) & -0.4367 & -0.3053 & -0.138 & -1 & 0 & 0.9266 & 0.8385 \tabularnewline
(p-val) & (1e-04 ) & (0.0068 ) & (0.1831 ) & (0 ) & (NA ) & (0 ) & (0 ) \tabularnewline
Estimates ( 3 ) & -0.4001 & -0.2453 & 0 & -1 & 0 & 0.9269 & 0.8406 \tabularnewline
(p-val) & (3e-04 ) & (0.0178 ) & (NA ) & (0 ) & (NA ) & (0 ) & (0 ) \tabularnewline
Estimates ( 4 ) & NA & NA & NA & NA & NA & NA & NA \tabularnewline
(p-val) & (NA ) & (NA ) & (NA ) & (NA ) & (NA ) & (NA ) & (NA ) \tabularnewline
Estimates ( 5 ) & NA & NA & NA & NA & NA & NA & NA \tabularnewline
(p-val) & (NA ) & (NA ) & (NA ) & (NA ) & (NA ) & (NA ) & (NA ) \tabularnewline
Estimates ( 6 ) & NA & NA & NA & NA & NA & NA & NA \tabularnewline
(p-val) & (NA ) & (NA ) & (NA ) & (NA ) & (NA ) & (NA ) & (NA ) \tabularnewline
Estimates ( 7 ) & NA & NA & NA & NA & NA & NA & NA \tabularnewline
(p-val) & (NA ) & (NA ) & (NA ) & (NA ) & (NA ) & (NA ) & (NA ) \tabularnewline
Estimates ( 8 ) & NA & NA & NA & NA & NA & NA & NA \tabularnewline
(p-val) & (NA ) & (NA ) & (NA ) & (NA ) & (NA ) & (NA ) & (NA ) \tabularnewline
Estimates ( 9 ) & NA & NA & NA & NA & NA & NA & NA \tabularnewline
(p-val) & (NA ) & (NA ) & (NA ) & (NA ) & (NA ) & (NA ) & (NA ) \tabularnewline
Estimates ( 10 ) & NA & NA & NA & NA & NA & NA & NA \tabularnewline
(p-val) & (NA ) & (NA ) & (NA ) & (NA ) & (NA ) & (NA ) & (NA ) \tabularnewline
Estimates ( 11 ) & NA & NA & NA & NA & NA & NA & NA \tabularnewline
(p-val) & (NA ) & (NA ) & (NA ) & (NA ) & (NA ) & (NA ) & (NA ) \tabularnewline
Estimates ( 12 ) & NA & NA & NA & NA & NA & NA & NA \tabularnewline
(p-val) & (NA ) & (NA ) & (NA ) & (NA ) & (NA ) & (NA ) & (NA ) \tabularnewline
Estimates ( 13 ) & NA & NA & NA & NA & NA & NA & NA \tabularnewline
(p-val) & (NA ) & (NA ) & (NA ) & (NA ) & (NA ) & (NA ) & (NA ) \tabularnewline
\hline
\end{tabular}
%Source: https://freestatistics.org/blog/index.php?pk=151416&T=1

[TABLE]
[ROW][C]ARIMA Parameter Estimation and Backward Selection[/C][/ROW]
[ROW][C]Iteration[/C][C]ar1[/C][C]ar2[/C][C]ar3[/C][C]ma1[/C][C]sar1[/C][C]sar2[/C][C]sma1[/C][/ROW]
[ROW][C]Estimates ( 1 )[/C][C]-0.4302[/C][C]-0.3107[/C][C]-0.1371[/C][C]-1[/C][C]0.1943[/C][C]0.7488[/C][C]0.5272[/C][/ROW]
[ROW][C](p-val)[/C][C](1e-04 )[/C][C](0.0055 )[/C][C](0.1847 )[/C][C](0 )[/C][C](0.5123 )[/C][C](0.0082 )[/C][C](0.1839 )[/C][/ROW]
[ROW][C]Estimates ( 2 )[/C][C]-0.4367[/C][C]-0.3053[/C][C]-0.138[/C][C]-1[/C][C]0[/C][C]0.9266[/C][C]0.8385[/C][/ROW]
[ROW][C](p-val)[/C][C](1e-04 )[/C][C](0.0068 )[/C][C](0.1831 )[/C][C](0 )[/C][C](NA )[/C][C](0 )[/C][C](0 )[/C][/ROW]
[ROW][C]Estimates ( 3 )[/C][C]-0.4001[/C][C]-0.2453[/C][C]0[/C][C]-1[/C][C]0[/C][C]0.9269[/C][C]0.8406[/C][/ROW]
[ROW][C](p-val)[/C][C](3e-04 )[/C][C](0.0178 )[/C][C](NA )[/C][C](0 )[/C][C](NA )[/C][C](0 )[/C][C](0 )[/C][/ROW]
[ROW][C]Estimates ( 4 )[/C][C]NA[/C][C]NA[/C][C]NA[/C][C]NA[/C][C]NA[/C][C]NA[/C][C]NA[/C][/ROW]
[ROW][C](p-val)[/C][C](NA )[/C][C](NA )[/C][C](NA )[/C][C](NA )[/C][C](NA )[/C][C](NA )[/C][C](NA )[/C][/ROW]
[ROW][C]Estimates ( 5 )[/C][C]NA[/C][C]NA[/C][C]NA[/C][C]NA[/C][C]NA[/C][C]NA[/C][C]NA[/C][/ROW]
[ROW][C](p-val)[/C][C](NA )[/C][C](NA )[/C][C](NA )[/C][C](NA )[/C][C](NA )[/C][C](NA )[/C][C](NA )[/C][/ROW]
[ROW][C]Estimates ( 6 )[/C][C]NA[/C][C]NA[/C][C]NA[/C][C]NA[/C][C]NA[/C][C]NA[/C][C]NA[/C][/ROW]
[ROW][C](p-val)[/C][C](NA )[/C][C](NA )[/C][C](NA )[/C][C](NA )[/C][C](NA )[/C][C](NA )[/C][C](NA )[/C][/ROW]
[ROW][C]Estimates ( 7 )[/C][C]NA[/C][C]NA[/C][C]NA[/C][C]NA[/C][C]NA[/C][C]NA[/C][C]NA[/C][/ROW]
[ROW][C](p-val)[/C][C](NA )[/C][C](NA )[/C][C](NA )[/C][C](NA )[/C][C](NA )[/C][C](NA )[/C][C](NA )[/C][/ROW]
[ROW][C]Estimates ( 8 )[/C][C]NA[/C][C]NA[/C][C]NA[/C][C]NA[/C][C]NA[/C][C]NA[/C][C]NA[/C][/ROW]
[ROW][C](p-val)[/C][C](NA )[/C][C](NA )[/C][C](NA )[/C][C](NA )[/C][C](NA )[/C][C](NA )[/C][C](NA )[/C][/ROW]
[ROW][C]Estimates ( 9 )[/C][C]NA[/C][C]NA[/C][C]NA[/C][C]NA[/C][C]NA[/C][C]NA[/C][C]NA[/C][/ROW]
[ROW][C](p-val)[/C][C](NA )[/C][C](NA )[/C][C](NA )[/C][C](NA )[/C][C](NA )[/C][C](NA )[/C][C](NA )[/C][/ROW]
[ROW][C]Estimates ( 10 )[/C][C]NA[/C][C]NA[/C][C]NA[/C][C]NA[/C][C]NA[/C][C]NA[/C][C]NA[/C][/ROW]
[ROW][C](p-val)[/C][C](NA )[/C][C](NA )[/C][C](NA )[/C][C](NA )[/C][C](NA )[/C][C](NA )[/C][C](NA )[/C][/ROW]
[ROW][C]Estimates ( 11 )[/C][C]NA[/C][C]NA[/C][C]NA[/C][C]NA[/C][C]NA[/C][C]NA[/C][C]NA[/C][/ROW]
[ROW][C](p-val)[/C][C](NA )[/C][C](NA )[/C][C](NA )[/C][C](NA )[/C][C](NA )[/C][C](NA )[/C][C](NA )[/C][/ROW]
[ROW][C]Estimates ( 12 )[/C][C]NA[/C][C]NA[/C][C]NA[/C][C]NA[/C][C]NA[/C][C]NA[/C][C]NA[/C][/ROW]
[ROW][C](p-val)[/C][C](NA )[/C][C](NA )[/C][C](NA )[/C][C](NA )[/C][C](NA )[/C][C](NA )[/C][C](NA )[/C][/ROW]
[ROW][C]Estimates ( 13 )[/C][C]NA[/C][C]NA[/C][C]NA[/C][C]NA[/C][C]NA[/C][C]NA[/C][C]NA[/C][/ROW]
[ROW][C](p-val)[/C][C](NA )[/C][C](NA )[/C][C](NA )[/C][C](NA )[/C][C](NA )[/C][C](NA )[/C][C](NA )[/C][/ROW]
[/TABLE]
Source: https://freestatistics.org/blog/index.php?pk=151416&T=1

Globally Unique Identifier (entire table): ba.freestatistics.org/blog/index.php?pk=151416&T=1

As an alternative you can also use a QR Code:  

The GUIDs for individual cells are displayed in the table below:

ARIMA Parameter Estimation and Backward Selection
Iterationar1ar2ar3ma1sar1sar2sma1
Estimates ( 1 )-0.4302-0.3107-0.1371-10.19430.74880.5272
(p-val)(1e-04 )(0.0055 )(0.1847 )(0 )(0.5123 )(0.0082 )(0.1839 )
Estimates ( 2 )-0.4367-0.3053-0.138-100.92660.8385
(p-val)(1e-04 )(0.0068 )(0.1831 )(0 )(NA )(0 )(0 )
Estimates ( 3 )-0.4001-0.24530-100.92690.8406
(p-val)(3e-04 )(0.0178 )(NA )(0 )(NA )(0 )(0 )
Estimates ( 4 )NANANANANANANA
(p-val)(NA )(NA )(NA )(NA )(NA )(NA )(NA )
Estimates ( 5 )NANANANANANANA
(p-val)(NA )(NA )(NA )(NA )(NA )(NA )(NA )
Estimates ( 6 )NANANANANANANA
(p-val)(NA )(NA )(NA )(NA )(NA )(NA )(NA )
Estimates ( 7 )NANANANANANANA
(p-val)(NA )(NA )(NA )(NA )(NA )(NA )(NA )
Estimates ( 8 )NANANANANANANA
(p-val)(NA )(NA )(NA )(NA )(NA )(NA )(NA )
Estimates ( 9 )NANANANANANANA
(p-val)(NA )(NA )(NA )(NA )(NA )(NA )(NA )
Estimates ( 10 )NANANANANANANA
(p-val)(NA )(NA )(NA )(NA )(NA )(NA )(NA )
Estimates ( 11 )NANANANANANANA
(p-val)(NA )(NA )(NA )(NA )(NA )(NA )(NA )
Estimates ( 12 )NANANANANANANA
(p-val)(NA )(NA )(NA )(NA )(NA )(NA )(NA )
Estimates ( 13 )NANANANANANANA
(p-val)(NA )(NA )(NA )(NA )(NA )(NA )(NA )


Estimated ARIMA Residuals
Value
-4.22497994706475
42.122684884488
6.62221101022214
62.1135011175233
35.3344792303557
-187.189958715677
-68.9244953081601
155.150441534712
432.852822685899
580.09508616584
573.482403364729
-1249.97425631919
-66.4390256822151
331.534916605702
380.521835633251
520.105261091278
-323.966354870738
331.861092668382
-1029.07015324659
638.628474593548
-198.875368538846
900.562970959912
618.941024825617
-562.300417496
-201.726057438736
360.379151550019
-501.180081236251
-100.354586013437
266.993738481659
-286.855016605464
-786.140814603508
83.5016343629068
588.644237928867
665.290889628989
620.309939231777
1268.65037311026
-1601.62291366903
-946.612990630831
379.959649046154
-394.577830638221
289.452759058442
-286.066016416274
-413.162570536489
789.303242610849
-321.041427532147
410.687204382573
853.219574217609
-2506.99619737505
1460.19326538727
-515.069630270679
-386.47665499916
416.243402394718
-123.340547650398
241.306309506465
-348.243611263121
539.480302811459
982.719608783003
857.113110206593
-118.721706288746
-1413.7104473664
-654.922476974095
151.407723924067
-541.600453177987
193.920941932241
-204.938118665612
-588.474235872648
302.154268334862
18.6387982521249
437.853580114796
1160.37189204667
1938.7608277767
-2644.84853150836
-1408.31886089851
-983.239000830758
347.104549791956
-1134.46896590761
762.458457266409
1510.56657504315
-113.813198654519
632.085479345351
-699.271133923711
-419.192106228644
460.461117041157
761.301644854081
81.143761128398
644.993762132182
41.6821340033191
979.956129639555
-359.133223163252
-372.587879468961
-934.656859847713
276.647178993845
264.643708658612
-481.815692863818
-771.192644329648

\begin{tabular}{lllllllll}
\hline
Estimated ARIMA Residuals \tabularnewline
Value \tabularnewline
-4.22497994706475 \tabularnewline
42.122684884488 \tabularnewline
6.62221101022214 \tabularnewline
62.1135011175233 \tabularnewline
35.3344792303557 \tabularnewline
-187.189958715677 \tabularnewline
-68.9244953081601 \tabularnewline
155.150441534712 \tabularnewline
432.852822685899 \tabularnewline
580.09508616584 \tabularnewline
573.482403364729 \tabularnewline
-1249.97425631919 \tabularnewline
-66.4390256822151 \tabularnewline
331.534916605702 \tabularnewline
380.521835633251 \tabularnewline
520.105261091278 \tabularnewline
-323.966354870738 \tabularnewline
331.861092668382 \tabularnewline
-1029.07015324659 \tabularnewline
638.628474593548 \tabularnewline
-198.875368538846 \tabularnewline
900.562970959912 \tabularnewline
618.941024825617 \tabularnewline
-562.300417496 \tabularnewline
-201.726057438736 \tabularnewline
360.379151550019 \tabularnewline
-501.180081236251 \tabularnewline
-100.354586013437 \tabularnewline
266.993738481659 \tabularnewline
-286.855016605464 \tabularnewline
-786.140814603508 \tabularnewline
83.5016343629068 \tabularnewline
588.644237928867 \tabularnewline
665.290889628989 \tabularnewline
620.309939231777 \tabularnewline
1268.65037311026 \tabularnewline
-1601.62291366903 \tabularnewline
-946.612990630831 \tabularnewline
379.959649046154 \tabularnewline
-394.577830638221 \tabularnewline
289.452759058442 \tabularnewline
-286.066016416274 \tabularnewline
-413.162570536489 \tabularnewline
789.303242610849 \tabularnewline
-321.041427532147 \tabularnewline
410.687204382573 \tabularnewline
853.219574217609 \tabularnewline
-2506.99619737505 \tabularnewline
1460.19326538727 \tabularnewline
-515.069630270679 \tabularnewline
-386.47665499916 \tabularnewline
416.243402394718 \tabularnewline
-123.340547650398 \tabularnewline
241.306309506465 \tabularnewline
-348.243611263121 \tabularnewline
539.480302811459 \tabularnewline
982.719608783003 \tabularnewline
857.113110206593 \tabularnewline
-118.721706288746 \tabularnewline
-1413.7104473664 \tabularnewline
-654.922476974095 \tabularnewline
151.407723924067 \tabularnewline
-541.600453177987 \tabularnewline
193.920941932241 \tabularnewline
-204.938118665612 \tabularnewline
-588.474235872648 \tabularnewline
302.154268334862 \tabularnewline
18.6387982521249 \tabularnewline
437.853580114796 \tabularnewline
1160.37189204667 \tabularnewline
1938.7608277767 \tabularnewline
-2644.84853150836 \tabularnewline
-1408.31886089851 \tabularnewline
-983.239000830758 \tabularnewline
347.104549791956 \tabularnewline
-1134.46896590761 \tabularnewline
762.458457266409 \tabularnewline
1510.56657504315 \tabularnewline
-113.813198654519 \tabularnewline
632.085479345351 \tabularnewline
-699.271133923711 \tabularnewline
-419.192106228644 \tabularnewline
460.461117041157 \tabularnewline
761.301644854081 \tabularnewline
81.143761128398 \tabularnewline
644.993762132182 \tabularnewline
41.6821340033191 \tabularnewline
979.956129639555 \tabularnewline
-359.133223163252 \tabularnewline
-372.587879468961 \tabularnewline
-934.656859847713 \tabularnewline
276.647178993845 \tabularnewline
264.643708658612 \tabularnewline
-481.815692863818 \tabularnewline
-771.192644329648 \tabularnewline
\hline
\end{tabular}
%Source: https://freestatistics.org/blog/index.php?pk=151416&T=2

[TABLE]
[ROW][C]Estimated ARIMA Residuals[/C][/ROW]
[ROW][C]Value[/C][/ROW]
[ROW][C]-4.22497994706475[/C][/ROW]
[ROW][C]42.122684884488[/C][/ROW]
[ROW][C]6.62221101022214[/C][/ROW]
[ROW][C]62.1135011175233[/C][/ROW]
[ROW][C]35.3344792303557[/C][/ROW]
[ROW][C]-187.189958715677[/C][/ROW]
[ROW][C]-68.9244953081601[/C][/ROW]
[ROW][C]155.150441534712[/C][/ROW]
[ROW][C]432.852822685899[/C][/ROW]
[ROW][C]580.09508616584[/C][/ROW]
[ROW][C]573.482403364729[/C][/ROW]
[ROW][C]-1249.97425631919[/C][/ROW]
[ROW][C]-66.4390256822151[/C][/ROW]
[ROW][C]331.534916605702[/C][/ROW]
[ROW][C]380.521835633251[/C][/ROW]
[ROW][C]520.105261091278[/C][/ROW]
[ROW][C]-323.966354870738[/C][/ROW]
[ROW][C]331.861092668382[/C][/ROW]
[ROW][C]-1029.07015324659[/C][/ROW]
[ROW][C]638.628474593548[/C][/ROW]
[ROW][C]-198.875368538846[/C][/ROW]
[ROW][C]900.562970959912[/C][/ROW]
[ROW][C]618.941024825617[/C][/ROW]
[ROW][C]-562.300417496[/C][/ROW]
[ROW][C]-201.726057438736[/C][/ROW]
[ROW][C]360.379151550019[/C][/ROW]
[ROW][C]-501.180081236251[/C][/ROW]
[ROW][C]-100.354586013437[/C][/ROW]
[ROW][C]266.993738481659[/C][/ROW]
[ROW][C]-286.855016605464[/C][/ROW]
[ROW][C]-786.140814603508[/C][/ROW]
[ROW][C]83.5016343629068[/C][/ROW]
[ROW][C]588.644237928867[/C][/ROW]
[ROW][C]665.290889628989[/C][/ROW]
[ROW][C]620.309939231777[/C][/ROW]
[ROW][C]1268.65037311026[/C][/ROW]
[ROW][C]-1601.62291366903[/C][/ROW]
[ROW][C]-946.612990630831[/C][/ROW]
[ROW][C]379.959649046154[/C][/ROW]
[ROW][C]-394.577830638221[/C][/ROW]
[ROW][C]289.452759058442[/C][/ROW]
[ROW][C]-286.066016416274[/C][/ROW]
[ROW][C]-413.162570536489[/C][/ROW]
[ROW][C]789.303242610849[/C][/ROW]
[ROW][C]-321.041427532147[/C][/ROW]
[ROW][C]410.687204382573[/C][/ROW]
[ROW][C]853.219574217609[/C][/ROW]
[ROW][C]-2506.99619737505[/C][/ROW]
[ROW][C]1460.19326538727[/C][/ROW]
[ROW][C]-515.069630270679[/C][/ROW]
[ROW][C]-386.47665499916[/C][/ROW]
[ROW][C]416.243402394718[/C][/ROW]
[ROW][C]-123.340547650398[/C][/ROW]
[ROW][C]241.306309506465[/C][/ROW]
[ROW][C]-348.243611263121[/C][/ROW]
[ROW][C]539.480302811459[/C][/ROW]
[ROW][C]982.719608783003[/C][/ROW]
[ROW][C]857.113110206593[/C][/ROW]
[ROW][C]-118.721706288746[/C][/ROW]
[ROW][C]-1413.7104473664[/C][/ROW]
[ROW][C]-654.922476974095[/C][/ROW]
[ROW][C]151.407723924067[/C][/ROW]
[ROW][C]-541.600453177987[/C][/ROW]
[ROW][C]193.920941932241[/C][/ROW]
[ROW][C]-204.938118665612[/C][/ROW]
[ROW][C]-588.474235872648[/C][/ROW]
[ROW][C]302.154268334862[/C][/ROW]
[ROW][C]18.6387982521249[/C][/ROW]
[ROW][C]437.853580114796[/C][/ROW]
[ROW][C]1160.37189204667[/C][/ROW]
[ROW][C]1938.7608277767[/C][/ROW]
[ROW][C]-2644.84853150836[/C][/ROW]
[ROW][C]-1408.31886089851[/C][/ROW]
[ROW][C]-983.239000830758[/C][/ROW]
[ROW][C]347.104549791956[/C][/ROW]
[ROW][C]-1134.46896590761[/C][/ROW]
[ROW][C]762.458457266409[/C][/ROW]
[ROW][C]1510.56657504315[/C][/ROW]
[ROW][C]-113.813198654519[/C][/ROW]
[ROW][C]632.085479345351[/C][/ROW]
[ROW][C]-699.271133923711[/C][/ROW]
[ROW][C]-419.192106228644[/C][/ROW]
[ROW][C]460.461117041157[/C][/ROW]
[ROW][C]761.301644854081[/C][/ROW]
[ROW][C]81.143761128398[/C][/ROW]
[ROW][C]644.993762132182[/C][/ROW]
[ROW][C]41.6821340033191[/C][/ROW]
[ROW][C]979.956129639555[/C][/ROW]
[ROW][C]-359.133223163252[/C][/ROW]
[ROW][C]-372.587879468961[/C][/ROW]
[ROW][C]-934.656859847713[/C][/ROW]
[ROW][C]276.647178993845[/C][/ROW]
[ROW][C]264.643708658612[/C][/ROW]
[ROW][C]-481.815692863818[/C][/ROW]
[ROW][C]-771.192644329648[/C][/ROW]
[/TABLE]
Source: https://freestatistics.org/blog/index.php?pk=151416&T=2

Globally Unique Identifier (entire table): ba.freestatistics.org/blog/index.php?pk=151416&T=2

As an alternative you can also use a QR Code:  

The GUIDs for individual cells are displayed in the table below:

Estimated ARIMA Residuals
Value
-4.22497994706475
42.122684884488
6.62221101022214
62.1135011175233
35.3344792303557
-187.189958715677
-68.9244953081601
155.150441534712
432.852822685899
580.09508616584
573.482403364729
-1249.97425631919
-66.4390256822151
331.534916605702
380.521835633251
520.105261091278
-323.966354870738
331.861092668382
-1029.07015324659
638.628474593548
-198.875368538846
900.562970959912
618.941024825617
-562.300417496
-201.726057438736
360.379151550019
-501.180081236251
-100.354586013437
266.993738481659
-286.855016605464
-786.140814603508
83.5016343629068
588.644237928867
665.290889628989
620.309939231777
1268.65037311026
-1601.62291366903
-946.612990630831
379.959649046154
-394.577830638221
289.452759058442
-286.066016416274
-413.162570536489
789.303242610849
-321.041427532147
410.687204382573
853.219574217609
-2506.99619737505
1460.19326538727
-515.069630270679
-386.47665499916
416.243402394718
-123.340547650398
241.306309506465
-348.243611263121
539.480302811459
982.719608783003
857.113110206593
-118.721706288746
-1413.7104473664
-654.922476974095
151.407723924067
-541.600453177987
193.920941932241
-204.938118665612
-588.474235872648
302.154268334862
18.6387982521249
437.853580114796
1160.37189204667
1938.7608277767
-2644.84853150836
-1408.31886089851
-983.239000830758
347.104549791956
-1134.46896590761
762.458457266409
1510.56657504315
-113.813198654519
632.085479345351
-699.271133923711
-419.192106228644
460.461117041157
761.301644854081
81.143761128398
644.993762132182
41.6821340033191
979.956129639555
-359.133223163252
-372.587879468961
-934.656859847713
276.647178993845
264.643708658612
-481.815692863818
-771.192644329648


Parameters (Session):
par1 = FALSE ; par2 = 1 ; par3 = 2 ; par4 = 0 ; par5 = 12 ; par6 = 3 ; par7 = 1 ; par8 = 2 ; par9 = 1 ;
Parameters (R input):
par1 = FALSE ; par2 = 1 ; par3 = 2 ; par4 = 0 ; par5 = 12 ; par6 = 3 ; par7 = 1 ; par8 = 2 ; par9 = 1 ;
R code (references can be found in the software module):
library(lattice)
if (par1 == 'TRUE') par1 <- TRUE
if (par1 == 'FALSE') par1 <- FALSE
par2 <- as.numeric(par2) #Box-Cox lambda transformation parameter
par3 <- as.numeric(par3) #degree of non-seasonal differencing
par4 <- as.numeric(par4) #degree of seasonal differencing
par5 <- as.numeric(par5) #seasonal period
par6 <- as.numeric(par6) #degree (p) of the non-seasonal AR(p) polynomial
par7 <- as.numeric(par7) #degree (q) of the non-seasonal MA(q) polynomial
par8 <- as.numeric(par8) #degree (P) of the seasonal AR(P) polynomial
par9 <- as.numeric(par9) #degree (Q) of the seasonal MA(Q) polynomial
armaGR <- function(arima.out, names, n){
try1 <- arima.out$coef
try2 <- sqrt(diag(arima.out$var.coef))
try.data.frame <- data.frame(matrix(NA,ncol=4,nrow=length(names)))
dimnames(try.data.frame) <- list(names,c('coef','std','tstat','pv'))
try.data.frame[,1] <- try1
for(i in 1:length(try2)) try.data.frame[which(rownames(try.data.frame)==names(try2)[i]),2] <- try2[i]
try.data.frame[,3] <- try.data.frame[,1] / try.data.frame[,2]
try.data.frame[,4] <- round((1-pt(abs(try.data.frame[,3]),df=n-(length(try2)+1)))*2,5)
vector <- rep(NA,length(names))
vector[is.na(try.data.frame[,4])] <- 0
maxi <- which.max(try.data.frame[,4])
continue <- max(try.data.frame[,4],na.rm=TRUE) > .05
vector[maxi] <- 0
list(summary=try.data.frame,next.vector=vector,continue=continue)
}
arimaSelect <- function(series, order=c(13,0,0), seasonal=list(order=c(2,0,0),period=12), include.mean=F){
nrc <- order[1]+order[3]+seasonal$order[1]+seasonal$order[3]
coeff <- matrix(NA, nrow=nrc*2, ncol=nrc)
pval <- matrix(NA, nrow=nrc*2, ncol=nrc)
mylist <- rep(list(NULL), nrc)
names <- NULL
if(order[1] > 0) names <- paste('ar',1:order[1],sep='')
if(order[3] > 0) names <- c( names , paste('ma',1:order[3],sep='') )
if(seasonal$order[1] > 0) names <- c(names, paste('sar',1:seasonal$order[1],sep=''))
if(seasonal$order[3] > 0) names <- c(names, paste('sma',1:seasonal$order[3],sep=''))
arima.out <- arima(series, order=order, seasonal=seasonal, include.mean=include.mean, method='ML')
mylist[[1]] <- arima.out
last.arma <- armaGR(arima.out, names, length(series))
mystop <- FALSE
i <- 1
coeff[i,] <- last.arma[[1]][,1]
pval [i,] <- last.arma[[1]][,4]
i <- 2
aic <- arima.out$aic
while(!mystop){
mylist[[i]] <- arima.out
arima.out <- arima(series, order=order, seasonal=seasonal, include.mean=include.mean, method='ML', fixed=last.arma$next.vector)
aic <- c(aic, arima.out$aic)
last.arma <- armaGR(arima.out, names, length(series))
mystop <- !last.arma$continue
coeff[i,] <- last.arma[[1]][,1]
pval [i,] <- last.arma[[1]][,4]
i <- i+1
}
list(coeff, pval, mylist, aic=aic)
}
arimaSelectplot <- function(arimaSelect.out,noms,choix){
noms <- names(arimaSelect.out[[3]][[1]]$coef)
coeff <- arimaSelect.out[[1]]
k <- min(which(is.na(coeff[,1])))-1
coeff <- coeff[1:k,]
pval <- arimaSelect.out[[2]][1:k,]
aic <- arimaSelect.out$aic[1:k]
coeff[coeff==0] <- NA
n <- ncol(coeff)
if(missing(choix)) choix <- k
layout(matrix(c(1,1,1,2,
3,3,3,2,
3,3,3,4,
5,6,7,7),nr=4),
widths=c(10,35,45,15),
heights=c(30,30,15,15))
couleurs <- rainbow(75)[1:50]#(50)
ticks <- pretty(coeff)
par(mar=c(1,1,3,1))
plot(aic,k:1-.5,type='o',pch=21,bg='blue',cex=2,axes=F,lty=2,xpd=NA)
points(aic[choix],k-choix+.5,pch=21,cex=4,bg=2,xpd=NA)
title('aic',line=2)
par(mar=c(3,0,0,0))
plot(0,axes=F,xlab='',ylab='',xlim=range(ticks),ylim=c(.1,1))
rect(xleft = min(ticks) + (0:49)/50*(max(ticks)-min(ticks)),
xright = min(ticks) + (1:50)/50*(max(ticks)-min(ticks)),
ytop = rep(1,50),
ybottom= rep(0,50),col=couleurs,border=NA)
axis(1,ticks)
rect(xleft=min(ticks),xright=max(ticks),ytop=1,ybottom=0)
text(mean(coeff,na.rm=T),.5,'coefficients',cex=2,font=2)
par(mar=c(1,1,3,1))
image(1:n,1:k,t(coeff[k:1,]),axes=F,col=couleurs,zlim=range(ticks))
for(i in 1:n) for(j in 1:k) if(!is.na(coeff[j,i])) {
if(pval[j,i]<.01) symb = 'green'
else if( (pval[j,i]<.05) & (pval[j,i]>=.01)) symb = 'orange'
else if( (pval[j,i]<.1) & (pval[j,i]>=.05)) symb = 'red'
else symb = 'black'
polygon(c(i+.5 ,i+.2 ,i+.5 ,i+.5),
c(k-j+0.5,k-j+0.5,k-j+0.8,k-j+0.5),
col=symb)
if(j==choix) {
rect(xleft=i-.5,
xright=i+.5,
ybottom=k-j+1.5,
ytop=k-j+.5,
lwd=4)
text(i,
k-j+1,
round(coeff[j,i],2),
cex=1.2,
font=2)
}
else{
rect(xleft=i-.5,xright=i+.5,ybottom=k-j+1.5,ytop=k-j+.5)
text(i,k-j+1,round(coeff[j,i],2),cex=1.2,font=1)
}
}
axis(3,1:n,noms)
par(mar=c(0.5,0,0,0.5))
plot(0,axes=F,xlab='',ylab='',type='n',xlim=c(0,8),ylim=c(-.2,.8))
cols <- c('green','orange','red','black')
niv <- c('0','0.01','0.05','0.1')
for(i in 0:3){
polygon(c(1+2*i ,1+2*i ,1+2*i-.5 ,1+2*i),
c(.4 ,.7 , .4 , .4),
col=cols[i+1])
text(2*i,0.5,niv[i+1],cex=1.5)
}
text(8,.5,1,cex=1.5)
text(4,0,'p-value',cex=2)
box()
residus <- arimaSelect.out[[3]][[choix]]$res
par(mar=c(1,2,4,1))
acf(residus,main='')
title('acf',line=.5)
par(mar=c(1,2,4,1))
pacf(residus,main='')
title('pacf',line=.5)
par(mar=c(2,2,4,1))
qqnorm(residus,main='')
title('qq-norm',line=.5)
qqline(residus)
residus
}
if (par2 == 0) x <- log(x)
if (par2 != 0) x <- x^par2
(selection <- arimaSelect(x, order=c(par6,par3,par7), seasonal=list(order=c(par8,par4,par9), period=par5)))
bitmap(file='test1.png')
resid <- arimaSelectplot(selection)
dev.off()
resid
bitmap(file='test2.png')
acf(resid,length(resid)/2, main='Residual Autocorrelation Function')
dev.off()
bitmap(file='test3.png')
pacf(resid,length(resid)/2, main='Residual Partial Autocorrelation Function')
dev.off()
bitmap(file='test4.png')
cpgram(resid, main='Residual Cumulative Periodogram')
dev.off()
bitmap(file='test5.png')
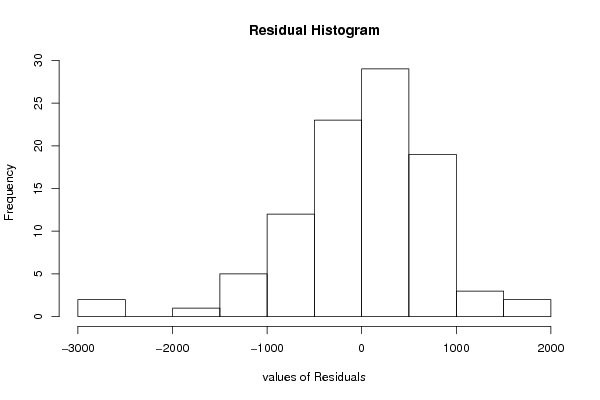
hist(resid, main='Residual Histogram', xlab='values of Residuals')
dev.off()
bitmap(file='test6.png')
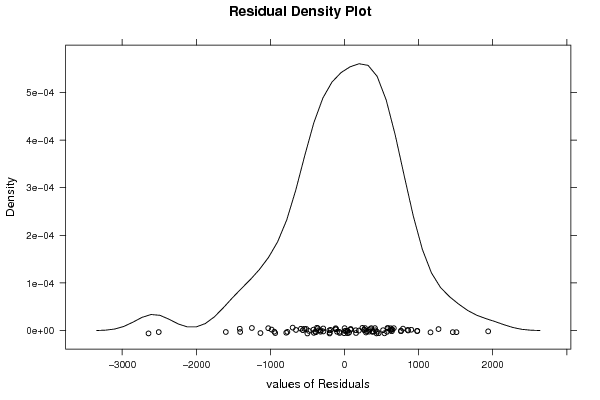
densityplot(~resid,col='black',main='Residual Density Plot', xlab='values of Residuals')
dev.off()
bitmap(file='test7.png')
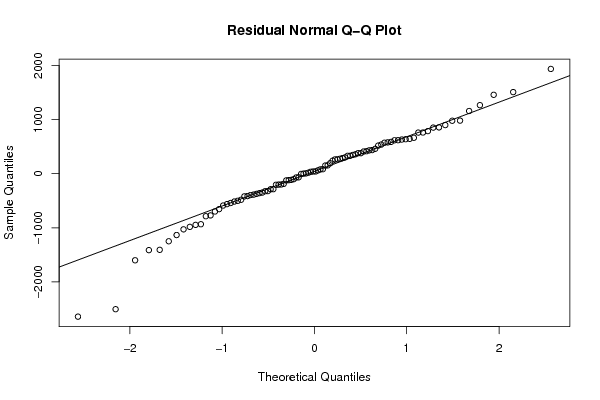
qqnorm(resid, main='Residual Normal Q-Q Plot')
qqline(resid)
dev.off()
ncols <- length(selection[[1]][1,])
nrows <- length(selection[[2]][,1])-1
load(file='createtable')
a<-table.start()
a<-table.row.start(a)
a<-table.element(a,'ARIMA Parameter Estimation and Backward Selection', ncols+1,TRUE)
a<-table.row.end(a)
a<-table.row.start(a)
a<-table.element(a,'Iteration', header=TRUE)
for (i in 1:ncols) {
a<-table.element(a,names(selection[[3]][[1]]$coef)[i],header=TRUE)
}
a<-table.row.end(a)
for (j in 1:nrows) {
a<-table.row.start(a)
mydum <- 'Estimates ('
mydum <- paste(mydum,j)
mydum <- paste(mydum,')')
a<-table.element(a,mydum, header=TRUE)
for (i in 1:ncols) {
a<-table.element(a,round(selection[[1]][j,i],4))
}
a<-table.row.end(a)
a<-table.row.start(a)
a<-table.element(a,'(p-val)', header=TRUE)
for (i in 1:ncols) {
mydum <- '('
mydum <- paste(mydum,round(selection[[2]][j,i],4),sep='')
mydum <- paste(mydum,')')
a<-table.element(a,mydum)
}
a<-table.row.end(a)
}
a<-table.end(a)
table.save(a,file='mytable.tab')
a<-table.start()
a<-table.row.start(a)
a<-table.element(a,'Estimated ARIMA Residuals', 1,TRUE)
a<-table.row.end(a)
a<-table.row.start(a)
a<-table.element(a,'Value', 1,TRUE)
a<-table.row.end(a)
for (i in (par4*par5+par3):length(resid)) {
a<-table.row.start(a)
a<-table.element(a,resid[i])
a<-table.row.end(a)
}
a<-table.end(a)
table.save(a,file='mytable1.tab')