Free Statistics
of Irreproducible Research!
Description of Statistical Computation | |||||||||||||||||||||||||||||||||||||
|---|---|---|---|---|---|---|---|---|---|---|---|---|---|---|---|---|---|---|---|---|---|---|---|---|---|---|---|---|---|---|---|---|---|---|---|---|---|
| Author's title | |||||||||||||||||||||||||||||||||||||
| Author | *The author of this computation has been verified* | ||||||||||||||||||||||||||||||||||||
| R Software Module | rwasp_spearman.wasp | ||||||||||||||||||||||||||||||||||||
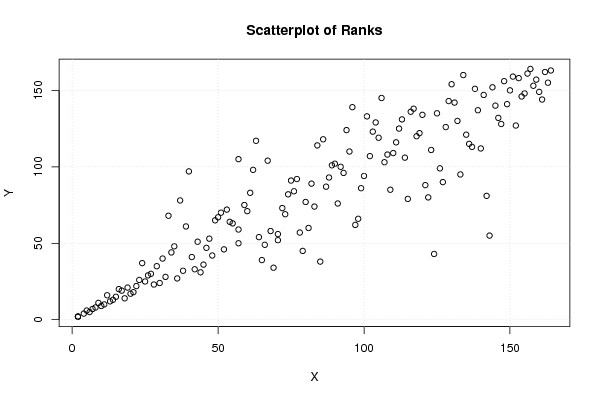
| Title produced by software | Spearman Rank Correlation | ||||||||||||||||||||||||||||||||||||
| Date of computation | Mon, 05 Dec 2011 18:09:54 -0500 | ||||||||||||||||||||||||||||||||||||
| Cite this page as follows | Statistical Computations at FreeStatistics.org, Office for Research Development and Education, URL https://freestatistics.org/blog/index.php?v=date/2011/Dec/05/t13231266112kh7yrpfk3bwf39.htm/, Retrieved Fri, 03 May 2024 09:39:13 +0000 | ||||||||||||||||||||||||||||||||||||
| Statistical Computations at FreeStatistics.org, Office for Research Development and Education, URL https://freestatistics.org/blog/index.php?pk=151328, Retrieved Fri, 03 May 2024 09:39:13 +0000 | |||||||||||||||||||||||||||||||||||||
| QR Codes: | |||||||||||||||||||||||||||||||||||||
|
| |||||||||||||||||||||||||||||||||||||
| Original text written by user: | |||||||||||||||||||||||||||||||||||||
| IsPrivate? | No (this computation is public) | ||||||||||||||||||||||||||||||||||||
| User-defined keywords | |||||||||||||||||||||||||||||||||||||
| Estimated Impact | 114 | ||||||||||||||||||||||||||||||||||||
Tree of Dependent Computations | |||||||||||||||||||||||||||||||||||||
| Family? (F = Feedback message, R = changed R code, M = changed R Module, P = changed Parameters, D = changed Data) | |||||||||||||||||||||||||||||||||||||
| - [Univariate Data Series] [web traffic] [2010-10-19 15:13:07] [b98453cac15ba1066b407e146608df68] - RMP [Variance Reduction Matrix] [Traffic] [2010-11-29 09:57:15] [b98453cac15ba1066b407e146608df68] - RMP [ARIMA Backward Selection] [Traffic] [2010-11-29 20:05:46] [b98453cac15ba1066b407e146608df68] - PD [ARIMA Backward Selection] [] [2011-12-05 15:44:21] [d623f9be707a26b8ffaece1fc4d5a7ee] - RMPD [Spearman Rank Correlation] [] [2011-12-05 23:09:54] [4cf172296f32adf71d8383c359dbb80f] [Current] | |||||||||||||||||||||||||||||||||||||
| Feedback Forum | |||||||||||||||||||||||||||||||||||||
Post a new message | |||||||||||||||||||||||||||||||||||||
Dataset | |||||||||||||||||||||||||||||||||||||
| Dataseries X: | |||||||||||||||||||||||||||||||||||||
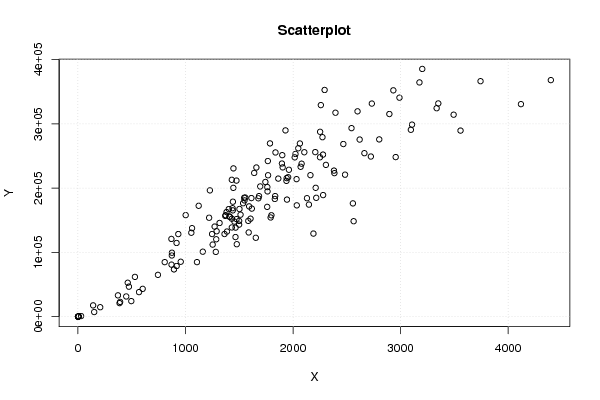
1431 869 1536 2216 933 463 3202 372 1584 1440 1837 1549 1431 2274 1556 4120 1766 2251 1061 1955 2080 2294 1220 1290 2557 2148 2381 1639 1247 1897 1768 1592 1786 807 2600 1941 2733 1502 917 2620 2802 1413 1408 1363 2190 4398 918 1831 3558 1792 1438 496 2259 744 1161 2385 2207 2955 2064 1863 3336 2664 2130 2033 1227 1441 1499 2280 1834 1286 1944 893 1763 1403 1455 1930 1900 1546 1466 1431 1465 3176 1317 1761 870 1654 1054 3107 2105 2564 1939 1684 1499 2484 2016 1382 1445 1659 3096 2896 2071 1904 1475 602 1799 1617 2162 2279 874 1282 1446 2049 392 1605 530 1386 2395 387 1743 449 2724 1613 1271 1253 568 1512 2252 1123 2990 2023 2933 1002 956 2306 3744 1107 3351 1588 1474 1760 1374 3494 1695 2035 2468 1477 2211 1962 2 207 5 8 0 0 1678 2544 0 4 151 474 141 873 29 1370 | |||||||||||||||||||||||||||||||||||||
| Dataseries Y: | |||||||||||||||||||||||||||||||||||||
213008 120982 176537 184969 128552 52746 385534 33170 149061 165446 255558 180915 138816 279314 185362 330754 242201 248074 137731 217015 238060 352819 153935 132943 176297 174415 227308 223632 128603 238315 220067 171645 269655 84853 319589 215641 331650 167548 114673 275650 275861 155363 155774 128649 129301 368166 78800 183167 289575 154368 168809 24188 329267 65029 101097 223355 256087 248342 269536 214872 324427 254411 184360 214011 196553 178886 143250 189237 187681 120478 182192 73566 194979 167488 147958 289924 251351 185082 138570 152450 123905 364565 145790 201714 80953 122774 130585 298851 255899 148553 211322 187632 149018 220959 247964 162765 200476 232138 290838 315389 233269 232317 151811 43287 157799 168180 220195 252225 99466 100750 230772 262070 22938 152474 61857 132487 317394 21054 209641 31414 249237 184528 140189 112178 38214 158671 287703 172558 340803 253210 352257 158015 85439 236202 366492 84925 331866 131069 211775 170863 157949 314332 202656 173260 268676 112739 200511 228606 1 14688 98 455 0 0 184207 293412 0 203 7199 46660 17547 95227 969 156828 | |||||||||||||||||||||||||||||||||||||
Tables (Output of Computation) | |||||||||||||||||||||||||||||||||||||
| |||||||||||||||||||||||||||||||||||||
Figures (Output of Computation) | |||||||||||||||||||||||||||||||||||||
Input Parameters & R Code | |||||||||||||||||||||||||||||||||||||
| Parameters (Session): | |||||||||||||||||||||||||||||||||||||
| par1 = 1 ; par2 = 1 ; par3 = 2 ; par4 = 1 ; | |||||||||||||||||||||||||||||||||||||
| Parameters (R input): | |||||||||||||||||||||||||||||||||||||
| R code (references can be found in the software module): | |||||||||||||||||||||||||||||||||||||
k <- cor.test(x,y,method='spearman') | |||||||||||||||||||||||||||||||||||||