Free Statistics

of Irreproducible Research!

Author's title

Author*The author of this computation has been verified*
R Software Modulerwasp_arimabackwardselection.wasp
Title produced by softwareARIMA Backward Selection
Date of computationMon, 05 Dec 2011 11:23:38 -0500
Cite this page as followsStatistical Computations at FreeStatistics.org, Office for Research Development and Education, URL https://freestatistics.org/blog/index.php?v=date/2011/Dec/05/t1323102251it155s2wdyhqlfe.htm/, Retrieved Fri, 03 May 2024 09:42:21 +0000
Statistical Computations at FreeStatistics.org, Office for Research Development and Education, URL https://freestatistics.org/blog/index.php?pk=151041, Retrieved Fri, 03 May 2024 09:42:21 +0000
QR Codes:

Original text written by user:
IsPrivate?No (this computation is public)
User-defined keywords
Estimated Impact98
Family? (F = Feedback message, R = changed R code, M = changed R Module, P = changed Parameters, D = changed Data)
-     [ARIMA Backward Selection] [WS 9 ARIMA] [2011-12-04 14:49:10] [abc1cbe561c2c4615f632bb3153b1275]
- R P     [ARIMA Backward Selection] [Arima forcasting ...] [2011-12-05 16:23:38] [080b56dea5ee02335c893a05354948d0] [Current]
Feedback Forum

Post a new message
Dataseries X:
22782
19169
13807
29743
25591
29096
26482
22405
27044
17970
18730
19684
19785
18479
10698
31956
29506
34506
27165
26736
23691
18157
17328
18205
20995
17382
9367
31124
26551
30651
25859
25100
25778
20418
18688
20424
24776
19814
12738
31566
30111
30019
31934
25826
26835
20205
17789
20520
22518
15572
11509
25447
24090
27786
26195
20516
22759
19028
16971
20036
22485
18730
14538
27561
25985
34670
32066
27186
29586
21359
21553
19573
24256
22380
16167
27297
28287
33474
28229
28785
25597
18130
20198
22849
23118


Summary of computational transaction
Raw Inputview raw input (R code)
Raw Outputview raw output of R engine
Computing time4 seconds
R Server'Herman Ole Andreas Wold' @ wold.wessa.net

\begin{tabular}{lllllllll}
\hline
Summary of computational transaction \tabularnewline
Raw Input & view raw input (R code)  \tabularnewline
Raw Output & view raw output of R engine  \tabularnewline
Computing time & 4 seconds \tabularnewline
R Server & 'Herman Ole Andreas Wold' @ wold.wessa.net \tabularnewline
\hline
\end{tabular}
%Source: https://freestatistics.org/blog/index.php?pk=151041&T=0

[TABLE]
[ROW][C]Summary of computational transaction[/C][/ROW]
[ROW][C]Raw Input[/C][C]view raw input (R code) [/C][/ROW]
[ROW][C]Raw Output[/C][C]view raw output of R engine [/C][/ROW]
[ROW][C]Computing time[/C][C]4 seconds[/C][/ROW]
[ROW][C]R Server[/C][C]'Herman Ole Andreas Wold' @ wold.wessa.net[/C][/ROW]
[/TABLE]
Source: https://freestatistics.org/blog/index.php?pk=151041&T=0

Globally Unique Identifier (entire table): ba.freestatistics.org/blog/index.php?pk=151041&T=0

As an alternative you can also use a QR Code:  

The GUIDs for individual cells are displayed in the table below:

Summary of computational transaction
Raw Inputview raw input (R code)
Raw Outputview raw output of R engine
Computing time4 seconds
R Server'Herman Ole Andreas Wold' @ wold.wessa.net


ARIMA Parameter Estimation and Backward Selection
Iterationma1sar1sar2sma1
Estimates ( 1 )-0.58090.24150.0147-0.9999
(p-val)(0 )(0.1398 )(0.9387 )(0.0029 )
Estimates ( 2 )-0.57720.24220-1
(p-val)(0 )(0.1375 )(NA )(0.0042 )
Estimates ( 3 )-0.622100-0.6989
(p-val)(0 )(NA )(NA )(3e-04 )
Estimates ( 4 )NANANANA
(p-val)(NA )(NA )(NA )(NA )
Estimates ( 5 )NANANANA
(p-val)(NA )(NA )(NA )(NA )
Estimates ( 6 )NANANANA
(p-val)(NA )(NA )(NA )(NA )
Estimates ( 7 )NANANANA
(p-val)(NA )(NA )(NA )(NA )

\begin{tabular}{lllllllll}
\hline
ARIMA Parameter Estimation and Backward Selection \tabularnewline
Iteration & ma1 & sar1 & sar2 & sma1 \tabularnewline
Estimates ( 1 ) & -0.5809 & 0.2415 & 0.0147 & -0.9999 \tabularnewline
(p-val) & (0 ) & (0.1398 ) & (0.9387 ) & (0.0029 ) \tabularnewline
Estimates ( 2 ) & -0.5772 & 0.2422 & 0 & -1 \tabularnewline
(p-val) & (0 ) & (0.1375 ) & (NA ) & (0.0042 ) \tabularnewline
Estimates ( 3 ) & -0.6221 & 0 & 0 & -0.6989 \tabularnewline
(p-val) & (0 ) & (NA ) & (NA ) & (3e-04 ) \tabularnewline
Estimates ( 4 ) & NA & NA & NA & NA \tabularnewline
(p-val) & (NA ) & (NA ) & (NA ) & (NA ) \tabularnewline
Estimates ( 5 ) & NA & NA & NA & NA \tabularnewline
(p-val) & (NA ) & (NA ) & (NA ) & (NA ) \tabularnewline
Estimates ( 6 ) & NA & NA & NA & NA \tabularnewline
(p-val) & (NA ) & (NA ) & (NA ) & (NA ) \tabularnewline
Estimates ( 7 ) & NA & NA & NA & NA \tabularnewline
(p-val) & (NA ) & (NA ) & (NA ) & (NA ) \tabularnewline
\hline
\end{tabular}
%Source: https://freestatistics.org/blog/index.php?pk=151041&T=1

[TABLE]
[ROW][C]ARIMA Parameter Estimation and Backward Selection[/C][/ROW]
[ROW][C]Iteration[/C][C]ma1[/C][C]sar1[/C][C]sar2[/C][C]sma1[/C][/ROW]
[ROW][C]Estimates ( 1 )[/C][C]-0.5809[/C][C]0.2415[/C][C]0.0147[/C][C]-0.9999[/C][/ROW]
[ROW][C](p-val)[/C][C](0 )[/C][C](0.1398 )[/C][C](0.9387 )[/C][C](0.0029 )[/C][/ROW]
[ROW][C]Estimates ( 2 )[/C][C]-0.5772[/C][C]0.2422[/C][C]0[/C][C]-1[/C][/ROW]
[ROW][C](p-val)[/C][C](0 )[/C][C](0.1375 )[/C][C](NA )[/C][C](0.0042 )[/C][/ROW]
[ROW][C]Estimates ( 3 )[/C][C]-0.6221[/C][C]0[/C][C]0[/C][C]-0.6989[/C][/ROW]
[ROW][C](p-val)[/C][C](0 )[/C][C](NA )[/C][C](NA )[/C][C](3e-04 )[/C][/ROW]
[ROW][C]Estimates ( 4 )[/C][C]NA[/C][C]NA[/C][C]NA[/C][C]NA[/C][/ROW]
[ROW][C](p-val)[/C][C](NA )[/C][C](NA )[/C][C](NA )[/C][C](NA )[/C][/ROW]
[ROW][C]Estimates ( 5 )[/C][C]NA[/C][C]NA[/C][C]NA[/C][C]NA[/C][/ROW]
[ROW][C](p-val)[/C][C](NA )[/C][C](NA )[/C][C](NA )[/C][C](NA )[/C][/ROW]
[ROW][C]Estimates ( 6 )[/C][C]NA[/C][C]NA[/C][C]NA[/C][C]NA[/C][/ROW]
[ROW][C](p-val)[/C][C](NA )[/C][C](NA )[/C][C](NA )[/C][C](NA )[/C][/ROW]
[ROW][C]Estimates ( 7 )[/C][C]NA[/C][C]NA[/C][C]NA[/C][C]NA[/C][/ROW]
[ROW][C](p-val)[/C][C](NA )[/C][C](NA )[/C][C](NA )[/C][C](NA )[/C][/ROW]
[/TABLE]
Source: https://freestatistics.org/blog/index.php?pk=151041&T=1

Globally Unique Identifier (entire table): ba.freestatistics.org/blog/index.php?pk=151041&T=1

As an alternative you can also use a QR Code:  

The GUIDs for individual cells are displayed in the table below:

ARIMA Parameter Estimation and Backward Selection
Iterationma1sar1sar2sma1
Estimates ( 1 )-0.58090.24150.0147-0.9999
(p-val)(0 )(0.1398 )(0.9387 )(0.0029 )
Estimates ( 2 )-0.57720.24220-1
(p-val)(0 )(0.1375 )(NA )(0.0042 )
Estimates ( 3 )-0.622100-0.6989
(p-val)(0 )(NA )(NA )(3e-04 )
Estimates ( 4 )NANANANA
(p-val)(NA )(NA )(NA )(NA )
Estimates ( 5 )NANANANA
(p-val)(NA )(NA )(NA )(NA )
Estimates ( 6 )NANANANA
(p-val)(NA )(NA )(NA )(NA )
Estimates ( 7 )NANANANA
(p-val)(NA )(NA )(NA )(NA )


Estimated ARIMA Residuals
Value
-89.954096635942
1574.41948657038
-1075.48394933914
3552.57031425533
3352.06241528253
3100.61110454662
-1937.27375477256
1757.0142779482
-5041.43393114634
-119.80935751688
-1321.4227432049
-823.371918710237
1175.80796729649
-567.329251706807
-1294.86225230953
1396.38071505967
-453.948947987175
-545.77279124778
330.431411163518
1086.75277538108
1318.2124612498
2051.23397052389
-96.1184283282755
651.172780754227
2344.93796249463
-299.820854664144
-28.6751991707105
-1100.8980468873
1632.19793601796
-2791.88963123518
4268.89967376914
-1527.03576239492
-865.544793370187
-688.392626450932
-1777.07484844194
204.320483744251
-788.641343328956
-3235.72626495182
782.095613345828
-4210.75348985413
-1203.11127701836
662.618494044215
453.03034548919
-1380.42990557222
262.483451618172
2908.14047032861
1046.36715001535
1676.38644990715
1230.89705437512
1735.7926496287
2411.98374781701
-2259.03561582991
-502.502547890093
4596.5067569321
2560.75343232927
746.064344415845
1185.28411323632
-1802.12782290615
425.889961320956
-3581.73327592328
86.0875523231606
1968.31482781639
494.840272408994
-4407.89715380228
586.140717020663
149.489921175969
-2226.11068330811
2973.6054367918
-2880.12259876797
-2074.86841815272
1300.83981595441
2918.44220595154
-1093.84418138027

\begin{tabular}{lllllllll}
\hline
Estimated ARIMA Residuals \tabularnewline
Value \tabularnewline
-89.954096635942 \tabularnewline
1574.41948657038 \tabularnewline
-1075.48394933914 \tabularnewline
3552.57031425533 \tabularnewline
3352.06241528253 \tabularnewline
3100.61110454662 \tabularnewline
-1937.27375477256 \tabularnewline
1757.0142779482 \tabularnewline
-5041.43393114634 \tabularnewline
-119.80935751688 \tabularnewline
-1321.4227432049 \tabularnewline
-823.371918710237 \tabularnewline
1175.80796729649 \tabularnewline
-567.329251706807 \tabularnewline
-1294.86225230953 \tabularnewline
1396.38071505967 \tabularnewline
-453.948947987175 \tabularnewline
-545.77279124778 \tabularnewline
330.431411163518 \tabularnewline
1086.75277538108 \tabularnewline
1318.2124612498 \tabularnewline
2051.23397052389 \tabularnewline
-96.1184283282755 \tabularnewline
651.172780754227 \tabularnewline
2344.93796249463 \tabularnewline
-299.820854664144 \tabularnewline
-28.6751991707105 \tabularnewline
-1100.8980468873 \tabularnewline
1632.19793601796 \tabularnewline
-2791.88963123518 \tabularnewline
4268.89967376914 \tabularnewline
-1527.03576239492 \tabularnewline
-865.544793370187 \tabularnewline
-688.392626450932 \tabularnewline
-1777.07484844194 \tabularnewline
204.320483744251 \tabularnewline
-788.641343328956 \tabularnewline
-3235.72626495182 \tabularnewline
782.095613345828 \tabularnewline
-4210.75348985413 \tabularnewline
-1203.11127701836 \tabularnewline
662.618494044215 \tabularnewline
453.03034548919 \tabularnewline
-1380.42990557222 \tabularnewline
262.483451618172 \tabularnewline
2908.14047032861 \tabularnewline
1046.36715001535 \tabularnewline
1676.38644990715 \tabularnewline
1230.89705437512 \tabularnewline
1735.7926496287 \tabularnewline
2411.98374781701 \tabularnewline
-2259.03561582991 \tabularnewline
-502.502547890093 \tabularnewline
4596.5067569321 \tabularnewline
2560.75343232927 \tabularnewline
746.064344415845 \tabularnewline
1185.28411323632 \tabularnewline
-1802.12782290615 \tabularnewline
425.889961320956 \tabularnewline
-3581.73327592328 \tabularnewline
86.0875523231606 \tabularnewline
1968.31482781639 \tabularnewline
494.840272408994 \tabularnewline
-4407.89715380228 \tabularnewline
586.140717020663 \tabularnewline
149.489921175969 \tabularnewline
-2226.11068330811 \tabularnewline
2973.6054367918 \tabularnewline
-2880.12259876797 \tabularnewline
-2074.86841815272 \tabularnewline
1300.83981595441 \tabularnewline
2918.44220595154 \tabularnewline
-1093.84418138027 \tabularnewline
\hline
\end{tabular}
%Source: https://freestatistics.org/blog/index.php?pk=151041&T=2

[TABLE]
[ROW][C]Estimated ARIMA Residuals[/C][/ROW]
[ROW][C]Value[/C][/ROW]
[ROW][C]-89.954096635942[/C][/ROW]
[ROW][C]1574.41948657038[/C][/ROW]
[ROW][C]-1075.48394933914[/C][/ROW]
[ROW][C]3552.57031425533[/C][/ROW]
[ROW][C]3352.06241528253[/C][/ROW]
[ROW][C]3100.61110454662[/C][/ROW]
[ROW][C]-1937.27375477256[/C][/ROW]
[ROW][C]1757.0142779482[/C][/ROW]
[ROW][C]-5041.43393114634[/C][/ROW]
[ROW][C]-119.80935751688[/C][/ROW]
[ROW][C]-1321.4227432049[/C][/ROW]
[ROW][C]-823.371918710237[/C][/ROW]
[ROW][C]1175.80796729649[/C][/ROW]
[ROW][C]-567.329251706807[/C][/ROW]
[ROW][C]-1294.86225230953[/C][/ROW]
[ROW][C]1396.38071505967[/C][/ROW]
[ROW][C]-453.948947987175[/C][/ROW]
[ROW][C]-545.77279124778[/C][/ROW]
[ROW][C]330.431411163518[/C][/ROW]
[ROW][C]1086.75277538108[/C][/ROW]
[ROW][C]1318.2124612498[/C][/ROW]
[ROW][C]2051.23397052389[/C][/ROW]
[ROW][C]-96.1184283282755[/C][/ROW]
[ROW][C]651.172780754227[/C][/ROW]
[ROW][C]2344.93796249463[/C][/ROW]
[ROW][C]-299.820854664144[/C][/ROW]
[ROW][C]-28.6751991707105[/C][/ROW]
[ROW][C]-1100.8980468873[/C][/ROW]
[ROW][C]1632.19793601796[/C][/ROW]
[ROW][C]-2791.88963123518[/C][/ROW]
[ROW][C]4268.89967376914[/C][/ROW]
[ROW][C]-1527.03576239492[/C][/ROW]
[ROW][C]-865.544793370187[/C][/ROW]
[ROW][C]-688.392626450932[/C][/ROW]
[ROW][C]-1777.07484844194[/C][/ROW]
[ROW][C]204.320483744251[/C][/ROW]
[ROW][C]-788.641343328956[/C][/ROW]
[ROW][C]-3235.72626495182[/C][/ROW]
[ROW][C]782.095613345828[/C][/ROW]
[ROW][C]-4210.75348985413[/C][/ROW]
[ROW][C]-1203.11127701836[/C][/ROW]
[ROW][C]662.618494044215[/C][/ROW]
[ROW][C]453.03034548919[/C][/ROW]
[ROW][C]-1380.42990557222[/C][/ROW]
[ROW][C]262.483451618172[/C][/ROW]
[ROW][C]2908.14047032861[/C][/ROW]
[ROW][C]1046.36715001535[/C][/ROW]
[ROW][C]1676.38644990715[/C][/ROW]
[ROW][C]1230.89705437512[/C][/ROW]
[ROW][C]1735.7926496287[/C][/ROW]
[ROW][C]2411.98374781701[/C][/ROW]
[ROW][C]-2259.03561582991[/C][/ROW]
[ROW][C]-502.502547890093[/C][/ROW]
[ROW][C]4596.5067569321[/C][/ROW]
[ROW][C]2560.75343232927[/C][/ROW]
[ROW][C]746.064344415845[/C][/ROW]
[ROW][C]1185.28411323632[/C][/ROW]
[ROW][C]-1802.12782290615[/C][/ROW]
[ROW][C]425.889961320956[/C][/ROW]
[ROW][C]-3581.73327592328[/C][/ROW]
[ROW][C]86.0875523231606[/C][/ROW]
[ROW][C]1968.31482781639[/C][/ROW]
[ROW][C]494.840272408994[/C][/ROW]
[ROW][C]-4407.89715380228[/C][/ROW]
[ROW][C]586.140717020663[/C][/ROW]
[ROW][C]149.489921175969[/C][/ROW]
[ROW][C]-2226.11068330811[/C][/ROW]
[ROW][C]2973.6054367918[/C][/ROW]
[ROW][C]-2880.12259876797[/C][/ROW]
[ROW][C]-2074.86841815272[/C][/ROW]
[ROW][C]1300.83981595441[/C][/ROW]
[ROW][C]2918.44220595154[/C][/ROW]
[ROW][C]-1093.84418138027[/C][/ROW]
[/TABLE]
Source: https://freestatistics.org/blog/index.php?pk=151041&T=2

Globally Unique Identifier (entire table): ba.freestatistics.org/blog/index.php?pk=151041&T=2

As an alternative you can also use a QR Code:  

The GUIDs for individual cells are displayed in the table below:

Estimated ARIMA Residuals
Value
-89.954096635942
1574.41948657038
-1075.48394933914
3552.57031425533
3352.06241528253
3100.61110454662
-1937.27375477256
1757.0142779482
-5041.43393114634
-119.80935751688
-1321.4227432049
-823.371918710237
1175.80796729649
-567.329251706807
-1294.86225230953
1396.38071505967
-453.948947987175
-545.77279124778
330.431411163518
1086.75277538108
1318.2124612498
2051.23397052389
-96.1184283282755
651.172780754227
2344.93796249463
-299.820854664144
-28.6751991707105
-1100.8980468873
1632.19793601796
-2791.88963123518
4268.89967376914
-1527.03576239492
-865.544793370187
-688.392626450932
-1777.07484844194
204.320483744251
-788.641343328956
-3235.72626495182
782.095613345828
-4210.75348985413
-1203.11127701836
662.618494044215
453.03034548919
-1380.42990557222
262.483451618172
2908.14047032861
1046.36715001535
1676.38644990715
1230.89705437512
1735.7926496287
2411.98374781701
-2259.03561582991
-502.502547890093
4596.5067569321
2560.75343232927
746.064344415845
1185.28411323632
-1802.12782290615
425.889961320956
-3581.73327592328
86.0875523231606
1968.31482781639
494.840272408994
-4407.89715380228
586.140717020663
149.489921175969
-2226.11068330811
2973.6054367918
-2880.12259876797
-2074.86841815272
1300.83981595441
2918.44220595154
-1093.84418138027


Parameters (Session):
par1 = FALSE ; par2 = 1 ; par3 = 1 ; par4 = 1 ; par5 = 12 ; par6 = 0 ; par7 = 1 ; par8 = 2 ; par9 = 1 ;
Parameters (R input):
par1 = FALSE ; par2 = 1 ; par3 = 1 ; par4 = 1 ; par5 = 12 ; par6 = 0 ; par7 = 1 ; par8 = 2 ; par9 = 1 ;
R code (references can be found in the software module):
library(lattice)
if (par1 == 'TRUE') par1 <- TRUE
if (par1 == 'FALSE') par1 <- FALSE
par2 <- as.numeric(par2) #Box-Cox lambda transformation parameter
par3 <- as.numeric(par3) #degree of non-seasonal differencing
par4 <- as.numeric(par4) #degree of seasonal differencing
par5 <- as.numeric(par5) #seasonal period
par6 <- as.numeric(par6) #degree (p) of the non-seasonal AR(p) polynomial
par7 <- as.numeric(par7) #degree (q) of the non-seasonal MA(q) polynomial
par8 <- as.numeric(par8) #degree (P) of the seasonal AR(P) polynomial
par9 <- as.numeric(par9) #degree (Q) of the seasonal MA(Q) polynomial
armaGR <- function(arima.out, names, n){
try1 <- arima.out$coef
try2 <- sqrt(diag(arima.out$var.coef))
try.data.frame <- data.frame(matrix(NA,ncol=4,nrow=length(names)))
dimnames(try.data.frame) <- list(names,c('coef','std','tstat','pv'))
try.data.frame[,1] <- try1
for(i in 1:length(try2)) try.data.frame[which(rownames(try.data.frame)==names(try2)[i]),2] <- try2[i]
try.data.frame[,3] <- try.data.frame[,1] / try.data.frame[,2]
try.data.frame[,4] <- round((1-pt(abs(try.data.frame[,3]),df=n-(length(try2)+1)))*2,5)
vector <- rep(NA,length(names))
vector[is.na(try.data.frame[,4])] <- 0
maxi <- which.max(try.data.frame[,4])
continue <- max(try.data.frame[,4],na.rm=TRUE) > .05
vector[maxi] <- 0
list(summary=try.data.frame,next.vector=vector,continue=continue)
}
arimaSelect <- function(series, order=c(13,0,0), seasonal=list(order=c(2,0,0),period=12), include.mean=F){
nrc <- order[1]+order[3]+seasonal$order[1]+seasonal$order[3]
coeff <- matrix(NA, nrow=nrc*2, ncol=nrc)
pval <- matrix(NA, nrow=nrc*2, ncol=nrc)
mylist <- rep(list(NULL), nrc)
names <- NULL
if(order[1] > 0) names <- paste('ar',1:order[1],sep='')
if(order[3] > 0) names <- c( names , paste('ma',1:order[3],sep='') )
if(seasonal$order[1] > 0) names <- c(names, paste('sar',1:seasonal$order[1],sep=''))
if(seasonal$order[3] > 0) names <- c(names, paste('sma',1:seasonal$order[3],sep=''))
arima.out <- arima(series, order=order, seasonal=seasonal, include.mean=include.mean, method='ML')
mylist[[1]] <- arima.out
last.arma <- armaGR(arima.out, names, length(series))
mystop <- FALSE
i <- 1
coeff[i,] <- last.arma[[1]][,1]
pval [i,] <- last.arma[[1]][,4]
i <- 2
aic <- arima.out$aic
while(!mystop){
mylist[[i]] <- arima.out
arima.out <- arima(series, order=order, seasonal=seasonal, include.mean=include.mean, method='ML', fixed=last.arma$next.vector)
aic <- c(aic, arima.out$aic)
last.arma <- armaGR(arima.out, names, length(series))
mystop <- !last.arma$continue
coeff[i,] <- last.arma[[1]][,1]
pval [i,] <- last.arma[[1]][,4]
i <- i+1
}
list(coeff, pval, mylist, aic=aic)
}
arimaSelectplot <- function(arimaSelect.out,noms,choix){
noms <- names(arimaSelect.out[[3]][[1]]$coef)
coeff <- arimaSelect.out[[1]]
k <- min(which(is.na(coeff[,1])))-1
coeff <- coeff[1:k,]
pval <- arimaSelect.out[[2]][1:k,]
aic <- arimaSelect.out$aic[1:k]
coeff[coeff==0] <- NA
n <- ncol(coeff)
if(missing(choix)) choix <- k
layout(matrix(c(1,1,1,2,
3,3,3,2,
3,3,3,4,
5,6,7,7),nr=4),
widths=c(10,35,45,15),
heights=c(30,30,15,15))
couleurs <- rainbow(75)[1:50]#(50)
ticks <- pretty(coeff)
par(mar=c(1,1,3,1))
plot(aic,k:1-.5,type='o',pch=21,bg='blue',cex=2,axes=F,lty=2,xpd=NA)
points(aic[choix],k-choix+.5,pch=21,cex=4,bg=2,xpd=NA)
title('aic',line=2)
par(mar=c(3,0,0,0))
plot(0,axes=F,xlab='',ylab='',xlim=range(ticks),ylim=c(.1,1))
rect(xleft = min(ticks) + (0:49)/50*(max(ticks)-min(ticks)),
xright = min(ticks) + (1:50)/50*(max(ticks)-min(ticks)),
ytop = rep(1,50),
ybottom= rep(0,50),col=couleurs,border=NA)
axis(1,ticks)
rect(xleft=min(ticks),xright=max(ticks),ytop=1,ybottom=0)
text(mean(coeff,na.rm=T),.5,'coefficients',cex=2,font=2)
par(mar=c(1,1,3,1))
image(1:n,1:k,t(coeff[k:1,]),axes=F,col=couleurs,zlim=range(ticks))
for(i in 1:n) for(j in 1:k) if(!is.na(coeff[j,i])) {
if(pval[j,i]<.01) symb = 'green'
else if( (pval[j,i]<.05) & (pval[j,i]>=.01)) symb = 'orange'
else if( (pval[j,i]<.1) & (pval[j,i]>=.05)) symb = 'red'
else symb = 'black'
polygon(c(i+.5 ,i+.2 ,i+.5 ,i+.5),
c(k-j+0.5,k-j+0.5,k-j+0.8,k-j+0.5),
col=symb)
if(j==choix) {
rect(xleft=i-.5,
xright=i+.5,
ybottom=k-j+1.5,
ytop=k-j+.5,
lwd=4)
text(i,
k-j+1,
round(coeff[j,i],2),
cex=1.2,
font=2)
}
else{
rect(xleft=i-.5,xright=i+.5,ybottom=k-j+1.5,ytop=k-j+.5)
text(i,k-j+1,round(coeff[j,i],2),cex=1.2,font=1)
}
}
axis(3,1:n,noms)
par(mar=c(0.5,0,0,0.5))
plot(0,axes=F,xlab='',ylab='',type='n',xlim=c(0,8),ylim=c(-.2,.8))
cols <- c('green','orange','red','black')
niv <- c('0','0.01','0.05','0.1')
for(i in 0:3){
polygon(c(1+2*i ,1+2*i ,1+2*i-.5 ,1+2*i),
c(.4 ,.7 , .4 , .4),
col=cols[i+1])
text(2*i,0.5,niv[i+1],cex=1.5)
}
text(8,.5,1,cex=1.5)
text(4,0,'p-value',cex=2)
box()
residus <- arimaSelect.out[[3]][[choix]]$res
par(mar=c(1,2,4,1))
acf(residus,main='')
title('acf',line=.5)
par(mar=c(1,2,4,1))
pacf(residus,main='')
title('pacf',line=.5)
par(mar=c(2,2,4,1))
qqnorm(residus,main='')
title('qq-norm',line=.5)
qqline(residus)
residus
}
if (par2 == 0) x <- log(x)
if (par2 != 0) x <- x^par2
(selection <- arimaSelect(x, order=c(par6,par3,par7), seasonal=list(order=c(par8,par4,par9), period=par5)))
bitmap(file='test1.png')
resid <- arimaSelectplot(selection)
dev.off()
resid
bitmap(file='test2.png')
acf(resid,length(resid)/2, main='Residual Autocorrelation Function')
dev.off()
bitmap(file='test3.png')
pacf(resid,length(resid)/2, main='Residual Partial Autocorrelation Function')
dev.off()
bitmap(file='test4.png')
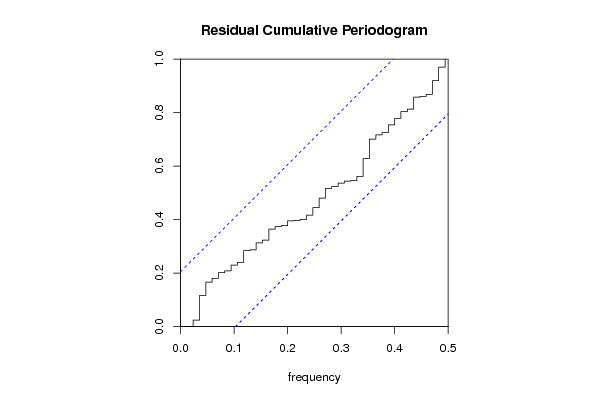
cpgram(resid, main='Residual Cumulative Periodogram')
dev.off()
bitmap(file='test5.png')
hist(resid, main='Residual Histogram', xlab='values of Residuals')
dev.off()
bitmap(file='test6.png')
densityplot(~resid,col='black',main='Residual Density Plot', xlab='values of Residuals')
dev.off()
bitmap(file='test7.png')
qqnorm(resid, main='Residual Normal Q-Q Plot')
qqline(resid)
dev.off()
ncols <- length(selection[[1]][1,])
nrows <- length(selection[[2]][,1])-1
load(file='createtable')
a<-table.start()
a<-table.row.start(a)
a<-table.element(a,'ARIMA Parameter Estimation and Backward Selection', ncols+1,TRUE)
a<-table.row.end(a)
a<-table.row.start(a)
a<-table.element(a,'Iteration', header=TRUE)
for (i in 1:ncols) {
a<-table.element(a,names(selection[[3]][[1]]$coef)[i],header=TRUE)
}
a<-table.row.end(a)
for (j in 1:nrows) {
a<-table.row.start(a)
mydum <- 'Estimates ('
mydum <- paste(mydum,j)
mydum <- paste(mydum,')')
a<-table.element(a,mydum, header=TRUE)
for (i in 1:ncols) {
a<-table.element(a,round(selection[[1]][j,i],4))
}
a<-table.row.end(a)
a<-table.row.start(a)
a<-table.element(a,'(p-val)', header=TRUE)
for (i in 1:ncols) {
mydum <- '('
mydum <- paste(mydum,round(selection[[2]][j,i],4),sep='')
mydum <- paste(mydum,')')
a<-table.element(a,mydum)
}
a<-table.row.end(a)
}
a<-table.end(a)
table.save(a,file='mytable.tab')
a<-table.start()
a<-table.row.start(a)
a<-table.element(a,'Estimated ARIMA Residuals', 1,TRUE)
a<-table.row.end(a)
a<-table.row.start(a)
a<-table.element(a,'Value', 1,TRUE)
a<-table.row.end(a)
for (i in (par4*par5+par3):length(resid)) {
a<-table.row.start(a)
a<-table.element(a,resid[i])
a<-table.row.end(a)
}
a<-table.end(a)
table.save(a,file='mytable1.tab')