Free Statistics

of Irreproducible Research!

Author's title

Author*The author of this computation has been verified*
R Software Modulerwasp_smp.wasp
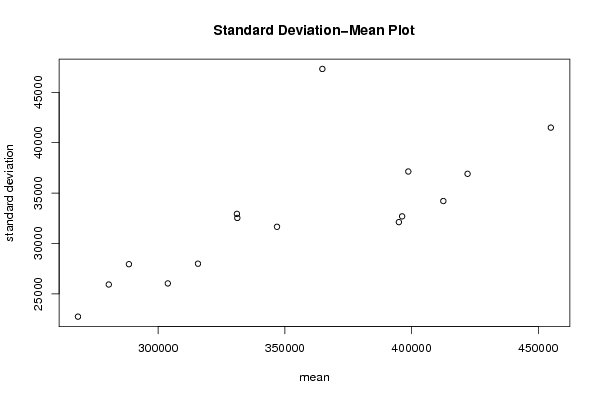
Title produced by softwareStandard Deviation-Mean Plot
Date of computationSat, 03 Dec 2011 14:25:57 -0500
Cite this page as followsStatistical Computations at FreeStatistics.org, Office for Research Development and Education, URL https://freestatistics.org/blog/index.php?v=date/2011/Dec/03/t1322940458glgjmg802ku7ho7.htm/, Retrieved Mon, 29 Apr 2024 07:49:31 +0000
Statistical Computations at FreeStatistics.org, Office for Research Development and Education, URL https://freestatistics.org/blog/index.php?pk=150533, Retrieved Mon, 29 Apr 2024 07:49:31 +0000
QR Codes:

Original text written by user:
IsPrivate?No (this computation is public)
User-defined keywords
Estimated Impact119
Family? (F = Feedback message, R = changed R code, M = changed R Module, P = changed Parameters, D = changed Data)
-     [Univariate Data Series] [data set] [2008-12-01 19:54:57] [b98453cac15ba1066b407e146608df68]
- RMP   [Standard Deviation-Mean Plot] [Unemployment] [2010-11-29 10:34:47] [b98453cac15ba1066b407e146608df68]
F R PD    [Standard Deviation-Mean Plot] [Box-Cox transform...] [2010-12-02 20:27:12] [97ad38b1c3b35a5feca8b85f7bc7b3ff]
- R PD        [Standard Deviation-Mean Plot] [] [2011-12-03 19:25:57] [ce4468323d272130d499477f5e05a6d2] [Current]
- RMPD          [ARIMA Backward Selection] [] [2011-12-20 19:06:42] [06c08141d7d783218a8164fd2ea166f2]
- R PD          [Standard Deviation-Mean Plot] [] [2011-12-20 19:23:17] [06c08141d7d783218a8164fd2ea166f2]
Feedback Forum

Post a new message
Dataseries X:
276986
260633
291551
275383
275302
231693
238829
274215
277808
299060
286629
232313
294053
267510
309739
280733
287298
235672
256449
288997
290789
321898
291834
241380
295469
258200
306102
281480
283101
237414
274834
299340
300383
340862
318794
265740
322656
281563
323461
312579
310784
262785
273754
320036
310336
342206
320052
265582
326988
300713
346414
317325
326208
270657
278158
324584
321801
343542
354040
278179
330246
307344
375874
335309
339271
280264
293689
341161
345097
368712
369403
288384
340981
319072
374214
344529
337271
281016
282224
320984
325426
366276
380296
300727
359326
327610
383563
352405
329351
294486
333454
334339
358000
396057
386976
307155
363909
344700
397561
376791
337085
299252
323136
329091
346991
461999
436533
360372
415467
382110
432197
424254
386728
354508
375765
367986
402378
426516
433313
338461
416834
381099
445673
412408
393997
348241
380134
373688
393588
434192
430731
344468
411891
370497
437305
411270
385495
341273
384217
373223
415771
448634
454341
350297
419104
398027
456059
430052
399757
362731
384896
385349
432289
468891
442702
370178
439400
393900
468700
438800
430100
366300
391000
380900
431400
465400
471500
387500
446400
421500
504800
492071
421253
396682
428000
421900
465600
525793
499855
435287
479499
473027
554410
489574
462157
420331


Summary of computational transaction
Raw Inputview raw input (R code)
Raw Outputview raw output of R engine
Computing time1 seconds
R Server'Gertrude Mary Cox' @ cox.wessa.net

\begin{tabular}{lllllllll}
\hline
Summary of computational transaction \tabularnewline
Raw Input & view raw input (R code)  \tabularnewline
Raw Output & view raw output of R engine  \tabularnewline
Computing time & 1 seconds \tabularnewline
R Server & 'Gertrude Mary Cox' @ cox.wessa.net \tabularnewline
\hline
\end{tabular}
%Source: https://freestatistics.org/blog/index.php?pk=150533&T=0

[TABLE]
[ROW][C]Summary of computational transaction[/C][/ROW]
[ROW][C]Raw Input[/C][C]view raw input (R code) [/C][/ROW]
[ROW][C]Raw Output[/C][C]view raw output of R engine [/C][/ROW]
[ROW][C]Computing time[/C][C]1 seconds[/C][/ROW]
[ROW][C]R Server[/C][C]'Gertrude Mary Cox' @ cox.wessa.net[/C][/ROW]
[/TABLE]
Source: https://freestatistics.org/blog/index.php?pk=150533&T=0

Globally Unique Identifier (entire table): ba.freestatistics.org/blog/index.php?pk=150533&T=0

As an alternative you can also use a QR Code:  

The GUIDs for individual cells are displayed in the table below:

Summary of computational transaction
Raw Inputview raw input (R code)
Raw Outputview raw output of R engine
Computing time1 seconds
R Server'Gertrude Mary Cox' @ cox.wessa.net


Standard Deviation-Mean Plot
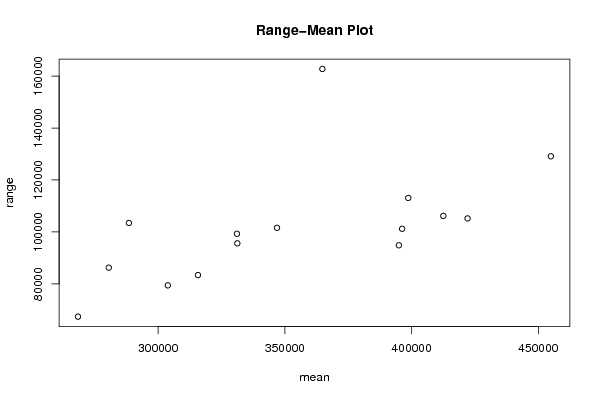
SectionMeanStandard DeviationRange
1268366.83333333322733.990106259767367
2280529.33333333325923.472818465186226
3288476.58333333327940.98278176103448
4303816.16666666726030.602590843479421
5315717.41666666727986.706638098283383
6331229.532531.841971995895610
7331084.66666666732934.446027700599280
8346893.531651.6975661367101571
936478547316.7162888935162747
10394973.58333333332114.089571283694852
11396254.41666666732686.7687978939101205
12398684.537139.0771792633113068
13412502.91666666734207.7829327515106160
1442207536910.4105787366105200
15454928.41666666741494.2371978181129111

\begin{tabular}{lllllllll}
\hline
Standard Deviation-Mean Plot \tabularnewline
Section & Mean & Standard Deviation & Range \tabularnewline
1 & 268366.833333333 & 22733.9901062597 & 67367 \tabularnewline
2 & 280529.333333333 & 25923.4728184651 & 86226 \tabularnewline
3 & 288476.583333333 & 27940.98278176 & 103448 \tabularnewline
4 & 303816.166666667 & 26030.6025908434 & 79421 \tabularnewline
5 & 315717.416666667 & 27986.7066380982 & 83383 \tabularnewline
6 & 331229.5 & 32531.8419719958 & 95610 \tabularnewline
7 & 331084.666666667 & 32934.4460277005 & 99280 \tabularnewline
8 & 346893.5 & 31651.6975661367 & 101571 \tabularnewline
9 & 364785 & 47316.7162888935 & 162747 \tabularnewline
10 & 394973.583333333 & 32114.0895712836 & 94852 \tabularnewline
11 & 396254.416666667 & 32686.7687978939 & 101205 \tabularnewline
12 & 398684.5 & 37139.0771792633 & 113068 \tabularnewline
13 & 412502.916666667 & 34207.7829327515 & 106160 \tabularnewline
14 & 422075 & 36910.4105787366 & 105200 \tabularnewline
15 & 454928.416666667 & 41494.2371978181 & 129111 \tabularnewline
\hline
\end{tabular}
%Source: https://freestatistics.org/blog/index.php?pk=150533&T=1

[TABLE]
[ROW][C]Standard Deviation-Mean Plot[/C][/ROW]
[ROW][C]Section[/C][C]Mean[/C][C]Standard Deviation[/C][C]Range[/C][/ROW]
[ROW][C]1[/C][C]268366.833333333[/C][C]22733.9901062597[/C][C]67367[/C][/ROW]
[ROW][C]2[/C][C]280529.333333333[/C][C]25923.4728184651[/C][C]86226[/C][/ROW]
[ROW][C]3[/C][C]288476.583333333[/C][C]27940.98278176[/C][C]103448[/C][/ROW]
[ROW][C]4[/C][C]303816.166666667[/C][C]26030.6025908434[/C][C]79421[/C][/ROW]
[ROW][C]5[/C][C]315717.416666667[/C][C]27986.7066380982[/C][C]83383[/C][/ROW]
[ROW][C]6[/C][C]331229.5[/C][C]32531.8419719958[/C][C]95610[/C][/ROW]
[ROW][C]7[/C][C]331084.666666667[/C][C]32934.4460277005[/C][C]99280[/C][/ROW]
[ROW][C]8[/C][C]346893.5[/C][C]31651.6975661367[/C][C]101571[/C][/ROW]
[ROW][C]9[/C][C]364785[/C][C]47316.7162888935[/C][C]162747[/C][/ROW]
[ROW][C]10[/C][C]394973.583333333[/C][C]32114.0895712836[/C][C]94852[/C][/ROW]
[ROW][C]11[/C][C]396254.416666667[/C][C]32686.7687978939[/C][C]101205[/C][/ROW]
[ROW][C]12[/C][C]398684.5[/C][C]37139.0771792633[/C][C]113068[/C][/ROW]
[ROW][C]13[/C][C]412502.916666667[/C][C]34207.7829327515[/C][C]106160[/C][/ROW]
[ROW][C]14[/C][C]422075[/C][C]36910.4105787366[/C][C]105200[/C][/ROW]
[ROW][C]15[/C][C]454928.416666667[/C][C]41494.2371978181[/C][C]129111[/C][/ROW]
[/TABLE]
Source: https://freestatistics.org/blog/index.php?pk=150533&T=1

Globally Unique Identifier (entire table): ba.freestatistics.org/blog/index.php?pk=150533&T=1

As an alternative you can also use a QR Code:  

The GUIDs for individual cells are displayed in the table below:

Standard Deviation-Mean Plot
SectionMeanStandard DeviationRange
1268366.83333333322733.990106259767367
2280529.33333333325923.472818465186226
3288476.58333333327940.98278176103448
4303816.16666666726030.602590843479421
5315717.41666666727986.706638098283383
6331229.532531.841971995895610
7331084.66666666732934.446027700599280
8346893.531651.6975661367101571
936478547316.7162888935162747
10394973.58333333332114.089571283694852
11396254.41666666732686.7687978939101205
12398684.537139.0771792633113068
13412502.91666666734207.7829327515106160
1442207536910.4105787366105200
15454928.41666666741494.2371978181129111


Regression: S.E.(k) = alpha + beta * Mean(k)
alpha3515.23660566815
beta0.0822689503103899
S.D.0.0207052168400368
T-STAT3.97334405845535
p-value0.00158996112248681

\begin{tabular}{lllllllll}
\hline
Regression: S.E.(k) = alpha + beta * Mean(k) \tabularnewline
alpha & 3515.23660566815 \tabularnewline
beta & 0.0822689503103899 \tabularnewline
S.D. & 0.0207052168400368 \tabularnewline
T-STAT & 3.97334405845535 \tabularnewline
p-value & 0.00158996112248681 \tabularnewline
\hline
\end{tabular}
%Source: https://freestatistics.org/blog/index.php?pk=150533&T=2

[TABLE]
[ROW][C]Regression: S.E.(k) = alpha + beta * Mean(k)[/C][/ROW]
[ROW][C]alpha[/C][C]3515.23660566815[/C][/ROW]
[ROW][C]beta[/C][C]0.0822689503103899[/C][/ROW]
[ROW][C]S.D.[/C][C]0.0207052168400368[/C][/ROW]
[ROW][C]T-STAT[/C][C]3.97334405845535[/C][/ROW]
[ROW][C]p-value[/C][C]0.00158996112248681[/C][/ROW]
[/TABLE]
Source: https://freestatistics.org/blog/index.php?pk=150533&T=2

Globally Unique Identifier (entire table): ba.freestatistics.org/blog/index.php?pk=150533&T=2

As an alternative you can also use a QR Code:  

The GUIDs for individual cells are displayed in the table below:

Regression: S.E.(k) = alpha + beta * Mean(k)
alpha3515.23660566815
beta0.0822689503103899
S.D.0.0207052168400368
T-STAT3.97334405845535
p-value0.00158996112248681


Regression: ln S.E.(k) = alpha + beta * ln Mean(k)
alpha-1.55150738486336
beta0.934421041416536
S.D.0.19443643126514
T-STAT4.80579197703092
p-value0.000343258652264749
Lambda0.0655789585834644

\begin{tabular}{lllllllll}
\hline
Regression: ln S.E.(k) = alpha + beta * ln Mean(k) \tabularnewline
alpha & -1.55150738486336 \tabularnewline
beta & 0.934421041416536 \tabularnewline
S.D. & 0.19443643126514 \tabularnewline
T-STAT & 4.80579197703092 \tabularnewline
p-value & 0.000343258652264749 \tabularnewline
Lambda & 0.0655789585834644 \tabularnewline
\hline
\end{tabular}
%Source: https://freestatistics.org/blog/index.php?pk=150533&T=3

[TABLE]
[ROW][C]Regression: ln S.E.(k) = alpha + beta * ln Mean(k)[/C][/ROW]
[ROW][C]alpha[/C][C]-1.55150738486336[/C][/ROW]
[ROW][C]beta[/C][C]0.934421041416536[/C][/ROW]
[ROW][C]S.D.[/C][C]0.19443643126514[/C][/ROW]
[ROW][C]T-STAT[/C][C]4.80579197703092[/C][/ROW]
[ROW][C]p-value[/C][C]0.000343258652264749[/C][/ROW]
[ROW][C]Lambda[/C][C]0.0655789585834644[/C][/ROW]
[/TABLE]
Source: https://freestatistics.org/blog/index.php?pk=150533&T=3

Globally Unique Identifier (entire table): ba.freestatistics.org/blog/index.php?pk=150533&T=3

As an alternative you can also use a QR Code:  

The GUIDs for individual cells are displayed in the table below:

Regression: ln S.E.(k) = alpha + beta * ln Mean(k)
alpha-1.55150738486336
beta0.934421041416536
S.D.0.19443643126514
T-STAT4.80579197703092
p-value0.000343258652264749
Lambda0.0655789585834644


Parameters (Session):
par1 = 12 ;
Parameters (R input):
par1 = 12 ;
R code (references can be found in the software module):
par1 <- as.numeric(par1)
(n <- length(x))
(np <- floor(n / par1))
arr <- array(NA,dim=c(par1,np))
j <- 0
k <- 1
for (i in 1:(np*par1))
{
j = j + 1
arr[j,k] <- x[i]
if (j == par1) {
j = 0
k=k+1
}
}
arr
arr.mean <- array(NA,dim=np)
arr.sd <- array(NA,dim=np)
arr.range <- array(NA,dim=np)
for (j in 1:np)
{
arr.mean[j] <- mean(arr[,j],na.rm=TRUE)
arr.sd[j] <- sd(arr[,j],na.rm=TRUE)
arr.range[j] <- max(arr[,j],na.rm=TRUE) - min(arr[,j],na.rm=TRUE)
}
arr.mean
arr.sd
arr.range
(lm1 <- lm(arr.sd~arr.mean))
(lnlm1 <- lm(log(arr.sd)~log(arr.mean)))
(lm2 <- lm(arr.range~arr.mean))
bitmap(file='test1.png')
plot(arr.mean,arr.sd,main='Standard Deviation-Mean Plot',xlab='mean',ylab='standard deviation')
dev.off()
bitmap(file='test2.png')
plot(arr.mean,arr.range,main='Range-Mean Plot',xlab='mean',ylab='range')
dev.off()
load(file='createtable')
a<-table.start()
a<-table.row.start(a)
a<-table.element(a,'Standard Deviation-Mean Plot',4,TRUE)
a<-table.row.end(a)
a<-table.row.start(a)
a<-table.element(a,'Section',header=TRUE)
a<-table.element(a,'Mean',header=TRUE)
a<-table.element(a,'Standard Deviation',header=TRUE)
a<-table.element(a,'Range',header=TRUE)
a<-table.row.end(a)
for (j in 1:np) {
a<-table.row.start(a)
a<-table.element(a,j,header=TRUE)
a<-table.element(a,arr.mean[j])
a<-table.element(a,arr.sd[j] )
a<-table.element(a,arr.range[j] )
a<-table.row.end(a)
}
a<-table.end(a)
table.save(a,file='mytable.tab')
a<-table.start()
a<-table.row.start(a)
a<-table.element(a,'Regression: S.E.(k) = alpha + beta * Mean(k)',2,TRUE)
a<-table.row.end(a)
a<-table.row.start(a)
a<-table.element(a,'alpha',header=TRUE)
a<-table.element(a,lm1$coefficients[[1]])
a<-table.row.end(a)
a<-table.row.start(a)
a<-table.element(a,'beta',header=TRUE)
a<-table.element(a,lm1$coefficients[[2]])
a<-table.row.end(a)
a<-table.row.start(a)
a<-table.element(a,'S.D.',header=TRUE)
a<-table.element(a,summary(lm1)$coefficients[2,2])
a<-table.row.end(a)
a<-table.row.start(a)
a<-table.element(a,'T-STAT',header=TRUE)
a<-table.element(a,summary(lm1)$coefficients[2,3])
a<-table.row.end(a)
a<-table.row.start(a)
a<-table.element(a,'p-value',header=TRUE)
a<-table.element(a,summary(lm1)$coefficients[2,4])
a<-table.row.end(a)
a<-table.end(a)
table.save(a,file='mytable1.tab')
a<-table.start()
a<-table.row.start(a)
a<-table.element(a,'Regression: ln S.E.(k) = alpha + beta * ln Mean(k)',2,TRUE)
a<-table.row.end(a)
a<-table.row.start(a)
a<-table.element(a,'alpha',header=TRUE)
a<-table.element(a,lnlm1$coefficients[[1]])
a<-table.row.end(a)
a<-table.row.start(a)
a<-table.element(a,'beta',header=TRUE)
a<-table.element(a,lnlm1$coefficients[[2]])
a<-table.row.end(a)
a<-table.row.start(a)
a<-table.element(a,'S.D.',header=TRUE)
a<-table.element(a,summary(lnlm1)$coefficients[2,2])
a<-table.row.end(a)
a<-table.row.start(a)
a<-table.element(a,'T-STAT',header=TRUE)
a<-table.element(a,summary(lnlm1)$coefficients[2,3])
a<-table.row.end(a)
a<-table.row.start(a)
a<-table.element(a,'p-value',header=TRUE)
a<-table.element(a,summary(lnlm1)$coefficients[2,4])
a<-table.row.end(a)
a<-table.row.start(a)
a<-table.element(a,'Lambda',header=TRUE)
a<-table.element(a,1-lnlm1$coefficients[[2]])
a<-table.row.end(a)
a<-table.end(a)
table.save(a,file='mytable2.tab')