Free Statistics

of Irreproducible Research!

Author's title

Author*The author of this computation has been verified*
R Software Modulerwasp_centraltendency.wasp
Title produced by softwareCentral Tendency
Date of computationSat, 03 Dec 2011 10:32:45 -0500
Cite this page as followsStatistical Computations at FreeStatistics.org, Office for Research Development and Education, URL https://freestatistics.org/blog/index.php?v=date/2011/Dec/03/t1322926398se51ngqw0q2m9rz.htm/, Retrieved Sun, 28 Apr 2024 19:52:38 +0000
Statistical Computations at FreeStatistics.org, Office for Research Development and Education, URL https://freestatistics.org/blog/index.php?pk=150485, Retrieved Sun, 28 Apr 2024 19:52:38 +0000
QR Codes:

Original text written by user:
IsPrivate?No (this computation is public)
User-defined keywords
Estimated Impact106
Family? (F = Feedback message, R = changed R code, M = changed R Module, P = changed Parameters, D = changed Data)
-     [Central Tendency] [Central tendency ...] [2010-12-10 09:59:23] [97ad38b1c3b35a5feca8b85f7bc7b3ff]
- R  D    [Central Tendency] [Central Tendency] [2011-12-03 15:32:45] [7524f34f9c6610426249911bb0d7f59b] [Current]
- R  D      [Central Tendency] [Central Tendency] [2011-12-03 15:36:31] [3deae35ae8526e36953f595ad65f3a1f]
- RMPD      [Blocked Bootstrap Plot - Central Tendency] [Blocked Bootstrap...] [2011-12-03 16:23:09] [3deae35ae8526e36953f595ad65f3a1f]
- RM D      [Variability] [Variability] [2011-12-03 16:41:31] [3deae35ae8526e36953f595ad65f3a1f]
Feedback Forum

Post a new message
Dataseries X:
921365
987921
1132614
1332224
1418133
1411549
1695920
1636173
1539653
1395314
1127575
1036076
989236
1008380
1207763
1368839
1469798
1498721
1761761
1653214
1599104
1421179
1163995
1037735
1015407
1039210
1258049
1469445
1552346
1549144
1785895
1662335
1629440
1467430
1202209
1076982
1039367
1063449
1335135
1491602
1591972
1641248
1898849
1798580
1762444
1622044
1368955
1262973
1269530
1479279
1607819
1721466
1721766
1949843
1821326
1757802
1590367
1260647
1149235
1016367
1027885
1262159
1520854
1544144
1564709
1821776
1741365
1623386
1498658
1241822
1136029
1035030
1078521
1279431
1171023
1573377
1589514
1859878
1783191
1689849
1619868
1323443
1177481


Summary of computational transaction
Raw Inputview raw input (R code)
Raw Outputview raw output of R engine
Computing time1 seconds
R Server'Gwilym Jenkins' @ jenkins.wessa.net

\begin{tabular}{lllllllll}
\hline
Summary of computational transaction \tabularnewline
Raw Input & view raw input (R code)  \tabularnewline
Raw Output & view raw output of R engine  \tabularnewline
Computing time & 1 seconds \tabularnewline
R Server & 'Gwilym Jenkins' @ jenkins.wessa.net \tabularnewline
\hline
\end{tabular}
%Source: https://freestatistics.org/blog/index.php?pk=150485&T=0

[TABLE]
[ROW][C]Summary of computational transaction[/C][/ROW]
[ROW][C]Raw Input[/C][C]view raw input (R code) [/C][/ROW]
[ROW][C]Raw Output[/C][C]view raw output of R engine [/C][/ROW]
[ROW][C]Computing time[/C][C]1 seconds[/C][/ROW]
[ROW][C]R Server[/C][C]'Gwilym Jenkins' @ jenkins.wessa.net[/C][/ROW]
[/TABLE]
Source: https://freestatistics.org/blog/index.php?pk=150485&T=0

Globally Unique Identifier (entire table): ba.freestatistics.org/blog/index.php?pk=150485&T=0

As an alternative you can also use a QR Code:  

The GUIDs for individual cells are displayed in the table below:

Summary of computational transaction
Raw Inputview raw input (R code)
Raw Outputview raw output of R engine
Computing time1 seconds
R Server'Gwilym Jenkins' @ jenkins.wessa.net


Central Tendency - Ungrouped Data
MeasureValueS.E.Value/S.E.
Arithmetic Mean1420573.3975903629848.609192664147.5926160720244
Geometric Mean1393892.17969476
Harmonic Mean1366578.1197053
Quadratic Mean1446058.71752907
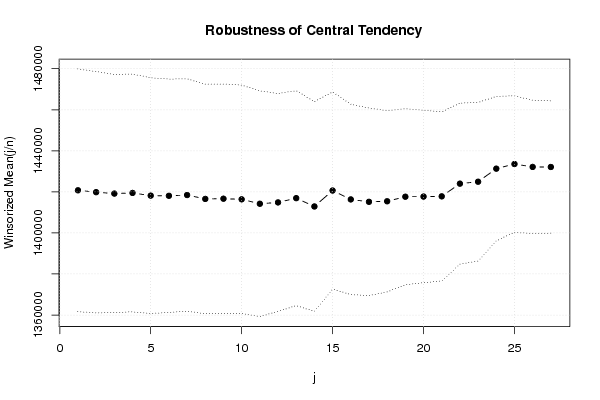
Winsorized Mean ( 1 / 27 )1420760.8915662729568.180852948948.0503314908726
Winsorized Mean ( 2 / 27 )1419853.5180722929384.170487034348.3203539367837
Winsorized Mean ( 3 / 27 )1419168.2891566329020.293128155348.9026173129781
Winsorized Mean ( 4 / 27 )1419485.2530120528958.579959974249.0177783224876
Winsorized Mean ( 5 / 27 )1418172.8433734928722.107042693349.3756548315026
Winsorized Mean ( 6 / 27 )1418088.4819277128435.018478457549.8711995915199
Winsorized Mean ( 7 / 27 )1418463.0240963928298.901890285450.1243132894611
Winsorized Mean ( 8 / 27 )1416564.1325301227974.25980701150.6381274179449
Winsorized Mean ( 9 / 27 )1416669.9638554227933.297745641350.7161731047842
Winsorized Mean ( 10 / 27 )1416370.6867469927832.302428919550.8894544518635
Winsorized Mean ( 11 / 27 )1414213.0963855427507.903864320651.4111545307479
Winsorized Mean ( 12 / 27 )1414861.2409638626531.816076583553.3269655149082
Winsorized Mean ( 13 / 27 )1416933.8795180726186.174855618554.1099983991765
Winsorized Mean ( 14 / 27 )1412884.506024125548.098684610255.3029218912168
Winsorized Mean ( 15 / 27 )1420652.5180722924030.86650995659.1178232163918
Winsorized Mean ( 16 / 27 )1416319.9879518123180.275570596661.1002221970287
Winsorized Mean ( 17 / 27 )1415151.2891566322836.282839387961.9694237941292
Winsorized Mean ( 18 / 27 )1415420.2048192822085.507257783464.0881908800374
Winsorized Mean ( 19 / 27 )1417637.2530120521448.884561468366.0937518195588
Winsorized Mean ( 20 / 27 )1417708.337349421004.967315987867.4939558830122
Winsorized Mean ( 21 / 27 )1417810.5542168720584.195547214568.8785991643347
Winsorized Mean ( 22 / 27 )1424009.2530120519621.911014904472.5724039789192
Winsorized Mean ( 23 / 27 )1424945.325301219336.248315172173.692957500092
Winsorized Mean ( 24 / 27 )1431309.662650617585.987718260981.3892108638495
Winsorized Mean ( 25 / 27 )1433572.3132530116630.117860957286.2033766230021
Winsorized Mean ( 26 / 27 )1432152.0240963916255.839438838388.1007732319685
Winsorized Mean ( 27 / 27 )1432121.7710843416130.063050215188.7858755806435
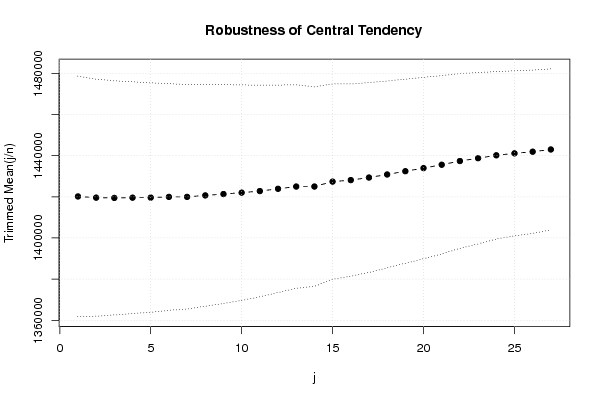
Trimmed Mean ( 1 / 27 )1420202.2716049429224.512861948848.5962684241722
Trimmed Mean ( 2 / 27 )1419615.3670886128820.788821989449.2566451201879
Trimmed Mean ( 3 / 27 )1419487.0129870128458.13226989849.8798374933585
Trimmed Mean ( 4 / 27 )1419604.5866666728183.712785934250.3696797313076
Trimmed Mean ( 5 / 27 )1419638.5068493227874.096491866350.9303864705918
Trimmed Mean ( 6 / 27 )1419981.1830985927569.179423286551.506109822739
Trimmed Mean ( 7 / 27 )1419981.1830985927272.480530240852.066447770457
Trimmed Mean ( 8 / 27 )1420696.4626865726941.655469933152.7323372638355
Trimmed Mean ( 9 / 27 )1421356.0461538526606.862372855853.4206561538765
Trimmed Mean ( 10 / 27 )1422042.0158730226203.242006448154.2696974490058
Trimmed Mean ( 11 / 27 )1422813.6885245925727.485213804455.3032555145017
Trimmed Mean ( 12 / 27 )1423913.6101694925205.114797137756.4930420523692
Trimmed Mean ( 13 / 27 )1425012.0701754424749.810473159357.5766861617319
Trimmed Mean ( 14 / 27 )1425012.0701754424247.679096393558.7690089641359
Trimmed Mean ( 15 / 27 )1427411.3018867923734.344310074460.1411727764017
Trimmed Mean ( 16 / 27 )1428144.6078431423378.426968586961.0881394955317
Trimmed Mean ( 17 / 27 )1429396.4489795923066.787763331761.967728824897
Trimmed Mean ( 18 / 27 )1430876.2340425522711.466108908763.0023718936086
Trimmed Mean ( 19 / 27 )143246022377.520501181764.013347677387
Trimmed Mean ( 20 / 27 )1433965.8604651222046.73668751865.0420912985718
Trimmed Mean ( 21 / 27 )1435611.4390243921673.318946796666.2386523517009
Trimmed Mean ( 22 / 27 )1437415.4358974421236.159829737767.6871641305213
Trimmed Mean ( 23 / 27 )1438782.4054054120846.667321651469.0173821650179
Trimmed Mean ( 24 / 27 )1440209.0857142920346.41329337570.7844210646814
Trimmed Mean ( 25 / 27 )1441141.7272727320065.065849624371.8234237591457
Trimmed Mean ( 26 / 27 )1441952.3870967719855.863777263472.6209850788726
Trimmed Mean ( 27 / 27 )1443031.2068965519578.255699372273.705810622487
Median1469445
Midrange1435604
Midmean - Weighted Average at Xnp1429311.71428571
Midmean - Weighted Average at X(n+1)p1433965.86046512
Midmean - Empirical Distribution Function1433965.86046512
Midmean - Empirical Distribution Function - Averaging1433965.86046512
Midmean - Empirical Distribution Function - Interpolation1435611.43902439
Midmean - Closest Observation1429311.71428571
Midmean - True Basic - Statistics Graphics Toolkit1433965.86046512
Midmean - MS Excel (old versions)1433965.86046512
Number of observations83

\begin{tabular}{lllllllll}
\hline
Central Tendency - Ungrouped Data \tabularnewline
Measure & Value & S.E. & Value/S.E. \tabularnewline
Arithmetic Mean & 1420573.39759036 & 29848.6091926641 & 47.5926160720244 \tabularnewline
Geometric Mean & 1393892.17969476 &  &  \tabularnewline
Harmonic Mean & 1366578.1197053 &  &  \tabularnewline
Quadratic Mean & 1446058.71752907 &  &  \tabularnewline
Winsorized Mean ( 1 / 27 ) & 1420760.89156627 & 29568.1808529489 & 48.0503314908726 \tabularnewline
Winsorized Mean ( 2 / 27 ) & 1419853.51807229 & 29384.1704870343 & 48.3203539367837 \tabularnewline
Winsorized Mean ( 3 / 27 ) & 1419168.28915663 & 29020.2931281553 & 48.9026173129781 \tabularnewline
Winsorized Mean ( 4 / 27 ) & 1419485.25301205 & 28958.5799599742 & 49.0177783224876 \tabularnewline
Winsorized Mean ( 5 / 27 ) & 1418172.84337349 & 28722.1070426933 & 49.3756548315026 \tabularnewline
Winsorized Mean ( 6 / 27 ) & 1418088.48192771 & 28435.0184784575 & 49.8711995915199 \tabularnewline
Winsorized Mean ( 7 / 27 ) & 1418463.02409639 & 28298.9018902854 & 50.1243132894611 \tabularnewline
Winsorized Mean ( 8 / 27 ) & 1416564.13253012 & 27974.259807011 & 50.6381274179449 \tabularnewline
Winsorized Mean ( 9 / 27 ) & 1416669.96385542 & 27933.2977456413 & 50.7161731047842 \tabularnewline
Winsorized Mean ( 10 / 27 ) & 1416370.68674699 & 27832.3024289195 & 50.8894544518635 \tabularnewline
Winsorized Mean ( 11 / 27 ) & 1414213.09638554 & 27507.9038643206 & 51.4111545307479 \tabularnewline
Winsorized Mean ( 12 / 27 ) & 1414861.24096386 & 26531.8160765835 & 53.3269655149082 \tabularnewline
Winsorized Mean ( 13 / 27 ) & 1416933.87951807 & 26186.1748556185 & 54.1099983991765 \tabularnewline
Winsorized Mean ( 14 / 27 ) & 1412884.5060241 & 25548.0986846102 & 55.3029218912168 \tabularnewline
Winsorized Mean ( 15 / 27 ) & 1420652.51807229 & 24030.866509956 & 59.1178232163918 \tabularnewline
Winsorized Mean ( 16 / 27 ) & 1416319.98795181 & 23180.2755705966 & 61.1002221970287 \tabularnewline
Winsorized Mean ( 17 / 27 ) & 1415151.28915663 & 22836.2828393879 & 61.9694237941292 \tabularnewline
Winsorized Mean ( 18 / 27 ) & 1415420.20481928 & 22085.5072577834 & 64.0881908800374 \tabularnewline
Winsorized Mean ( 19 / 27 ) & 1417637.25301205 & 21448.8845614683 & 66.0937518195588 \tabularnewline
Winsorized Mean ( 20 / 27 ) & 1417708.3373494 & 21004.9673159878 & 67.4939558830122 \tabularnewline
Winsorized Mean ( 21 / 27 ) & 1417810.55421687 & 20584.1955472145 & 68.8785991643347 \tabularnewline
Winsorized Mean ( 22 / 27 ) & 1424009.25301205 & 19621.9110149044 & 72.5724039789192 \tabularnewline
Winsorized Mean ( 23 / 27 ) & 1424945.3253012 & 19336.2483151721 & 73.692957500092 \tabularnewline
Winsorized Mean ( 24 / 27 ) & 1431309.6626506 & 17585.9877182609 & 81.3892108638495 \tabularnewline
Winsorized Mean ( 25 / 27 ) & 1433572.31325301 & 16630.1178609572 & 86.2033766230021 \tabularnewline
Winsorized Mean ( 26 / 27 ) & 1432152.02409639 & 16255.8394388383 & 88.1007732319685 \tabularnewline
Winsorized Mean ( 27 / 27 ) & 1432121.77108434 & 16130.0630502151 & 88.7858755806435 \tabularnewline
Trimmed Mean ( 1 / 27 ) & 1420202.27160494 & 29224.5128619488 & 48.5962684241722 \tabularnewline
Trimmed Mean ( 2 / 27 ) & 1419615.36708861 & 28820.7888219894 & 49.2566451201879 \tabularnewline
Trimmed Mean ( 3 / 27 ) & 1419487.01298701 & 28458.132269898 & 49.8798374933585 \tabularnewline
Trimmed Mean ( 4 / 27 ) & 1419604.58666667 & 28183.7127859342 & 50.3696797313076 \tabularnewline
Trimmed Mean ( 5 / 27 ) & 1419638.50684932 & 27874.0964918663 & 50.9303864705918 \tabularnewline
Trimmed Mean ( 6 / 27 ) & 1419981.18309859 & 27569.1794232865 & 51.506109822739 \tabularnewline
Trimmed Mean ( 7 / 27 ) & 1419981.18309859 & 27272.4805302408 & 52.066447770457 \tabularnewline
Trimmed Mean ( 8 / 27 ) & 1420696.46268657 & 26941.6554699331 & 52.7323372638355 \tabularnewline
Trimmed Mean ( 9 / 27 ) & 1421356.04615385 & 26606.8623728558 & 53.4206561538765 \tabularnewline
Trimmed Mean ( 10 / 27 ) & 1422042.01587302 & 26203.2420064481 & 54.2696974490058 \tabularnewline
Trimmed Mean ( 11 / 27 ) & 1422813.68852459 & 25727.4852138044 & 55.3032555145017 \tabularnewline
Trimmed Mean ( 12 / 27 ) & 1423913.61016949 & 25205.1147971377 & 56.4930420523692 \tabularnewline
Trimmed Mean ( 13 / 27 ) & 1425012.07017544 & 24749.8104731593 & 57.5766861617319 \tabularnewline
Trimmed Mean ( 14 / 27 ) & 1425012.07017544 & 24247.6790963935 & 58.7690089641359 \tabularnewline
Trimmed Mean ( 15 / 27 ) & 1427411.30188679 & 23734.3443100744 & 60.1411727764017 \tabularnewline
Trimmed Mean ( 16 / 27 ) & 1428144.60784314 & 23378.4269685869 & 61.0881394955317 \tabularnewline
Trimmed Mean ( 17 / 27 ) & 1429396.44897959 & 23066.7877633317 & 61.967728824897 \tabularnewline
Trimmed Mean ( 18 / 27 ) & 1430876.23404255 & 22711.4661089087 & 63.0023718936086 \tabularnewline
Trimmed Mean ( 19 / 27 ) & 1432460 & 22377.5205011817 & 64.013347677387 \tabularnewline
Trimmed Mean ( 20 / 27 ) & 1433965.86046512 & 22046.736687518 & 65.0420912985718 \tabularnewline
Trimmed Mean ( 21 / 27 ) & 1435611.43902439 & 21673.3189467966 & 66.2386523517009 \tabularnewline
Trimmed Mean ( 22 / 27 ) & 1437415.43589744 & 21236.1598297377 & 67.6871641305213 \tabularnewline
Trimmed Mean ( 23 / 27 ) & 1438782.40540541 & 20846.6673216514 & 69.0173821650179 \tabularnewline
Trimmed Mean ( 24 / 27 ) & 1440209.08571429 & 20346.413293375 & 70.7844210646814 \tabularnewline
Trimmed Mean ( 25 / 27 ) & 1441141.72727273 & 20065.0658496243 & 71.8234237591457 \tabularnewline
Trimmed Mean ( 26 / 27 ) & 1441952.38709677 & 19855.8637772634 & 72.6209850788726 \tabularnewline
Trimmed Mean ( 27 / 27 ) & 1443031.20689655 & 19578.2556993722 & 73.705810622487 \tabularnewline
Median & 1469445 &  &  \tabularnewline
Midrange & 1435604 &  &  \tabularnewline
Midmean - Weighted Average at Xnp & 1429311.71428571 &  &  \tabularnewline
Midmean - Weighted Average at X(n+1)p & 1433965.86046512 &  &  \tabularnewline
Midmean - Empirical Distribution Function & 1433965.86046512 &  &  \tabularnewline
Midmean - Empirical Distribution Function - Averaging & 1433965.86046512 &  &  \tabularnewline
Midmean - Empirical Distribution Function - Interpolation & 1435611.43902439 &  &  \tabularnewline
Midmean - Closest Observation & 1429311.71428571 &  &  \tabularnewline
Midmean - True Basic - Statistics Graphics Toolkit & 1433965.86046512 &  &  \tabularnewline
Midmean - MS Excel (old versions) & 1433965.86046512 &  &  \tabularnewline
Number of observations & 83 &  &  \tabularnewline
\hline
\end{tabular}
%Source: https://freestatistics.org/blog/index.php?pk=150485&T=1

[TABLE]
[ROW][C]Central Tendency - Ungrouped Data[/C][/ROW]
[ROW][C]Measure[/C][C]Value[/C][C]S.E.[/C][C]Value/S.E.[/C][/ROW]
[ROW][C]Arithmetic Mean[/C][C]1420573.39759036[/C][C]29848.6091926641[/C][C]47.5926160720244[/C][/ROW]
[ROW][C]Geometric Mean[/C][C]1393892.17969476[/C][C][/C][C][/C][/ROW]
[ROW][C]Harmonic Mean[/C][C]1366578.1197053[/C][C][/C][C][/C][/ROW]
[ROW][C]Quadratic Mean[/C][C]1446058.71752907[/C][C][/C][C][/C][/ROW]
[ROW][C]Winsorized Mean ( 1 / 27 )[/C][C]1420760.89156627[/C][C]29568.1808529489[/C][C]48.0503314908726[/C][/ROW]
[ROW][C]Winsorized Mean ( 2 / 27 )[/C][C]1419853.51807229[/C][C]29384.1704870343[/C][C]48.3203539367837[/C][/ROW]
[ROW][C]Winsorized Mean ( 3 / 27 )[/C][C]1419168.28915663[/C][C]29020.2931281553[/C][C]48.9026173129781[/C][/ROW]
[ROW][C]Winsorized Mean ( 4 / 27 )[/C][C]1419485.25301205[/C][C]28958.5799599742[/C][C]49.0177783224876[/C][/ROW]
[ROW][C]Winsorized Mean ( 5 / 27 )[/C][C]1418172.84337349[/C][C]28722.1070426933[/C][C]49.3756548315026[/C][/ROW]
[ROW][C]Winsorized Mean ( 6 / 27 )[/C][C]1418088.48192771[/C][C]28435.0184784575[/C][C]49.8711995915199[/C][/ROW]
[ROW][C]Winsorized Mean ( 7 / 27 )[/C][C]1418463.02409639[/C][C]28298.9018902854[/C][C]50.1243132894611[/C][/ROW]
[ROW][C]Winsorized Mean ( 8 / 27 )[/C][C]1416564.13253012[/C][C]27974.259807011[/C][C]50.6381274179449[/C][/ROW]
[ROW][C]Winsorized Mean ( 9 / 27 )[/C][C]1416669.96385542[/C][C]27933.2977456413[/C][C]50.7161731047842[/C][/ROW]
[ROW][C]Winsorized Mean ( 10 / 27 )[/C][C]1416370.68674699[/C][C]27832.3024289195[/C][C]50.8894544518635[/C][/ROW]
[ROW][C]Winsorized Mean ( 11 / 27 )[/C][C]1414213.09638554[/C][C]27507.9038643206[/C][C]51.4111545307479[/C][/ROW]
[ROW][C]Winsorized Mean ( 12 / 27 )[/C][C]1414861.24096386[/C][C]26531.8160765835[/C][C]53.3269655149082[/C][/ROW]
[ROW][C]Winsorized Mean ( 13 / 27 )[/C][C]1416933.87951807[/C][C]26186.1748556185[/C][C]54.1099983991765[/C][/ROW]
[ROW][C]Winsorized Mean ( 14 / 27 )[/C][C]1412884.5060241[/C][C]25548.0986846102[/C][C]55.3029218912168[/C][/ROW]
[ROW][C]Winsorized Mean ( 15 / 27 )[/C][C]1420652.51807229[/C][C]24030.866509956[/C][C]59.1178232163918[/C][/ROW]
[ROW][C]Winsorized Mean ( 16 / 27 )[/C][C]1416319.98795181[/C][C]23180.2755705966[/C][C]61.1002221970287[/C][/ROW]
[ROW][C]Winsorized Mean ( 17 / 27 )[/C][C]1415151.28915663[/C][C]22836.2828393879[/C][C]61.9694237941292[/C][/ROW]
[ROW][C]Winsorized Mean ( 18 / 27 )[/C][C]1415420.20481928[/C][C]22085.5072577834[/C][C]64.0881908800374[/C][/ROW]
[ROW][C]Winsorized Mean ( 19 / 27 )[/C][C]1417637.25301205[/C][C]21448.8845614683[/C][C]66.0937518195588[/C][/ROW]
[ROW][C]Winsorized Mean ( 20 / 27 )[/C][C]1417708.3373494[/C][C]21004.9673159878[/C][C]67.4939558830122[/C][/ROW]
[ROW][C]Winsorized Mean ( 21 / 27 )[/C][C]1417810.55421687[/C][C]20584.1955472145[/C][C]68.8785991643347[/C][/ROW]
[ROW][C]Winsorized Mean ( 22 / 27 )[/C][C]1424009.25301205[/C][C]19621.9110149044[/C][C]72.5724039789192[/C][/ROW]
[ROW][C]Winsorized Mean ( 23 / 27 )[/C][C]1424945.3253012[/C][C]19336.2483151721[/C][C]73.692957500092[/C][/ROW]
[ROW][C]Winsorized Mean ( 24 / 27 )[/C][C]1431309.6626506[/C][C]17585.9877182609[/C][C]81.3892108638495[/C][/ROW]
[ROW][C]Winsorized Mean ( 25 / 27 )[/C][C]1433572.31325301[/C][C]16630.1178609572[/C][C]86.2033766230021[/C][/ROW]
[ROW][C]Winsorized Mean ( 26 / 27 )[/C][C]1432152.02409639[/C][C]16255.8394388383[/C][C]88.1007732319685[/C][/ROW]
[ROW][C]Winsorized Mean ( 27 / 27 )[/C][C]1432121.77108434[/C][C]16130.0630502151[/C][C]88.7858755806435[/C][/ROW]
[ROW][C]Trimmed Mean ( 1 / 27 )[/C][C]1420202.27160494[/C][C]29224.5128619488[/C][C]48.5962684241722[/C][/ROW]
[ROW][C]Trimmed Mean ( 2 / 27 )[/C][C]1419615.36708861[/C][C]28820.7888219894[/C][C]49.2566451201879[/C][/ROW]
[ROW][C]Trimmed Mean ( 3 / 27 )[/C][C]1419487.01298701[/C][C]28458.132269898[/C][C]49.8798374933585[/C][/ROW]
[ROW][C]Trimmed Mean ( 4 / 27 )[/C][C]1419604.58666667[/C][C]28183.7127859342[/C][C]50.3696797313076[/C][/ROW]
[ROW][C]Trimmed Mean ( 5 / 27 )[/C][C]1419638.50684932[/C][C]27874.0964918663[/C][C]50.9303864705918[/C][/ROW]
[ROW][C]Trimmed Mean ( 6 / 27 )[/C][C]1419981.18309859[/C][C]27569.1794232865[/C][C]51.506109822739[/C][/ROW]
[ROW][C]Trimmed Mean ( 7 / 27 )[/C][C]1419981.18309859[/C][C]27272.4805302408[/C][C]52.066447770457[/C][/ROW]
[ROW][C]Trimmed Mean ( 8 / 27 )[/C][C]1420696.46268657[/C][C]26941.6554699331[/C][C]52.7323372638355[/C][/ROW]
[ROW][C]Trimmed Mean ( 9 / 27 )[/C][C]1421356.04615385[/C][C]26606.8623728558[/C][C]53.4206561538765[/C][/ROW]
[ROW][C]Trimmed Mean ( 10 / 27 )[/C][C]1422042.01587302[/C][C]26203.2420064481[/C][C]54.2696974490058[/C][/ROW]
[ROW][C]Trimmed Mean ( 11 / 27 )[/C][C]1422813.68852459[/C][C]25727.4852138044[/C][C]55.3032555145017[/C][/ROW]
[ROW][C]Trimmed Mean ( 12 / 27 )[/C][C]1423913.61016949[/C][C]25205.1147971377[/C][C]56.4930420523692[/C][/ROW]
[ROW][C]Trimmed Mean ( 13 / 27 )[/C][C]1425012.07017544[/C][C]24749.8104731593[/C][C]57.5766861617319[/C][/ROW]
[ROW][C]Trimmed Mean ( 14 / 27 )[/C][C]1425012.07017544[/C][C]24247.6790963935[/C][C]58.7690089641359[/C][/ROW]
[ROW][C]Trimmed Mean ( 15 / 27 )[/C][C]1427411.30188679[/C][C]23734.3443100744[/C][C]60.1411727764017[/C][/ROW]
[ROW][C]Trimmed Mean ( 16 / 27 )[/C][C]1428144.60784314[/C][C]23378.4269685869[/C][C]61.0881394955317[/C][/ROW]
[ROW][C]Trimmed Mean ( 17 / 27 )[/C][C]1429396.44897959[/C][C]23066.7877633317[/C][C]61.967728824897[/C][/ROW]
[ROW][C]Trimmed Mean ( 18 / 27 )[/C][C]1430876.23404255[/C][C]22711.4661089087[/C][C]63.0023718936086[/C][/ROW]
[ROW][C]Trimmed Mean ( 19 / 27 )[/C][C]1432460[/C][C]22377.5205011817[/C][C]64.013347677387[/C][/ROW]
[ROW][C]Trimmed Mean ( 20 / 27 )[/C][C]1433965.86046512[/C][C]22046.736687518[/C][C]65.0420912985718[/C][/ROW]
[ROW][C]Trimmed Mean ( 21 / 27 )[/C][C]1435611.43902439[/C][C]21673.3189467966[/C][C]66.2386523517009[/C][/ROW]
[ROW][C]Trimmed Mean ( 22 / 27 )[/C][C]1437415.43589744[/C][C]21236.1598297377[/C][C]67.6871641305213[/C][/ROW]
[ROW][C]Trimmed Mean ( 23 / 27 )[/C][C]1438782.40540541[/C][C]20846.6673216514[/C][C]69.0173821650179[/C][/ROW]
[ROW][C]Trimmed Mean ( 24 / 27 )[/C][C]1440209.08571429[/C][C]20346.413293375[/C][C]70.7844210646814[/C][/ROW]
[ROW][C]Trimmed Mean ( 25 / 27 )[/C][C]1441141.72727273[/C][C]20065.0658496243[/C][C]71.8234237591457[/C][/ROW]
[ROW][C]Trimmed Mean ( 26 / 27 )[/C][C]1441952.38709677[/C][C]19855.8637772634[/C][C]72.6209850788726[/C][/ROW]
[ROW][C]Trimmed Mean ( 27 / 27 )[/C][C]1443031.20689655[/C][C]19578.2556993722[/C][C]73.705810622487[/C][/ROW]
[ROW][C]Median[/C][C]1469445[/C][C][/C][C][/C][/ROW]
[ROW][C]Midrange[/C][C]1435604[/C][C][/C][C][/C][/ROW]
[ROW][C]Midmean - Weighted Average at Xnp[/C][C]1429311.71428571[/C][C][/C][C][/C][/ROW]
[ROW][C]Midmean - Weighted Average at X(n+1)p[/C][C]1433965.86046512[/C][C][/C][C][/C][/ROW]
[ROW][C]Midmean - Empirical Distribution Function[/C][C]1433965.86046512[/C][C][/C][C][/C][/ROW]
[ROW][C]Midmean - Empirical Distribution Function - Averaging[/C][C]1433965.86046512[/C][C][/C][C][/C][/ROW]
[ROW][C]Midmean - Empirical Distribution Function - Interpolation[/C][C]1435611.43902439[/C][C][/C][C][/C][/ROW]
[ROW][C]Midmean - Closest Observation[/C][C]1429311.71428571[/C][C][/C][C][/C][/ROW]
[ROW][C]Midmean - True Basic - Statistics Graphics Toolkit[/C][C]1433965.86046512[/C][C][/C][C][/C][/ROW]
[ROW][C]Midmean - MS Excel (old versions)[/C][C]1433965.86046512[/C][C][/C][C][/C][/ROW]
[ROW][C]Number of observations[/C][C]83[/C][C][/C][C][/C][/ROW]
[/TABLE]
Source: https://freestatistics.org/blog/index.php?pk=150485&T=1

Globally Unique Identifier (entire table): ba.freestatistics.org/blog/index.php?pk=150485&T=1

As an alternative you can also use a QR Code:  

The GUIDs for individual cells are displayed in the table below:

Central Tendency - Ungrouped Data
MeasureValueS.E.Value/S.E.
Arithmetic Mean1420573.3975903629848.609192664147.5926160720244
Geometric Mean1393892.17969476
Harmonic Mean1366578.1197053
Quadratic Mean1446058.71752907
Winsorized Mean ( 1 / 27 )1420760.8915662729568.180852948948.0503314908726
Winsorized Mean ( 2 / 27 )1419853.5180722929384.170487034348.3203539367837
Winsorized Mean ( 3 / 27 )1419168.2891566329020.293128155348.9026173129781
Winsorized Mean ( 4 / 27 )1419485.2530120528958.579959974249.0177783224876
Winsorized Mean ( 5 / 27 )1418172.8433734928722.107042693349.3756548315026
Winsorized Mean ( 6 / 27 )1418088.4819277128435.018478457549.8711995915199
Winsorized Mean ( 7 / 27 )1418463.0240963928298.901890285450.1243132894611
Winsorized Mean ( 8 / 27 )1416564.1325301227974.25980701150.6381274179449
Winsorized Mean ( 9 / 27 )1416669.9638554227933.297745641350.7161731047842
Winsorized Mean ( 10 / 27 )1416370.6867469927832.302428919550.8894544518635
Winsorized Mean ( 11 / 27 )1414213.0963855427507.903864320651.4111545307479
Winsorized Mean ( 12 / 27 )1414861.2409638626531.816076583553.3269655149082
Winsorized Mean ( 13 / 27 )1416933.8795180726186.174855618554.1099983991765
Winsorized Mean ( 14 / 27 )1412884.506024125548.098684610255.3029218912168
Winsorized Mean ( 15 / 27 )1420652.5180722924030.86650995659.1178232163918
Winsorized Mean ( 16 / 27 )1416319.9879518123180.275570596661.1002221970287
Winsorized Mean ( 17 / 27 )1415151.2891566322836.282839387961.9694237941292
Winsorized Mean ( 18 / 27 )1415420.2048192822085.507257783464.0881908800374
Winsorized Mean ( 19 / 27 )1417637.2530120521448.884561468366.0937518195588
Winsorized Mean ( 20 / 27 )1417708.337349421004.967315987867.4939558830122
Winsorized Mean ( 21 / 27 )1417810.5542168720584.195547214568.8785991643347
Winsorized Mean ( 22 / 27 )1424009.2530120519621.911014904472.5724039789192
Winsorized Mean ( 23 / 27 )1424945.325301219336.248315172173.692957500092
Winsorized Mean ( 24 / 27 )1431309.662650617585.987718260981.3892108638495
Winsorized Mean ( 25 / 27 )1433572.3132530116630.117860957286.2033766230021
Winsorized Mean ( 26 / 27 )1432152.0240963916255.839438838388.1007732319685
Winsorized Mean ( 27 / 27 )1432121.7710843416130.063050215188.7858755806435
Trimmed Mean ( 1 / 27 )1420202.2716049429224.512861948848.5962684241722
Trimmed Mean ( 2 / 27 )1419615.3670886128820.788821989449.2566451201879
Trimmed Mean ( 3 / 27 )1419487.0129870128458.13226989849.8798374933585
Trimmed Mean ( 4 / 27 )1419604.5866666728183.712785934250.3696797313076
Trimmed Mean ( 5 / 27 )1419638.5068493227874.096491866350.9303864705918
Trimmed Mean ( 6 / 27 )1419981.1830985927569.179423286551.506109822739
Trimmed Mean ( 7 / 27 )1419981.1830985927272.480530240852.066447770457
Trimmed Mean ( 8 / 27 )1420696.4626865726941.655469933152.7323372638355
Trimmed Mean ( 9 / 27 )1421356.0461538526606.862372855853.4206561538765
Trimmed Mean ( 10 / 27 )1422042.0158730226203.242006448154.2696974490058
Trimmed Mean ( 11 / 27 )1422813.6885245925727.485213804455.3032555145017
Trimmed Mean ( 12 / 27 )1423913.6101694925205.114797137756.4930420523692
Trimmed Mean ( 13 / 27 )1425012.0701754424749.810473159357.5766861617319
Trimmed Mean ( 14 / 27 )1425012.0701754424247.679096393558.7690089641359
Trimmed Mean ( 15 / 27 )1427411.3018867923734.344310074460.1411727764017
Trimmed Mean ( 16 / 27 )1428144.6078431423378.426968586961.0881394955317
Trimmed Mean ( 17 / 27 )1429396.4489795923066.787763331761.967728824897
Trimmed Mean ( 18 / 27 )1430876.2340425522711.466108908763.0023718936086
Trimmed Mean ( 19 / 27 )143246022377.520501181764.013347677387
Trimmed Mean ( 20 / 27 )1433965.8604651222046.73668751865.0420912985718
Trimmed Mean ( 21 / 27 )1435611.4390243921673.318946796666.2386523517009
Trimmed Mean ( 22 / 27 )1437415.4358974421236.159829737767.6871641305213
Trimmed Mean ( 23 / 27 )1438782.4054054120846.667321651469.0173821650179
Trimmed Mean ( 24 / 27 )1440209.0857142920346.41329337570.7844210646814
Trimmed Mean ( 25 / 27 )1441141.7272727320065.065849624371.8234237591457
Trimmed Mean ( 26 / 27 )1441952.3870967719855.863777263472.6209850788726
Trimmed Mean ( 27 / 27 )1443031.2068965519578.255699372273.705810622487
Median1469445
Midrange1435604
Midmean - Weighted Average at Xnp1429311.71428571
Midmean - Weighted Average at X(n+1)p1433965.86046512
Midmean - Empirical Distribution Function1433965.86046512
Midmean - Empirical Distribution Function - Averaging1433965.86046512
Midmean - Empirical Distribution Function - Interpolation1435611.43902439
Midmean - Closest Observation1429311.71428571
Midmean - True Basic - Statistics Graphics Toolkit1433965.86046512
Midmean - MS Excel (old versions)1433965.86046512
Number of observations83


Parameters (Session):
Parameters (R input):
R code (references can be found in the software module):
geomean <- function(x) {
return(exp(mean(log(x))))
}
harmean <- function(x) {
return(1/mean(1/x))
}
quamean <- function(x) {
return(sqrt(mean(x*x)))
}
winmean <- function(x) {
x <-sort(x[!is.na(x)])
n<-length(x)
denom <- 3
nodenom <- n/denom
if (nodenom>40) denom <- n/40
sqrtn = sqrt(n)
roundnodenom = floor(nodenom)
win <- array(NA,dim=c(roundnodenom,2))
for (j in 1:roundnodenom) {
win[j,1] <- (j*x[j+1]+sum(x[(j+1):(n-j)])+j*x[n-j])/n
win[j,2] <- sd(c(rep(x[j+1],j),x[(j+1):(n-j)],rep(x[n-j],j)))/sqrtn
}
return(win)
}
trimean <- function(x) {
x <-sort(x[!is.na(x)])
n<-length(x)
denom <- 3
nodenom <- n/denom
if (nodenom>40) denom <- n/40
sqrtn = sqrt(n)
roundnodenom = floor(nodenom)
tri <- array(NA,dim=c(roundnodenom,2))
for (j in 1:roundnodenom) {
tri[j,1] <- mean(x,trim=j/n)
tri[j,2] <- sd(x[(j+1):(n-j)]) / sqrt(n-j*2)
}
return(tri)
}
midrange <- function(x) {
return((max(x)+min(x))/2)
}
q1 <- function(data,n,p,i,f) {
np <- n*p;
i <<- floor(np)
f <<- np - i
qvalue <- (1-f)*data[i] + f*data[i+1]
}
q2 <- function(data,n,p,i,f) {
np <- (n+1)*p
i <<- floor(np)
f <<- np - i
qvalue <- (1-f)*data[i] + f*data[i+1]
}
q3 <- function(data,n,p,i,f) {
np <- n*p
i <<- floor(np)
f <<- np - i
if (f==0) {
qvalue <- data[i]
} else {
qvalue <- data[i+1]
}
}
q4 <- function(data,n,p,i,f) {
np <- n*p
i <<- floor(np)
f <<- np - i
if (f==0) {
qvalue <- (data[i]+data[i+1])/2
} else {
qvalue <- data[i+1]
}
}
q5 <- function(data,n,p,i,f) {
np <- (n-1)*p
i <<- floor(np)
f <<- np - i
if (f==0) {
qvalue <- data[i+1]
} else {
qvalue <- data[i+1] + f*(data[i+2]-data[i+1])
}
}
q6 <- function(data,n,p,i,f) {
np <- n*p+0.5
i <<- floor(np)
f <<- np - i
qvalue <- data[i]
}
q7 <- function(data,n,p,i,f) {
np <- (n+1)*p
i <<- floor(np)
f <<- np - i
if (f==0) {
qvalue <- data[i]
} else {
qvalue <- f*data[i] + (1-f)*data[i+1]
}
}
q8 <- function(data,n,p,i,f) {
np <- (n+1)*p
i <<- floor(np)
f <<- np - i
if (f==0) {
qvalue <- data[i]
} else {
if (f == 0.5) {
qvalue <- (data[i]+data[i+1])/2
} else {
if (f < 0.5) {
qvalue <- data[i]
} else {
qvalue <- data[i+1]
}
}
}
}
midmean <- function(x,def) {
x <-sort(x[!is.na(x)])
n<-length(x)
if (def==1) {
qvalue1 <- q1(x,n,0.25,i,f)
qvalue3 <- q1(x,n,0.75,i,f)
}
if (def==2) {
qvalue1 <- q2(x,n,0.25,i,f)
qvalue3 <- q2(x,n,0.75,i,f)
}
if (def==3) {
qvalue1 <- q3(x,n,0.25,i,f)
qvalue3 <- q3(x,n,0.75,i,f)
}
if (def==4) {
qvalue1 <- q4(x,n,0.25,i,f)
qvalue3 <- q4(x,n,0.75,i,f)
}
if (def==5) {
qvalue1 <- q5(x,n,0.25,i,f)
qvalue3 <- q5(x,n,0.75,i,f)
}
if (def==6) {
qvalue1 <- q6(x,n,0.25,i,f)
qvalue3 <- q6(x,n,0.75,i,f)
}
if (def==7) {
qvalue1 <- q7(x,n,0.25,i,f)
qvalue3 <- q7(x,n,0.75,i,f)
}
if (def==8) {
qvalue1 <- q8(x,n,0.25,i,f)
qvalue3 <- q8(x,n,0.75,i,f)
}
midm <- 0
myn <- 0
roundno4 <- round(n/4)
round3no4 <- round(3*n/4)
for (i in 1:n) {
if ((x[i]>=qvalue1) & (x[i]<=qvalue3)){
midm = midm + x[i]
myn = myn + 1
}
}
midm = midm / myn
return(midm)
}
(arm <- mean(x))
sqrtn <- sqrt(length(x))
(armse <- sd(x) / sqrtn)
(armose <- arm / armse)
(geo <- geomean(x))
(har <- harmean(x))
(qua <- quamean(x))
(win <- winmean(x))
(tri <- trimean(x))
(midr <- midrange(x))
midm <- array(NA,dim=8)
for (j in 1:8) midm[j] <- midmean(x,j)
midm
bitmap(file='test1.png')
lb <- win[,1] - 2*win[,2]
ub <- win[,1] + 2*win[,2]
if ((ylimmin == '') | (ylimmax == '')) plot(win[,1],type='b',main=main, xlab='j', pch=19, ylab='Winsorized Mean(j/n)', ylim=c(min(lb),max(ub))) else plot(win[,1],type='l',main=main, xlab='j', pch=19, ylab='Winsorized Mean(j/n)', ylim=c(ylimmin,ylimmax))
lines(ub,lty=3)
lines(lb,lty=3)
grid()
dev.off()
bitmap(file='test2.png')
lb <- tri[,1] - 2*tri[,2]
ub <- tri[,1] + 2*tri[,2]
if ((ylimmin == '') | (ylimmax == '')) plot(tri[,1],type='b',main=main, xlab='j', pch=19, ylab='Trimmed Mean(j/n)', ylim=c(min(lb),max(ub))) else plot(tri[,1],type='l',main=main, xlab='j', pch=19, ylab='Trimmed Mean(j/n)', ylim=c(ylimmin,ylimmax))
lines(ub,lty=3)
lines(lb,lty=3)
grid()
dev.off()
load(file='createtable')
a<-table.start()
a<-table.row.start(a)
a<-table.element(a,'Central Tendency - Ungrouped Data',4,TRUE)
a<-table.row.end(a)
a<-table.row.start(a)
a<-table.element(a,'Measure',header=TRUE)
a<-table.element(a,'Value',header=TRUE)
a<-table.element(a,'S.E.',header=TRUE)
a<-table.element(a,'Value/S.E.',header=TRUE)
a<-table.row.end(a)
a<-table.row.start(a)
a<-table.element(a,hyperlink('arithmetic_mean.htm', 'Arithmetic Mean', 'click to view the definition of the Arithmetic Mean'),header=TRUE)
a<-table.element(a,arm)
a<-table.element(a,hyperlink('arithmetic_mean_standard_error.htm', armse, 'click to view the definition of the Standard Error of the Arithmetic Mean'))
a<-table.element(a,armose)
a<-table.row.end(a)
a<-table.row.start(a)
a<-table.element(a,hyperlink('geometric_mean.htm', 'Geometric Mean', 'click to view the definition of the Geometric Mean'),header=TRUE)
a<-table.element(a,geo)
a<-table.element(a,'')
a<-table.row.end(a)
a<-table.row.start(a)
a<-table.element(a,hyperlink('harmonic_mean.htm', 'Harmonic Mean', 'click to view the definition of the Harmonic Mean'),header=TRUE)
a<-table.element(a,har)
a<-table.element(a,'')
a<-table.row.end(a)
a<-table.row.start(a)
a<-table.element(a,hyperlink('quadratic_mean.htm', 'Quadratic Mean', 'click to view the definition of the Quadratic Mean'),header=TRUE)
a<-table.element(a,qua)
a<-table.element(a,'')
a<-table.row.end(a)
for (j in 1:length(win[,1])) {
a<-table.row.start(a)
mylabel <- paste('Winsorized Mean (',j)
mylabel <- paste(mylabel,'/')
mylabel <- paste(mylabel,length(win[,1]))
mylabel <- paste(mylabel,')')
a<-table.element(a,hyperlink('winsorized_mean.htm', mylabel, 'click to view the definition of the Winsorized Mean'),header=TRUE)
a<-table.element(a,win[j,1])
a<-table.element(a,win[j,2])
a<-table.element(a,win[j,1]/win[j,2])
a<-table.row.end(a)
}
for (j in 1:length(tri[,1])) {
a<-table.row.start(a)
mylabel <- paste('Trimmed Mean (',j)
mylabel <- paste(mylabel,'/')
mylabel <- paste(mylabel,length(tri[,1]))
mylabel <- paste(mylabel,')')
a<-table.element(a,hyperlink('arithmetic_mean.htm', mylabel, 'click to view the definition of the Trimmed Mean'),header=TRUE)
a<-table.element(a,tri[j,1])
a<-table.element(a,tri[j,2])
a<-table.element(a,tri[j,1]/tri[j,2])
a<-table.row.end(a)
}
a<-table.row.start(a)
a<-table.element(a,hyperlink('median_1.htm', 'Median', 'click to view the definition of the Median'),header=TRUE)
a<-table.element(a,median(x))
a<-table.element(a,'')
a<-table.row.end(a)
a<-table.row.start(a)
a<-table.element(a,hyperlink('midrange.htm', 'Midrange', 'click to view the definition of the Midrange'),header=TRUE)
a<-table.element(a,midr)
a<-table.element(a,'')
a<-table.row.end(a)
a<-table.row.start(a)
mymid <- hyperlink('midmean.htm', 'Midmean', 'click to view the definition of the Midmean')
mylabel <- paste(mymid,hyperlink('method_1.htm','Weighted Average at Xnp',''),sep=' - ')
a<-table.element(a,mylabel,header=TRUE)
a<-table.element(a,midm[1])
a<-table.element(a,'')
a<-table.row.end(a)
a<-table.row.start(a)
mymid <- hyperlink('midmean.htm', 'Midmean', 'click to view the definition of the Midmean')
mylabel <- paste(mymid,hyperlink('method_2.htm','Weighted Average at X(n+1)p',''),sep=' - ')
a<-table.element(a,mylabel,header=TRUE)
a<-table.element(a,midm[2])
a<-table.element(a,'')
a<-table.row.end(a)
a<-table.row.start(a)
mymid <- hyperlink('midmean.htm', 'Midmean', 'click to view the definition of the Midmean')
mylabel <- paste(mymid,hyperlink('method_3.htm','Empirical Distribution Function',''),sep=' - ')
a<-table.element(a,mylabel,header=TRUE)
a<-table.element(a,midm[3])
a<-table.element(a,'')
a<-table.row.end(a)
a<-table.row.start(a)
mymid <- hyperlink('midmean.htm', 'Midmean', 'click to view the definition of the Midmean')
mylabel <- paste(mymid,hyperlink('method_4.htm','Empirical Distribution Function - Averaging',''),sep=' - ')
a<-table.element(a,mylabel,header=TRUE)
a<-table.element(a,midm[4])
a<-table.element(a,'')
a<-table.row.end(a)
a<-table.row.start(a)
mymid <- hyperlink('midmean.htm', 'Midmean', 'click to view the definition of the Midmean')
mylabel <- paste(mymid,hyperlink('method_5.htm','Empirical Distribution Function - Interpolation',''),sep=' - ')
a<-table.element(a,mylabel,header=TRUE)
a<-table.element(a,midm[5])
a<-table.element(a,'')
a<-table.row.end(a)
a<-table.row.start(a)
mymid <- hyperlink('midmean.htm', 'Midmean', 'click to view the definition of the Midmean')
mylabel <- paste(mymid,hyperlink('method_6.htm','Closest Observation',''),sep=' - ')
a<-table.element(a,mylabel,header=TRUE)
a<-table.element(a,midm[6])
a<-table.element(a,'')
a<-table.row.end(a)
a<-table.row.start(a)
mymid <- hyperlink('midmean.htm', 'Midmean', 'click to view the definition of the Midmean')
mylabel <- paste(mymid,hyperlink('method_7.htm','True Basic - Statistics Graphics Toolkit',''),sep=' - ')
a<-table.element(a,mylabel,header=TRUE)
a<-table.element(a,midm[7])
a<-table.element(a,'')
a<-table.row.end(a)
a<-table.row.start(a)
mymid <- hyperlink('midmean.htm', 'Midmean', 'click to view the definition of the Midmean')
mylabel <- paste(mymid,hyperlink('method_8.htm','MS Excel (old versions)',''),sep=' - ')
a<-table.element(a,mylabel,header=TRUE)
a<-table.element(a,midm[8])
a<-table.element(a,'')
a<-table.row.end(a)
a<-table.row.start(a)
a<-table.element(a,'Number of observations',header=TRUE)
a<-table.element(a,length(x))
a<-table.element(a,'')
a<-table.row.end(a)
a<-table.end(a)
table.save(a,file='mytable.tab')