| Tabulation of Results | |||||||
| Q2 x Q9 | |||||||
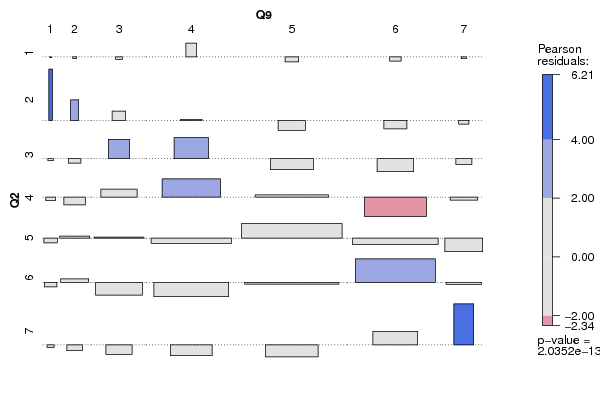
| 1 | 2 | 3 | 4 | 5 | 6 | 7 | 1 | 0 | 0 | 0 | 1 | 0 | 0 | 0 | 2 | 1 | 1 | 1 | 1 | 0 | 0 | 0 | 3 | 0 | 0 | 3 | 6 | 1 | 0 | 0 | 4 | 0 | 0 | 4 | 12 | 11 | 1 | 1 | 5 | 0 | 2 | 5 | 10 | 27 | 11 | 0 | 6 | 0 | 2 | 1 | 5 | 16 | 22 | 2 | 7 | 0 | 0 | 0 | 1 | 2 | 7 | 5 |
| Tabulation of Expected Results | |||||||
| Q2 x Q9 | |||||||
| 1 | 2 | 3 | 4 | 5 | 6 | 7 | 1 | 0.01 | 0.03 | 0.09 | 0.22 | 0.35 | 0.25 | 0.05 | 2 | 0.02 | 0.12 | 0.35 | 0.89 | 1.41 | 1.01 | 0.2 | 3 | 0.06 | 0.31 | 0.86 | 2.22 | 3.52 | 2.53 | 0.49 | 4 | 0.18 | 0.9 | 2.51 | 6.44 | 10.2 | 7.34 | 1.43 | 5 | 0.34 | 1.7 | 4.75 | 12.22 | 19.35 | 13.92 | 2.72 | 6 | 0.3 | 1.48 | 4.15 | 10.67 | 16.89 | 12.15 | 2.37 | 7 | 0.09 | 0.46 | 1.3 | 3.33 | 5.28 | 3.8 | 0.74 |
| Statistical Results | |
| Pearson's Chi-squared test with simulated p-value (based on 2000 replicates) | |
| Exact Pearson Chi Square Statistic | 135.29 |
| P value | 0 |