Free Statistics

of Irreproducible Research!

Author's title

Author*The author of this computation has been verified*
R Software Modulerwasp_autocorrelation.wasp
Title produced by software(Partial) Autocorrelation Function
Date of computationFri, 02 Dec 2011 08:16:51 -0500
Cite this page as followsStatistical Computations at FreeStatistics.org, Office for Research Development and Education, URL https://freestatistics.org/blog/index.php?v=date/2011/Dec/02/t13228318438b1u3ot1kou6bql.htm/, Retrieved Mon, 29 Apr 2024 06:31:24 +0000
Statistical Computations at FreeStatistics.org, Office for Research Development and Education, URL https://freestatistics.org/blog/index.php?pk=150185, Retrieved Mon, 29 Apr 2024 06:31:24 +0000
QR Codes:

Original text written by user:
IsPrivate?No (this computation is public)
User-defined keywords
Estimated Impact70
Family? (F = Feedback message, R = changed R code, M = changed R Module, P = changed Parameters, D = changed Data)
-       [(Partial) Autocorrelation Function] [] [2011-12-02 13:16:51] [cd8b9934e81fda54a97eda68755efa21] [Current]
Feedback Forum

Post a new message
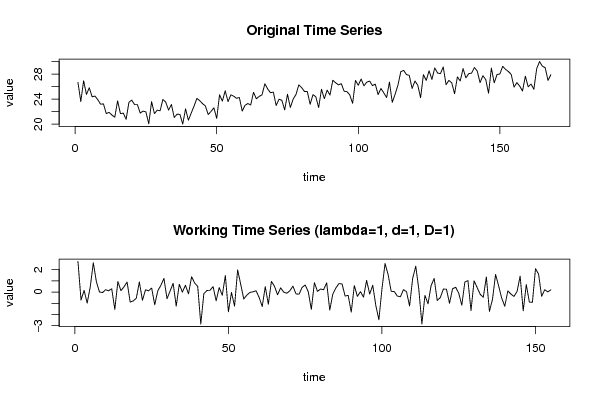
Dataseries X:
26.663
23.598
26.931
24.740
25.806
24.364
24.477
23.901
23.175
23.227
21.672
21.870
21.439
21.089
23.709
21.669
21.752
20.761
23.479
23.824
23.105
23.110
21.759
22.073
21.937
20.035
23.590
21.672
22.222
22.123
23.950
23.504
22.238
23.142
21.059
21.573
21.548
20.000
22.424
20.615
21.761
22.874
24.104
23.748
23.262
22.907
21.519
22.025
22.604
20.894
24.677
23.673
25.320
23.583
24.671
24.454
24.122
24.252
22.084
22.991
23.287
23.049
25.076
24.037
24.430
24.667
26.451
25.618
25.014
25.110
22.964
23.981
23.798
22.270
24.775
22.646
23.988
24.737
26.276
25.816
25.210
25.199
23.162
24.707
24.364
22.644
25.565
24.062
25.431
24.635
27.009
26.606
26.268
26.462
25.246
25.180
24.657
23.304
26.982
26.199
27.210
26.122
26.706
26.878
26.152
26.379
24.712
25.688
24.990
24.239
26.721
23.475
24.767
26.219
28.361
28.599
27.914
27.784
25.693
26.881
26.217
24.218
27.914
26.975
28.527
27.139
28.982
28.169
28.056
29.136
26.291
26.987
26.589
24.848
27.543
26.896
28.878
27.390
28.065
28.141
29.048
28.484
26.634
27.735
27.132
24.924
28.963
26.589
27.931
28.009
29.229
28.759
28.405
27.945
25.912
26.619
26.076
25.286
27.660
25.951
26.398
25.565
28.865
30.000
29.261
29.012
26.992
27.897


Summary of computational transaction
Raw Inputview raw input (R code)
Raw Outputview raw output of R engine
Computing time1 seconds
R Server'Gwilym Jenkins' @ jenkins.wessa.net

\begin{tabular}{lllllllll}
\hline
Summary of computational transaction \tabularnewline
Raw Input & view raw input (R code)  \tabularnewline
Raw Output & view raw output of R engine  \tabularnewline
Computing time & 1 seconds \tabularnewline
R Server & 'Gwilym Jenkins' @ jenkins.wessa.net \tabularnewline
\hline
\end{tabular}
%Source: https://freestatistics.org/blog/index.php?pk=150185&T=0

[TABLE]
[ROW][C]Summary of computational transaction[/C][/ROW]
[ROW][C]Raw Input[/C][C]view raw input (R code) [/C][/ROW]
[ROW][C]Raw Output[/C][C]view raw output of R engine [/C][/ROW]
[ROW][C]Computing time[/C][C]1 seconds[/C][/ROW]
[ROW][C]R Server[/C][C]'Gwilym Jenkins' @ jenkins.wessa.net[/C][/ROW]
[/TABLE]
Source: https://freestatistics.org/blog/index.php?pk=150185&T=0

Globally Unique Identifier (entire table): ba.freestatistics.org/blog/index.php?pk=150185&T=0

As an alternative you can also use a QR Code:  

The GUIDs for individual cells are displayed in the table below:

Summary of computational transaction
Raw Inputview raw input (R code)
Raw Outputview raw output of R engine
Computing time1 seconds
R Server'Gwilym Jenkins' @ jenkins.wessa.net


Autocorrelation Function
Time lag kACF(k)T-STATP-value
1-0.083961-1.04530.148753
2-0.205108-2.55360.005814
3-0.193426-2.40810.008604
40.0173220.21570.414771
5-0.027113-0.33750.36808
60.1302951.62220.0534
70.0460320.57310.283707
8-0.103059-1.28310.100691
90.128151.59550.056323
100.0651090.81060.20942
110.0842791.04930.147844
12-0.464914-5.78810
130.0698120.86910.193055
140.0417230.51940.302096
150.0894261.11330.133643
160.0427340.5320.297733
170.0857571.06770.143664
18-0.203766-2.53690.006087
19-0.062551-0.77880.218656
200.1320391.64390.051115
21-0.095816-1.19290.117367
220.1325291.650.050487
230.0457120.56910.285051
24-0.074594-0.92870.177248
25-0.110183-1.37180.086058
260.107551.3390.091268
270.0097390.12130.451824
280.0026340.03280.48694
29-0.036156-0.45010.326622
300.0805791.00320.158664
310.0107670.1340.44677
32-0.055249-0.68780.246289
330.145731.81430.035781
34-0.133647-1.66390.049078
35-0.07492-0.93270.176201
360.0816321.01630.155532
370.0868421.08120.14065
38-0.095271-1.18610.118695
390.0545790.67950.248917
40-0.082762-1.03040.152219
41-0.055659-0.6930.244689
420.0874671.0890.138932
430.0785110.97750.164934
44-0.023616-0.2940.384569
45-0.179539-2.23520.013415
460.0145170.18070.428406
470.0190080.23670.40662
480.1259651.56830.059431
490.0047520.05920.476452
500.066780.83140.203512
51-0.171128-2.13050.017353
520.0622840.77540.219633
530.0658440.81970.206809
54-0.099803-1.24250.107957
55-0.064-0.79680.213396
56-0.019761-0.2460.402994
570.0995631.23960.108507
580.1089831.35680.088404
590.0500670.62330.266992
60-0.230394-2.86840.002351

\begin{tabular}{lllllllll}
\hline
Autocorrelation Function \tabularnewline
Time lag k & ACF(k) & T-STAT & P-value \tabularnewline
1 & -0.083961 & -1.0453 & 0.148753 \tabularnewline
2 & -0.205108 & -2.5536 & 0.005814 \tabularnewline
3 & -0.193426 & -2.4081 & 0.008604 \tabularnewline
4 & 0.017322 & 0.2157 & 0.414771 \tabularnewline
5 & -0.027113 & -0.3375 & 0.36808 \tabularnewline
6 & 0.130295 & 1.6222 & 0.0534 \tabularnewline
7 & 0.046032 & 0.5731 & 0.283707 \tabularnewline
8 & -0.103059 & -1.2831 & 0.100691 \tabularnewline
9 & 0.12815 & 1.5955 & 0.056323 \tabularnewline
10 & 0.065109 & 0.8106 & 0.20942 \tabularnewline
11 & 0.084279 & 1.0493 & 0.147844 \tabularnewline
12 & -0.464914 & -5.7881 & 0 \tabularnewline
13 & 0.069812 & 0.8691 & 0.193055 \tabularnewline
14 & 0.041723 & 0.5194 & 0.302096 \tabularnewline
15 & 0.089426 & 1.1133 & 0.133643 \tabularnewline
16 & 0.042734 & 0.532 & 0.297733 \tabularnewline
17 & 0.085757 & 1.0677 & 0.143664 \tabularnewline
18 & -0.203766 & -2.5369 & 0.006087 \tabularnewline
19 & -0.062551 & -0.7788 & 0.218656 \tabularnewline
20 & 0.132039 & 1.6439 & 0.051115 \tabularnewline
21 & -0.095816 & -1.1929 & 0.117367 \tabularnewline
22 & 0.132529 & 1.65 & 0.050487 \tabularnewline
23 & 0.045712 & 0.5691 & 0.285051 \tabularnewline
24 & -0.074594 & -0.9287 & 0.177248 \tabularnewline
25 & -0.110183 & -1.3718 & 0.086058 \tabularnewline
26 & 0.10755 & 1.339 & 0.091268 \tabularnewline
27 & 0.009739 & 0.1213 & 0.451824 \tabularnewline
28 & 0.002634 & 0.0328 & 0.48694 \tabularnewline
29 & -0.036156 & -0.4501 & 0.326622 \tabularnewline
30 & 0.080579 & 1.0032 & 0.158664 \tabularnewline
31 & 0.010767 & 0.134 & 0.44677 \tabularnewline
32 & -0.055249 & -0.6878 & 0.246289 \tabularnewline
33 & 0.14573 & 1.8143 & 0.035781 \tabularnewline
34 & -0.133647 & -1.6639 & 0.049078 \tabularnewline
35 & -0.07492 & -0.9327 & 0.176201 \tabularnewline
36 & 0.081632 & 1.0163 & 0.155532 \tabularnewline
37 & 0.086842 & 1.0812 & 0.14065 \tabularnewline
38 & -0.095271 & -1.1861 & 0.118695 \tabularnewline
39 & 0.054579 & 0.6795 & 0.248917 \tabularnewline
40 & -0.082762 & -1.0304 & 0.152219 \tabularnewline
41 & -0.055659 & -0.693 & 0.244689 \tabularnewline
42 & 0.087467 & 1.089 & 0.138932 \tabularnewline
43 & 0.078511 & 0.9775 & 0.164934 \tabularnewline
44 & -0.023616 & -0.294 & 0.384569 \tabularnewline
45 & -0.179539 & -2.2352 & 0.013415 \tabularnewline
46 & 0.014517 & 0.1807 & 0.428406 \tabularnewline
47 & 0.019008 & 0.2367 & 0.40662 \tabularnewline
48 & 0.125965 & 1.5683 & 0.059431 \tabularnewline
49 & 0.004752 & 0.0592 & 0.476452 \tabularnewline
50 & 0.06678 & 0.8314 & 0.203512 \tabularnewline
51 & -0.171128 & -2.1305 & 0.017353 \tabularnewline
52 & 0.062284 & 0.7754 & 0.219633 \tabularnewline
53 & 0.065844 & 0.8197 & 0.206809 \tabularnewline
54 & -0.099803 & -1.2425 & 0.107957 \tabularnewline
55 & -0.064 & -0.7968 & 0.213396 \tabularnewline
56 & -0.019761 & -0.246 & 0.402994 \tabularnewline
57 & 0.099563 & 1.2396 & 0.108507 \tabularnewline
58 & 0.108983 & 1.3568 & 0.088404 \tabularnewline
59 & 0.050067 & 0.6233 & 0.266992 \tabularnewline
60 & -0.230394 & -2.8684 & 0.002351 \tabularnewline
\hline
\end{tabular}
%Source: https://freestatistics.org/blog/index.php?pk=150185&T=1

[TABLE]
[ROW][C]Autocorrelation Function[/C][/ROW]
[ROW][C]Time lag k[/C][C]ACF(k)[/C][C]T-STAT[/C][C]P-value[/C][/ROW]
[ROW][C]1[/C][C]-0.083961[/C][C]-1.0453[/C][C]0.148753[/C][/ROW]
[ROW][C]2[/C][C]-0.205108[/C][C]-2.5536[/C][C]0.005814[/C][/ROW]
[ROW][C]3[/C][C]-0.193426[/C][C]-2.4081[/C][C]0.008604[/C][/ROW]
[ROW][C]4[/C][C]0.017322[/C][C]0.2157[/C][C]0.414771[/C][/ROW]
[ROW][C]5[/C][C]-0.027113[/C][C]-0.3375[/C][C]0.36808[/C][/ROW]
[ROW][C]6[/C][C]0.130295[/C][C]1.6222[/C][C]0.0534[/C][/ROW]
[ROW][C]7[/C][C]0.046032[/C][C]0.5731[/C][C]0.283707[/C][/ROW]
[ROW][C]8[/C][C]-0.103059[/C][C]-1.2831[/C][C]0.100691[/C][/ROW]
[ROW][C]9[/C][C]0.12815[/C][C]1.5955[/C][C]0.056323[/C][/ROW]
[ROW][C]10[/C][C]0.065109[/C][C]0.8106[/C][C]0.20942[/C][/ROW]
[ROW][C]11[/C][C]0.084279[/C][C]1.0493[/C][C]0.147844[/C][/ROW]
[ROW][C]12[/C][C]-0.464914[/C][C]-5.7881[/C][C]0[/C][/ROW]
[ROW][C]13[/C][C]0.069812[/C][C]0.8691[/C][C]0.193055[/C][/ROW]
[ROW][C]14[/C][C]0.041723[/C][C]0.5194[/C][C]0.302096[/C][/ROW]
[ROW][C]15[/C][C]0.089426[/C][C]1.1133[/C][C]0.133643[/C][/ROW]
[ROW][C]16[/C][C]0.042734[/C][C]0.532[/C][C]0.297733[/C][/ROW]
[ROW][C]17[/C][C]0.085757[/C][C]1.0677[/C][C]0.143664[/C][/ROW]
[ROW][C]18[/C][C]-0.203766[/C][C]-2.5369[/C][C]0.006087[/C][/ROW]
[ROW][C]19[/C][C]-0.062551[/C][C]-0.7788[/C][C]0.218656[/C][/ROW]
[ROW][C]20[/C][C]0.132039[/C][C]1.6439[/C][C]0.051115[/C][/ROW]
[ROW][C]21[/C][C]-0.095816[/C][C]-1.1929[/C][C]0.117367[/C][/ROW]
[ROW][C]22[/C][C]0.132529[/C][C]1.65[/C][C]0.050487[/C][/ROW]
[ROW][C]23[/C][C]0.045712[/C][C]0.5691[/C][C]0.285051[/C][/ROW]
[ROW][C]24[/C][C]-0.074594[/C][C]-0.9287[/C][C]0.177248[/C][/ROW]
[ROW][C]25[/C][C]-0.110183[/C][C]-1.3718[/C][C]0.086058[/C][/ROW]
[ROW][C]26[/C][C]0.10755[/C][C]1.339[/C][C]0.091268[/C][/ROW]
[ROW][C]27[/C][C]0.009739[/C][C]0.1213[/C][C]0.451824[/C][/ROW]
[ROW][C]28[/C][C]0.002634[/C][C]0.0328[/C][C]0.48694[/C][/ROW]
[ROW][C]29[/C][C]-0.036156[/C][C]-0.4501[/C][C]0.326622[/C][/ROW]
[ROW][C]30[/C][C]0.080579[/C][C]1.0032[/C][C]0.158664[/C][/ROW]
[ROW][C]31[/C][C]0.010767[/C][C]0.134[/C][C]0.44677[/C][/ROW]
[ROW][C]32[/C][C]-0.055249[/C][C]-0.6878[/C][C]0.246289[/C][/ROW]
[ROW][C]33[/C][C]0.14573[/C][C]1.8143[/C][C]0.035781[/C][/ROW]
[ROW][C]34[/C][C]-0.133647[/C][C]-1.6639[/C][C]0.049078[/C][/ROW]
[ROW][C]35[/C][C]-0.07492[/C][C]-0.9327[/C][C]0.176201[/C][/ROW]
[ROW][C]36[/C][C]0.081632[/C][C]1.0163[/C][C]0.155532[/C][/ROW]
[ROW][C]37[/C][C]0.086842[/C][C]1.0812[/C][C]0.14065[/C][/ROW]
[ROW][C]38[/C][C]-0.095271[/C][C]-1.1861[/C][C]0.118695[/C][/ROW]
[ROW][C]39[/C][C]0.054579[/C][C]0.6795[/C][C]0.248917[/C][/ROW]
[ROW][C]40[/C][C]-0.082762[/C][C]-1.0304[/C][C]0.152219[/C][/ROW]
[ROW][C]41[/C][C]-0.055659[/C][C]-0.693[/C][C]0.244689[/C][/ROW]
[ROW][C]42[/C][C]0.087467[/C][C]1.089[/C][C]0.138932[/C][/ROW]
[ROW][C]43[/C][C]0.078511[/C][C]0.9775[/C][C]0.164934[/C][/ROW]
[ROW][C]44[/C][C]-0.023616[/C][C]-0.294[/C][C]0.384569[/C][/ROW]
[ROW][C]45[/C][C]-0.179539[/C][C]-2.2352[/C][C]0.013415[/C][/ROW]
[ROW][C]46[/C][C]0.014517[/C][C]0.1807[/C][C]0.428406[/C][/ROW]
[ROW][C]47[/C][C]0.019008[/C][C]0.2367[/C][C]0.40662[/C][/ROW]
[ROW][C]48[/C][C]0.125965[/C][C]1.5683[/C][C]0.059431[/C][/ROW]
[ROW][C]49[/C][C]0.004752[/C][C]0.0592[/C][C]0.476452[/C][/ROW]
[ROW][C]50[/C][C]0.06678[/C][C]0.8314[/C][C]0.203512[/C][/ROW]
[ROW][C]51[/C][C]-0.171128[/C][C]-2.1305[/C][C]0.017353[/C][/ROW]
[ROW][C]52[/C][C]0.062284[/C][C]0.7754[/C][C]0.219633[/C][/ROW]
[ROW][C]53[/C][C]0.065844[/C][C]0.8197[/C][C]0.206809[/C][/ROW]
[ROW][C]54[/C][C]-0.099803[/C][C]-1.2425[/C][C]0.107957[/C][/ROW]
[ROW][C]55[/C][C]-0.064[/C][C]-0.7968[/C][C]0.213396[/C][/ROW]
[ROW][C]56[/C][C]-0.019761[/C][C]-0.246[/C][C]0.402994[/C][/ROW]
[ROW][C]57[/C][C]0.099563[/C][C]1.2396[/C][C]0.108507[/C][/ROW]
[ROW][C]58[/C][C]0.108983[/C][C]1.3568[/C][C]0.088404[/C][/ROW]
[ROW][C]59[/C][C]0.050067[/C][C]0.6233[/C][C]0.266992[/C][/ROW]
[ROW][C]60[/C][C]-0.230394[/C][C]-2.8684[/C][C]0.002351[/C][/ROW]
[/TABLE]
Source: https://freestatistics.org/blog/index.php?pk=150185&T=1

Globally Unique Identifier (entire table): ba.freestatistics.org/blog/index.php?pk=150185&T=1

As an alternative you can also use a QR Code:  

The GUIDs for individual cells are displayed in the table below:

Autocorrelation Function
Time lag kACF(k)T-STATP-value
1-0.083961-1.04530.148753
2-0.205108-2.55360.005814
3-0.193426-2.40810.008604
40.0173220.21570.414771
5-0.027113-0.33750.36808
60.1302951.62220.0534
70.0460320.57310.283707
8-0.103059-1.28310.100691
90.128151.59550.056323
100.0651090.81060.20942
110.0842791.04930.147844
12-0.464914-5.78810
130.0698120.86910.193055
140.0417230.51940.302096
150.0894261.11330.133643
160.0427340.5320.297733
170.0857571.06770.143664
18-0.203766-2.53690.006087
19-0.062551-0.77880.218656
200.1320391.64390.051115
21-0.095816-1.19290.117367
220.1325291.650.050487
230.0457120.56910.285051
24-0.074594-0.92870.177248
25-0.110183-1.37180.086058
260.107551.3390.091268
270.0097390.12130.451824
280.0026340.03280.48694
29-0.036156-0.45010.326622
300.0805791.00320.158664
310.0107670.1340.44677
32-0.055249-0.68780.246289
330.145731.81430.035781
34-0.133647-1.66390.049078
35-0.07492-0.93270.176201
360.0816321.01630.155532
370.0868421.08120.14065
38-0.095271-1.18610.118695
390.0545790.67950.248917
40-0.082762-1.03040.152219
41-0.055659-0.6930.244689
420.0874671.0890.138932
430.0785110.97750.164934
44-0.023616-0.2940.384569
45-0.179539-2.23520.013415
460.0145170.18070.428406
470.0190080.23670.40662
480.1259651.56830.059431
490.0047520.05920.476452
500.066780.83140.203512
51-0.171128-2.13050.017353
520.0622840.77540.219633
530.0658440.81970.206809
54-0.099803-1.24250.107957
55-0.064-0.79680.213396
56-0.019761-0.2460.402994
570.0995631.23960.108507
580.1089831.35680.088404
590.0500670.62330.266992
60-0.230394-2.86840.002351


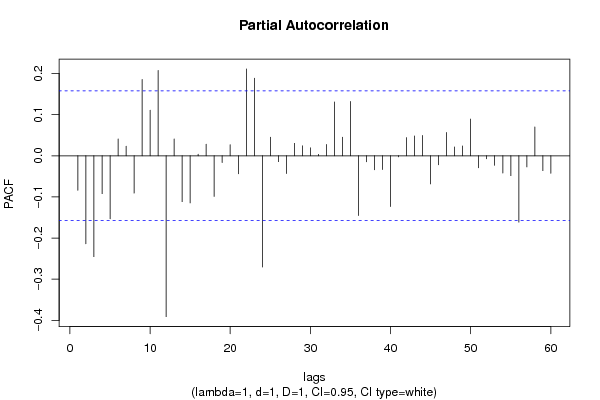
Partial Autocorrelation Function
Time lag kPACF(k)T-STATP-value
1-0.083961-1.04530.148753
2-0.213664-2.66010.004317
3-0.245105-3.05150.00134
4-0.092114-1.14680.126615
5-0.153297-1.90850.029085
60.0407120.50690.306486
70.0231560.28830.386755
8-0.090735-1.12960.130186
90.1855472.310.011102
100.1105771.37670.085299
110.2073342.58130.005385
12-0.391013-4.86811e-06
130.040850.50860.305886
14-0.111545-1.38870.083455
15-0.114536-1.4260.077945
160.0038260.04760.481034
170.0280620.34940.363645
18-0.098736-1.22930.110419
19-0.016377-0.20390.419352
200.0266890.33230.370064
21-0.043849-0.54590.292955
220.2109822.62670.004743
230.1886222.34830.01006
24-0.270461-3.36720.000479
250.0449870.56010.288116
26-0.014297-0.1780.429479
27-0.043239-0.53830.295562
280.0301610.37550.353902
290.0240380.29930.382569
300.019220.23930.405598
310.0033620.04190.483334
320.0273820.34090.366821
330.1306481.62660.052932
340.0450530.56090.287834
350.1319981.64340.051167
36-0.145038-1.80570.036452
37-0.014674-0.18270.427639
38-0.034027-0.42360.336211
39-0.033557-0.41780.338344
40-0.123344-1.53560.063335
41-0.002635-0.03280.486936
420.0441770.550.291557
430.0481290.59920.274956
440.0494020.6150.269712
45-0.068284-0.85010.198282
46-0.021776-0.27110.393335
470.0564120.70230.241767
480.0212660.26480.395771
490.02380.29630.383698
500.0891081.10940.134491
51-0.028973-0.36070.359402
52-0.00735-0.09150.463606
53-0.022952-0.28570.387728
54-0.041845-0.5210.301565
55-0.048352-0.6020.274033
56-0.161358-2.00890.023143
57-0.027037-0.33660.368436
580.0698220.86930.193018
59-0.036149-0.450.326652
60-0.042658-0.53110.298058

\begin{tabular}{lllllllll}
\hline
Partial Autocorrelation Function \tabularnewline
Time lag k & PACF(k) & T-STAT & P-value \tabularnewline
1 & -0.083961 & -1.0453 & 0.148753 \tabularnewline
2 & -0.213664 & -2.6601 & 0.004317 \tabularnewline
3 & -0.245105 & -3.0515 & 0.00134 \tabularnewline
4 & -0.092114 & -1.1468 & 0.126615 \tabularnewline
5 & -0.153297 & -1.9085 & 0.029085 \tabularnewline
6 & 0.040712 & 0.5069 & 0.306486 \tabularnewline
7 & 0.023156 & 0.2883 & 0.386755 \tabularnewline
8 & -0.090735 & -1.1296 & 0.130186 \tabularnewline
9 & 0.185547 & 2.31 & 0.011102 \tabularnewline
10 & 0.110577 & 1.3767 & 0.085299 \tabularnewline
11 & 0.207334 & 2.5813 & 0.005385 \tabularnewline
12 & -0.391013 & -4.8681 & 1e-06 \tabularnewline
13 & 0.04085 & 0.5086 & 0.305886 \tabularnewline
14 & -0.111545 & -1.3887 & 0.083455 \tabularnewline
15 & -0.114536 & -1.426 & 0.077945 \tabularnewline
16 & 0.003826 & 0.0476 & 0.481034 \tabularnewline
17 & 0.028062 & 0.3494 & 0.363645 \tabularnewline
18 & -0.098736 & -1.2293 & 0.110419 \tabularnewline
19 & -0.016377 & -0.2039 & 0.419352 \tabularnewline
20 & 0.026689 & 0.3323 & 0.370064 \tabularnewline
21 & -0.043849 & -0.5459 & 0.292955 \tabularnewline
22 & 0.210982 & 2.6267 & 0.004743 \tabularnewline
23 & 0.188622 & 2.3483 & 0.01006 \tabularnewline
24 & -0.270461 & -3.3672 & 0.000479 \tabularnewline
25 & 0.044987 & 0.5601 & 0.288116 \tabularnewline
26 & -0.014297 & -0.178 & 0.429479 \tabularnewline
27 & -0.043239 & -0.5383 & 0.295562 \tabularnewline
28 & 0.030161 & 0.3755 & 0.353902 \tabularnewline
29 & 0.024038 & 0.2993 & 0.382569 \tabularnewline
30 & 0.01922 & 0.2393 & 0.405598 \tabularnewline
31 & 0.003362 & 0.0419 & 0.483334 \tabularnewline
32 & 0.027382 & 0.3409 & 0.366821 \tabularnewline
33 & 0.130648 & 1.6266 & 0.052932 \tabularnewline
34 & 0.045053 & 0.5609 & 0.287834 \tabularnewline
35 & 0.131998 & 1.6434 & 0.051167 \tabularnewline
36 & -0.145038 & -1.8057 & 0.036452 \tabularnewline
37 & -0.014674 & -0.1827 & 0.427639 \tabularnewline
38 & -0.034027 & -0.4236 & 0.336211 \tabularnewline
39 & -0.033557 & -0.4178 & 0.338344 \tabularnewline
40 & -0.123344 & -1.5356 & 0.063335 \tabularnewline
41 & -0.002635 & -0.0328 & 0.486936 \tabularnewline
42 & 0.044177 & 0.55 & 0.291557 \tabularnewline
43 & 0.048129 & 0.5992 & 0.274956 \tabularnewline
44 & 0.049402 & 0.615 & 0.269712 \tabularnewline
45 & -0.068284 & -0.8501 & 0.198282 \tabularnewline
46 & -0.021776 & -0.2711 & 0.393335 \tabularnewline
47 & 0.056412 & 0.7023 & 0.241767 \tabularnewline
48 & 0.021266 & 0.2648 & 0.395771 \tabularnewline
49 & 0.0238 & 0.2963 & 0.383698 \tabularnewline
50 & 0.089108 & 1.1094 & 0.134491 \tabularnewline
51 & -0.028973 & -0.3607 & 0.359402 \tabularnewline
52 & -0.00735 & -0.0915 & 0.463606 \tabularnewline
53 & -0.022952 & -0.2857 & 0.387728 \tabularnewline
54 & -0.041845 & -0.521 & 0.301565 \tabularnewline
55 & -0.048352 & -0.602 & 0.274033 \tabularnewline
56 & -0.161358 & -2.0089 & 0.023143 \tabularnewline
57 & -0.027037 & -0.3366 & 0.368436 \tabularnewline
58 & 0.069822 & 0.8693 & 0.193018 \tabularnewline
59 & -0.036149 & -0.45 & 0.326652 \tabularnewline
60 & -0.042658 & -0.5311 & 0.298058 \tabularnewline
\hline
\end{tabular}
%Source: https://freestatistics.org/blog/index.php?pk=150185&T=2

[TABLE]
[ROW][C]Partial Autocorrelation Function[/C][/ROW]
[ROW][C]Time lag k[/C][C]PACF(k)[/C][C]T-STAT[/C][C]P-value[/C][/ROW]
[ROW][C]1[/C][C]-0.083961[/C][C]-1.0453[/C][C]0.148753[/C][/ROW]
[ROW][C]2[/C][C]-0.213664[/C][C]-2.6601[/C][C]0.004317[/C][/ROW]
[ROW][C]3[/C][C]-0.245105[/C][C]-3.0515[/C][C]0.00134[/C][/ROW]
[ROW][C]4[/C][C]-0.092114[/C][C]-1.1468[/C][C]0.126615[/C][/ROW]
[ROW][C]5[/C][C]-0.153297[/C][C]-1.9085[/C][C]0.029085[/C][/ROW]
[ROW][C]6[/C][C]0.040712[/C][C]0.5069[/C][C]0.306486[/C][/ROW]
[ROW][C]7[/C][C]0.023156[/C][C]0.2883[/C][C]0.386755[/C][/ROW]
[ROW][C]8[/C][C]-0.090735[/C][C]-1.1296[/C][C]0.130186[/C][/ROW]
[ROW][C]9[/C][C]0.185547[/C][C]2.31[/C][C]0.011102[/C][/ROW]
[ROW][C]10[/C][C]0.110577[/C][C]1.3767[/C][C]0.085299[/C][/ROW]
[ROW][C]11[/C][C]0.207334[/C][C]2.5813[/C][C]0.005385[/C][/ROW]
[ROW][C]12[/C][C]-0.391013[/C][C]-4.8681[/C][C]1e-06[/C][/ROW]
[ROW][C]13[/C][C]0.04085[/C][C]0.5086[/C][C]0.305886[/C][/ROW]
[ROW][C]14[/C][C]-0.111545[/C][C]-1.3887[/C][C]0.083455[/C][/ROW]
[ROW][C]15[/C][C]-0.114536[/C][C]-1.426[/C][C]0.077945[/C][/ROW]
[ROW][C]16[/C][C]0.003826[/C][C]0.0476[/C][C]0.481034[/C][/ROW]
[ROW][C]17[/C][C]0.028062[/C][C]0.3494[/C][C]0.363645[/C][/ROW]
[ROW][C]18[/C][C]-0.098736[/C][C]-1.2293[/C][C]0.110419[/C][/ROW]
[ROW][C]19[/C][C]-0.016377[/C][C]-0.2039[/C][C]0.419352[/C][/ROW]
[ROW][C]20[/C][C]0.026689[/C][C]0.3323[/C][C]0.370064[/C][/ROW]
[ROW][C]21[/C][C]-0.043849[/C][C]-0.5459[/C][C]0.292955[/C][/ROW]
[ROW][C]22[/C][C]0.210982[/C][C]2.6267[/C][C]0.004743[/C][/ROW]
[ROW][C]23[/C][C]0.188622[/C][C]2.3483[/C][C]0.01006[/C][/ROW]
[ROW][C]24[/C][C]-0.270461[/C][C]-3.3672[/C][C]0.000479[/C][/ROW]
[ROW][C]25[/C][C]0.044987[/C][C]0.5601[/C][C]0.288116[/C][/ROW]
[ROW][C]26[/C][C]-0.014297[/C][C]-0.178[/C][C]0.429479[/C][/ROW]
[ROW][C]27[/C][C]-0.043239[/C][C]-0.5383[/C][C]0.295562[/C][/ROW]
[ROW][C]28[/C][C]0.030161[/C][C]0.3755[/C][C]0.353902[/C][/ROW]
[ROW][C]29[/C][C]0.024038[/C][C]0.2993[/C][C]0.382569[/C][/ROW]
[ROW][C]30[/C][C]0.01922[/C][C]0.2393[/C][C]0.405598[/C][/ROW]
[ROW][C]31[/C][C]0.003362[/C][C]0.0419[/C][C]0.483334[/C][/ROW]
[ROW][C]32[/C][C]0.027382[/C][C]0.3409[/C][C]0.366821[/C][/ROW]
[ROW][C]33[/C][C]0.130648[/C][C]1.6266[/C][C]0.052932[/C][/ROW]
[ROW][C]34[/C][C]0.045053[/C][C]0.5609[/C][C]0.287834[/C][/ROW]
[ROW][C]35[/C][C]0.131998[/C][C]1.6434[/C][C]0.051167[/C][/ROW]
[ROW][C]36[/C][C]-0.145038[/C][C]-1.8057[/C][C]0.036452[/C][/ROW]
[ROW][C]37[/C][C]-0.014674[/C][C]-0.1827[/C][C]0.427639[/C][/ROW]
[ROW][C]38[/C][C]-0.034027[/C][C]-0.4236[/C][C]0.336211[/C][/ROW]
[ROW][C]39[/C][C]-0.033557[/C][C]-0.4178[/C][C]0.338344[/C][/ROW]
[ROW][C]40[/C][C]-0.123344[/C][C]-1.5356[/C][C]0.063335[/C][/ROW]
[ROW][C]41[/C][C]-0.002635[/C][C]-0.0328[/C][C]0.486936[/C][/ROW]
[ROW][C]42[/C][C]0.044177[/C][C]0.55[/C][C]0.291557[/C][/ROW]
[ROW][C]43[/C][C]0.048129[/C][C]0.5992[/C][C]0.274956[/C][/ROW]
[ROW][C]44[/C][C]0.049402[/C][C]0.615[/C][C]0.269712[/C][/ROW]
[ROW][C]45[/C][C]-0.068284[/C][C]-0.8501[/C][C]0.198282[/C][/ROW]
[ROW][C]46[/C][C]-0.021776[/C][C]-0.2711[/C][C]0.393335[/C][/ROW]
[ROW][C]47[/C][C]0.056412[/C][C]0.7023[/C][C]0.241767[/C][/ROW]
[ROW][C]48[/C][C]0.021266[/C][C]0.2648[/C][C]0.395771[/C][/ROW]
[ROW][C]49[/C][C]0.0238[/C][C]0.2963[/C][C]0.383698[/C][/ROW]
[ROW][C]50[/C][C]0.089108[/C][C]1.1094[/C][C]0.134491[/C][/ROW]
[ROW][C]51[/C][C]-0.028973[/C][C]-0.3607[/C][C]0.359402[/C][/ROW]
[ROW][C]52[/C][C]-0.00735[/C][C]-0.0915[/C][C]0.463606[/C][/ROW]
[ROW][C]53[/C][C]-0.022952[/C][C]-0.2857[/C][C]0.387728[/C][/ROW]
[ROW][C]54[/C][C]-0.041845[/C][C]-0.521[/C][C]0.301565[/C][/ROW]
[ROW][C]55[/C][C]-0.048352[/C][C]-0.602[/C][C]0.274033[/C][/ROW]
[ROW][C]56[/C][C]-0.161358[/C][C]-2.0089[/C][C]0.023143[/C][/ROW]
[ROW][C]57[/C][C]-0.027037[/C][C]-0.3366[/C][C]0.368436[/C][/ROW]
[ROW][C]58[/C][C]0.069822[/C][C]0.8693[/C][C]0.193018[/C][/ROW]
[ROW][C]59[/C][C]-0.036149[/C][C]-0.45[/C][C]0.326652[/C][/ROW]
[ROW][C]60[/C][C]-0.042658[/C][C]-0.5311[/C][C]0.298058[/C][/ROW]
[/TABLE]
Source: https://freestatistics.org/blog/index.php?pk=150185&T=2

Globally Unique Identifier (entire table): ba.freestatistics.org/blog/index.php?pk=150185&T=2

As an alternative you can also use a QR Code:  

The GUIDs for individual cells are displayed in the table below:

Partial Autocorrelation Function
Time lag kPACF(k)T-STATP-value
1-0.083961-1.04530.148753
2-0.213664-2.66010.004317
3-0.245105-3.05150.00134
4-0.092114-1.14680.126615
5-0.153297-1.90850.029085
60.0407120.50690.306486
70.0231560.28830.386755
8-0.090735-1.12960.130186
90.1855472.310.011102
100.1105771.37670.085299
110.2073342.58130.005385
12-0.391013-4.86811e-06
130.040850.50860.305886
14-0.111545-1.38870.083455
15-0.114536-1.4260.077945
160.0038260.04760.481034
170.0280620.34940.363645
18-0.098736-1.22930.110419
19-0.016377-0.20390.419352
200.0266890.33230.370064
21-0.043849-0.54590.292955
220.2109822.62670.004743
230.1886222.34830.01006
24-0.270461-3.36720.000479
250.0449870.56010.288116
26-0.014297-0.1780.429479
27-0.043239-0.53830.295562
280.0301610.37550.353902
290.0240380.29930.382569
300.019220.23930.405598
310.0033620.04190.483334
320.0273820.34090.366821
330.1306481.62660.052932
340.0450530.56090.287834
350.1319981.64340.051167
36-0.145038-1.80570.036452
37-0.014674-0.18270.427639
38-0.034027-0.42360.336211
39-0.033557-0.41780.338344
40-0.123344-1.53560.063335
41-0.002635-0.03280.486936
420.0441770.550.291557
430.0481290.59920.274956
440.0494020.6150.269712
45-0.068284-0.85010.198282
46-0.021776-0.27110.393335
470.0564120.70230.241767
480.0212660.26480.395771
490.02380.29630.383698
500.0891081.10940.134491
51-0.028973-0.36070.359402
52-0.00735-0.09150.463606
53-0.022952-0.28570.387728
54-0.041845-0.5210.301565
55-0.048352-0.6020.274033
56-0.161358-2.00890.023143
57-0.027037-0.33660.368436
580.0698220.86930.193018
59-0.036149-0.450.326652
60-0.042658-0.53110.298058


Parameters (Session):
par1 = 60 ; par2 = 1 ; par3 = 1 ; par4 = 1 ; par5 = 12 ; par6 = White Noise ; par7 = 0.95 ;
Parameters (R input):
par1 = 60 ; par2 = 1 ; par3 = 1 ; par4 = 1 ; par5 = 12 ; par6 = White Noise ; par7 = 0.95 ; par8 = ;
R code (references can be found in the software module):
if (par1 == 'Default') {
par1 = 10*log10(length(x))
} else {
par1 <- as.numeric(par1)
}
par2 <- as.numeric(par2)
par3 <- as.numeric(par3)
par4 <- as.numeric(par4)
par5 <- as.numeric(par5)
if (par6 == 'White Noise') par6 <- 'white' else par6 <- 'ma'
par7 <- as.numeric(par7)
if (par8 != '') par8 <- as.numeric(par8)
ox <- x
if (par8 == '') {
if (par2 == 0) {
x <- log(x)
} else {
x <- (x ^ par2 - 1) / par2
}
} else {
x <- log(x,base=par8)
}
if (par3 > 0) x <- diff(x,lag=1,difference=par3)
if (par4 > 0) x <- diff(x,lag=par5,difference=par4)
bitmap(file='picts.png')
op <- par(mfrow=c(2,1))
plot(ox,type='l',main='Original Time Series',xlab='time',ylab='value')
if (par8=='') {
mytitle <- paste('Working Time Series (lambda=',par2,', d=',par3,', D=',par4,')',sep='')
mysub <- paste('(lambda=',par2,', d=',par3,', D=',par4,', CI=', par7, ', CI type=',par6,')',sep='')
} else {
mytitle <- paste('Working Time Series (base=',par8,', d=',par3,', D=',par4,')',sep='')
mysub <- paste('(base=',par8,', d=',par3,', D=',par4,', CI=', par7, ', CI type=',par6,')',sep='')
}
plot(x,type='l', main=mytitle,xlab='time',ylab='value')
par(op)
dev.off()
bitmap(file='pic1.png')
racf <- acf(x, par1, main='Autocorrelation', xlab='time lag', ylab='ACF', ci.type=par6, ci=par7, sub=mysub)
dev.off()
bitmap(file='pic2.png')
rpacf <- pacf(x,par1,main='Partial Autocorrelation',xlab='lags',ylab='PACF',sub=mysub)
dev.off()
(myacf <- c(racf$acf))
(mypacf <- c(rpacf$acf))
lengthx <- length(x)
sqrtn <- sqrt(lengthx)
load(file='createtable')
a<-table.start()
a<-table.row.start(a)
a<-table.element(a,'Autocorrelation Function',4,TRUE)
a<-table.row.end(a)
a<-table.row.start(a)
a<-table.element(a,'Time lag k',header=TRUE)
a<-table.element(a,hyperlink('basics.htm','ACF(k)','click here for more information about the Autocorrelation Function'),header=TRUE)
a<-table.element(a,'T-STAT',header=TRUE)
a<-table.element(a,'P-value',header=TRUE)
a<-table.row.end(a)
for (i in 2:(par1+1)) {
a<-table.row.start(a)
a<-table.element(a,i-1,header=TRUE)
a<-table.element(a,round(myacf[i],6))
mytstat <- myacf[i]*sqrtn
a<-table.element(a,round(mytstat,4))
a<-table.element(a,round(1-pt(abs(mytstat),lengthx),6))
a<-table.row.end(a)
}
a<-table.end(a)
table.save(a,file='mytable.tab')
a<-table.start()
a<-table.row.start(a)
a<-table.element(a,'Partial Autocorrelation Function',4,TRUE)
a<-table.row.end(a)
a<-table.row.start(a)
a<-table.element(a,'Time lag k',header=TRUE)
a<-table.element(a,hyperlink('basics.htm','PACF(k)','click here for more information about the Partial Autocorrelation Function'),header=TRUE)
a<-table.element(a,'T-STAT',header=TRUE)
a<-table.element(a,'P-value',header=TRUE)
a<-table.row.end(a)
for (i in 1:par1) {
a<-table.row.start(a)
a<-table.element(a,i,header=TRUE)
a<-table.element(a,round(mypacf[i],6))
mytstat <- mypacf[i]*sqrtn
a<-table.element(a,round(mytstat,4))
a<-table.element(a,round(1-pt(abs(mytstat),lengthx),6))
a<-table.row.end(a)
}
a<-table.end(a)
table.save(a,file='mytable1.tab')