Free Statistics

of Irreproducible Research!

Author's title

Author*The author of this computation has been verified*
R Software Modulerwasp_autocorrelation.wasp
Title produced by software(Partial) Autocorrelation Function
Date of computationFri, 02 Dec 2011 08:07:34 -0500
Cite this page as followsStatistical Computations at FreeStatistics.org, Office for Research Development and Education, URL https://freestatistics.org/blog/index.php?v=date/2011/Dec/02/t132283128521hmhp23pefykr0.htm/, Retrieved Sun, 28 Apr 2024 19:43:16 +0000
Statistical Computations at FreeStatistics.org, Office for Research Development and Education, URL https://freestatistics.org/blog/index.php?pk=150174, Retrieved Sun, 28 Apr 2024 19:43:16 +0000
QR Codes:

Original text written by user:
IsPrivate?No (this computation is public)
User-defined keywords
Estimated Impact78
Family? (F = Feedback message, R = changed R code, M = changed R Module, P = changed Parameters, D = changed Data)
-       [(Partial) Autocorrelation Function] [Autocorrelation] [2011-12-02 13:07:34] [cd8b9934e81fda54a97eda68755efa21] [Current]
Feedback Forum

Post a new message
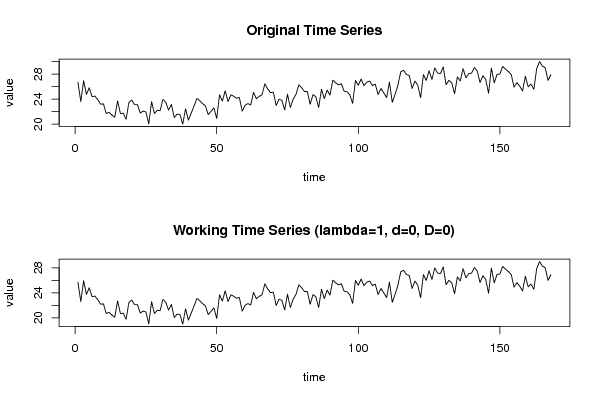
Dataseries X:
26.663
23.598
26.931
24.740
25.806
24.364
24.477
23.901
23.175
23.227
21.672
21.870
21.439
21.089
23.709
21.669
21.752
20.761
23.479
23.824
23.105
23.110
21.759
22.073
21.937
20.035
23.590
21.672
22.222
22.123
23.950
23.504
22.238
23.142
21.059
21.573
21.548
20.000
22.424
20.615
21.761
22.874
24.104
23.748
23.262
22.907
21.519
22.025
22.604
20.894
24.677
23.673
25.320
23.583
24.671
24.454
24.122
24.252
22.084
22.991
23.287
23.049
25.076
24.037
24.430
24.667
26.451
25.618
25.014
25.110
22.964
23.981
23.798
22.270
24.775
22.646
23.988
24.737
26.276
25.816
25.210
25.199
23.162
24.707
24.364
22.644
25.565
24.062
25.431
24.635
27.009
26.606
26.268
26.462
25.246
25.180
24.657
23.304
26.982
26.199
27.210
26.122
26.706
26.878
26.152
26.379
24.712
25.688
24.990
24.239
26.721
23.475
24.767
26.219
28.361
28.599
27.914
27.784
25.693
26.881
26.217
24.218
27.914
26.975
28.527
27.139
28.982
28.169
28.056
29.136
26.291
26.987
26.589
24.848
27.543
26.896
28.878
27.390
28.065
28.141
29.048
28.484
26.634
27.735
27.132
24.924
28.963
26.589
27.931
28.009
29.229
28.759
28.405
27.945
25.912
26.619
26.076
25.286
27.660
25.951
26.398
25.565
28.865
30.000
29.261
29.012
26.992
27.897


Summary of computational transaction
Raw Inputview raw input (R code)
Raw Outputview raw output of R engine
Computing time2 seconds
R Server'AstonUniversity' @ aston.wessa.net

\begin{tabular}{lllllllll}
\hline
Summary of computational transaction \tabularnewline
Raw Input & view raw input (R code)  \tabularnewline
Raw Output & view raw output of R engine  \tabularnewline
Computing time & 2 seconds \tabularnewline
R Server & 'AstonUniversity' @ aston.wessa.net \tabularnewline
\hline
\end{tabular}
%Source: https://freestatistics.org/blog/index.php?pk=150174&T=0

[TABLE]
[ROW][C]Summary of computational transaction[/C][/ROW]
[ROW][C]Raw Input[/C][C]view raw input (R code) [/C][/ROW]
[ROW][C]Raw Output[/C][C]view raw output of R engine [/C][/ROW]
[ROW][C]Computing time[/C][C]2 seconds[/C][/ROW]
[ROW][C]R Server[/C][C]'AstonUniversity' @ aston.wessa.net[/C][/ROW]
[/TABLE]
Source: https://freestatistics.org/blog/index.php?pk=150174&T=0

Globally Unique Identifier (entire table): ba.freestatistics.org/blog/index.php?pk=150174&T=0

As an alternative you can also use a QR Code:  

The GUIDs for individual cells are displayed in the table below:

Summary of computational transaction
Raw Inputview raw input (R code)
Raw Outputview raw output of R engine
Computing time2 seconds
R Server'AstonUniversity' @ aston.wessa.net


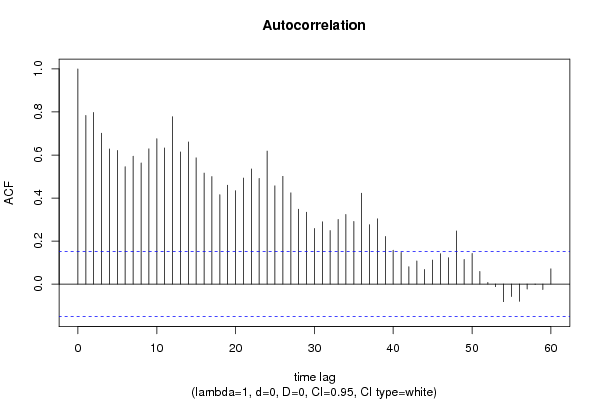
Autocorrelation Function
Time lag kACF(k)T-STATP-value
10.78339710.1540
20.79767410.3390
30.7009499.08530
40.6285178.14650
50.6210698.050
60.545337.06830
70.5941157.70060
80.5628047.29480
90.6286318.1480
100.6755078.75560
110.632548.19870
120.77805110.08470
130.6145597.96560
140.6606228.56260
150.5867137.60470
160.5160536.68880
170.4997916.4780
180.4154975.38550
190.4594855.95560
200.4343035.62920
210.4927656.3870
220.5348716.93270
230.4907116.36030
240.6182578.01350
250.4567745.92050
260.5008276.49150
270.4242415.49880
280.3482014.51326e-06
290.3344744.33531.3e-05
300.258643.35240.000495
310.2894643.75190.000121
320.2487753.22450.000758
330.3007863.89867e-05
340.323974.19912.2e-05
350.291033.77220.000112
360.4226965.47880
370.2764843.58360.000222
380.303263.93076.2e-05
390.2217272.87390.002289
400.1571652.03710.021605
410.1466871.90130.029489
420.0804571.04280.149261
430.1076561.39540.082371
440.0677290.87790.190634
450.1115711.44610.075002
460.1410771.82860.034619
470.1224051.58650.057248
480.2469273.20050.00082
490.1148131.48810.069293
500.1425631.84780.033193
510.0583460.75620.22528
520.0080780.10470.458366
53-0.01181-0.15310.439262
54-0.081389-1.05490.146489
55-0.057459-0.74480.228729
56-0.079429-1.02950.152358
57-0.022874-0.29650.383613
58-0.00142-0.01840.492668
59-0.025178-0.32630.372288
600.0710040.92030.179363

\begin{tabular}{lllllllll}
\hline
Autocorrelation Function \tabularnewline
Time lag k & ACF(k) & T-STAT & P-value \tabularnewline
1 & 0.783397 & 10.154 & 0 \tabularnewline
2 & 0.797674 & 10.339 & 0 \tabularnewline
3 & 0.700949 & 9.0853 & 0 \tabularnewline
4 & 0.628517 & 8.1465 & 0 \tabularnewline
5 & 0.621069 & 8.05 & 0 \tabularnewline
6 & 0.54533 & 7.0683 & 0 \tabularnewline
7 & 0.594115 & 7.7006 & 0 \tabularnewline
8 & 0.562804 & 7.2948 & 0 \tabularnewline
9 & 0.628631 & 8.148 & 0 \tabularnewline
10 & 0.675507 & 8.7556 & 0 \tabularnewline
11 & 0.63254 & 8.1987 & 0 \tabularnewline
12 & 0.778051 & 10.0847 & 0 \tabularnewline
13 & 0.614559 & 7.9656 & 0 \tabularnewline
14 & 0.660622 & 8.5626 & 0 \tabularnewline
15 & 0.586713 & 7.6047 & 0 \tabularnewline
16 & 0.516053 & 6.6888 & 0 \tabularnewline
17 & 0.499791 & 6.478 & 0 \tabularnewline
18 & 0.415497 & 5.3855 & 0 \tabularnewline
19 & 0.459485 & 5.9556 & 0 \tabularnewline
20 & 0.434303 & 5.6292 & 0 \tabularnewline
21 & 0.492765 & 6.387 & 0 \tabularnewline
22 & 0.534871 & 6.9327 & 0 \tabularnewline
23 & 0.490711 & 6.3603 & 0 \tabularnewline
24 & 0.618257 & 8.0135 & 0 \tabularnewline
25 & 0.456774 & 5.9205 & 0 \tabularnewline
26 & 0.500827 & 6.4915 & 0 \tabularnewline
27 & 0.424241 & 5.4988 & 0 \tabularnewline
28 & 0.348201 & 4.5132 & 6e-06 \tabularnewline
29 & 0.334474 & 4.3353 & 1.3e-05 \tabularnewline
30 & 0.25864 & 3.3524 & 0.000495 \tabularnewline
31 & 0.289464 & 3.7519 & 0.000121 \tabularnewline
32 & 0.248775 & 3.2245 & 0.000758 \tabularnewline
33 & 0.300786 & 3.8986 & 7e-05 \tabularnewline
34 & 0.32397 & 4.1991 & 2.2e-05 \tabularnewline
35 & 0.29103 & 3.7722 & 0.000112 \tabularnewline
36 & 0.422696 & 5.4788 & 0 \tabularnewline
37 & 0.276484 & 3.5836 & 0.000222 \tabularnewline
38 & 0.30326 & 3.9307 & 6.2e-05 \tabularnewline
39 & 0.221727 & 2.8739 & 0.002289 \tabularnewline
40 & 0.157165 & 2.0371 & 0.021605 \tabularnewline
41 & 0.146687 & 1.9013 & 0.029489 \tabularnewline
42 & 0.080457 & 1.0428 & 0.149261 \tabularnewline
43 & 0.107656 & 1.3954 & 0.082371 \tabularnewline
44 & 0.067729 & 0.8779 & 0.190634 \tabularnewline
45 & 0.111571 & 1.4461 & 0.075002 \tabularnewline
46 & 0.141077 & 1.8286 & 0.034619 \tabularnewline
47 & 0.122405 & 1.5865 & 0.057248 \tabularnewline
48 & 0.246927 & 3.2005 & 0.00082 \tabularnewline
49 & 0.114813 & 1.4881 & 0.069293 \tabularnewline
50 & 0.142563 & 1.8478 & 0.033193 \tabularnewline
51 & 0.058346 & 0.7562 & 0.22528 \tabularnewline
52 & 0.008078 & 0.1047 & 0.458366 \tabularnewline
53 & -0.01181 & -0.1531 & 0.439262 \tabularnewline
54 & -0.081389 & -1.0549 & 0.146489 \tabularnewline
55 & -0.057459 & -0.7448 & 0.228729 \tabularnewline
56 & -0.079429 & -1.0295 & 0.152358 \tabularnewline
57 & -0.022874 & -0.2965 & 0.383613 \tabularnewline
58 & -0.00142 & -0.0184 & 0.492668 \tabularnewline
59 & -0.025178 & -0.3263 & 0.372288 \tabularnewline
60 & 0.071004 & 0.9203 & 0.179363 \tabularnewline
\hline
\end{tabular}
%Source: https://freestatistics.org/blog/index.php?pk=150174&T=1

[TABLE]
[ROW][C]Autocorrelation Function[/C][/ROW]
[ROW][C]Time lag k[/C][C]ACF(k)[/C][C]T-STAT[/C][C]P-value[/C][/ROW]
[ROW][C]1[/C][C]0.783397[/C][C]10.154[/C][C]0[/C][/ROW]
[ROW][C]2[/C][C]0.797674[/C][C]10.339[/C][C]0[/C][/ROW]
[ROW][C]3[/C][C]0.700949[/C][C]9.0853[/C][C]0[/C][/ROW]
[ROW][C]4[/C][C]0.628517[/C][C]8.1465[/C][C]0[/C][/ROW]
[ROW][C]5[/C][C]0.621069[/C][C]8.05[/C][C]0[/C][/ROW]
[ROW][C]6[/C][C]0.54533[/C][C]7.0683[/C][C]0[/C][/ROW]
[ROW][C]7[/C][C]0.594115[/C][C]7.7006[/C][C]0[/C][/ROW]
[ROW][C]8[/C][C]0.562804[/C][C]7.2948[/C][C]0[/C][/ROW]
[ROW][C]9[/C][C]0.628631[/C][C]8.148[/C][C]0[/C][/ROW]
[ROW][C]10[/C][C]0.675507[/C][C]8.7556[/C][C]0[/C][/ROW]
[ROW][C]11[/C][C]0.63254[/C][C]8.1987[/C][C]0[/C][/ROW]
[ROW][C]12[/C][C]0.778051[/C][C]10.0847[/C][C]0[/C][/ROW]
[ROW][C]13[/C][C]0.614559[/C][C]7.9656[/C][C]0[/C][/ROW]
[ROW][C]14[/C][C]0.660622[/C][C]8.5626[/C][C]0[/C][/ROW]
[ROW][C]15[/C][C]0.586713[/C][C]7.6047[/C][C]0[/C][/ROW]
[ROW][C]16[/C][C]0.516053[/C][C]6.6888[/C][C]0[/C][/ROW]
[ROW][C]17[/C][C]0.499791[/C][C]6.478[/C][C]0[/C][/ROW]
[ROW][C]18[/C][C]0.415497[/C][C]5.3855[/C][C]0[/C][/ROW]
[ROW][C]19[/C][C]0.459485[/C][C]5.9556[/C][C]0[/C][/ROW]
[ROW][C]20[/C][C]0.434303[/C][C]5.6292[/C][C]0[/C][/ROW]
[ROW][C]21[/C][C]0.492765[/C][C]6.387[/C][C]0[/C][/ROW]
[ROW][C]22[/C][C]0.534871[/C][C]6.9327[/C][C]0[/C][/ROW]
[ROW][C]23[/C][C]0.490711[/C][C]6.3603[/C][C]0[/C][/ROW]
[ROW][C]24[/C][C]0.618257[/C][C]8.0135[/C][C]0[/C][/ROW]
[ROW][C]25[/C][C]0.456774[/C][C]5.9205[/C][C]0[/C][/ROW]
[ROW][C]26[/C][C]0.500827[/C][C]6.4915[/C][C]0[/C][/ROW]
[ROW][C]27[/C][C]0.424241[/C][C]5.4988[/C][C]0[/C][/ROW]
[ROW][C]28[/C][C]0.348201[/C][C]4.5132[/C][C]6e-06[/C][/ROW]
[ROW][C]29[/C][C]0.334474[/C][C]4.3353[/C][C]1.3e-05[/C][/ROW]
[ROW][C]30[/C][C]0.25864[/C][C]3.3524[/C][C]0.000495[/C][/ROW]
[ROW][C]31[/C][C]0.289464[/C][C]3.7519[/C][C]0.000121[/C][/ROW]
[ROW][C]32[/C][C]0.248775[/C][C]3.2245[/C][C]0.000758[/C][/ROW]
[ROW][C]33[/C][C]0.300786[/C][C]3.8986[/C][C]7e-05[/C][/ROW]
[ROW][C]34[/C][C]0.32397[/C][C]4.1991[/C][C]2.2e-05[/C][/ROW]
[ROW][C]35[/C][C]0.29103[/C][C]3.7722[/C][C]0.000112[/C][/ROW]
[ROW][C]36[/C][C]0.422696[/C][C]5.4788[/C][C]0[/C][/ROW]
[ROW][C]37[/C][C]0.276484[/C][C]3.5836[/C][C]0.000222[/C][/ROW]
[ROW][C]38[/C][C]0.30326[/C][C]3.9307[/C][C]6.2e-05[/C][/ROW]
[ROW][C]39[/C][C]0.221727[/C][C]2.8739[/C][C]0.002289[/C][/ROW]
[ROW][C]40[/C][C]0.157165[/C][C]2.0371[/C][C]0.021605[/C][/ROW]
[ROW][C]41[/C][C]0.146687[/C][C]1.9013[/C][C]0.029489[/C][/ROW]
[ROW][C]42[/C][C]0.080457[/C][C]1.0428[/C][C]0.149261[/C][/ROW]
[ROW][C]43[/C][C]0.107656[/C][C]1.3954[/C][C]0.082371[/C][/ROW]
[ROW][C]44[/C][C]0.067729[/C][C]0.8779[/C][C]0.190634[/C][/ROW]
[ROW][C]45[/C][C]0.111571[/C][C]1.4461[/C][C]0.075002[/C][/ROW]
[ROW][C]46[/C][C]0.141077[/C][C]1.8286[/C][C]0.034619[/C][/ROW]
[ROW][C]47[/C][C]0.122405[/C][C]1.5865[/C][C]0.057248[/C][/ROW]
[ROW][C]48[/C][C]0.246927[/C][C]3.2005[/C][C]0.00082[/C][/ROW]
[ROW][C]49[/C][C]0.114813[/C][C]1.4881[/C][C]0.069293[/C][/ROW]
[ROW][C]50[/C][C]0.142563[/C][C]1.8478[/C][C]0.033193[/C][/ROW]
[ROW][C]51[/C][C]0.058346[/C][C]0.7562[/C][C]0.22528[/C][/ROW]
[ROW][C]52[/C][C]0.008078[/C][C]0.1047[/C][C]0.458366[/C][/ROW]
[ROW][C]53[/C][C]-0.01181[/C][C]-0.1531[/C][C]0.439262[/C][/ROW]
[ROW][C]54[/C][C]-0.081389[/C][C]-1.0549[/C][C]0.146489[/C][/ROW]
[ROW][C]55[/C][C]-0.057459[/C][C]-0.7448[/C][C]0.228729[/C][/ROW]
[ROW][C]56[/C][C]-0.079429[/C][C]-1.0295[/C][C]0.152358[/C][/ROW]
[ROW][C]57[/C][C]-0.022874[/C][C]-0.2965[/C][C]0.383613[/C][/ROW]
[ROW][C]58[/C][C]-0.00142[/C][C]-0.0184[/C][C]0.492668[/C][/ROW]
[ROW][C]59[/C][C]-0.025178[/C][C]-0.3263[/C][C]0.372288[/C][/ROW]
[ROW][C]60[/C][C]0.071004[/C][C]0.9203[/C][C]0.179363[/C][/ROW]
[/TABLE]
Source: https://freestatistics.org/blog/index.php?pk=150174&T=1

Globally Unique Identifier (entire table): ba.freestatistics.org/blog/index.php?pk=150174&T=1

As an alternative you can also use a QR Code:  

The GUIDs for individual cells are displayed in the table below:

Autocorrelation Function
Time lag kACF(k)T-STATP-value
10.78339710.1540
20.79767410.3390
30.7009499.08530
40.6285178.14650
50.6210698.050
60.545337.06830
70.5941157.70060
80.5628047.29480
90.6286318.1480
100.6755078.75560
110.632548.19870
120.77805110.08470
130.6145597.96560
140.6606228.56260
150.5867137.60470
160.5160536.68880
170.4997916.4780
180.4154975.38550
190.4594855.95560
200.4343035.62920
210.4927656.3870
220.5348716.93270
230.4907116.36030
240.6182578.01350
250.4567745.92050
260.5008276.49150
270.4242415.49880
280.3482014.51326e-06
290.3344744.33531.3e-05
300.258643.35240.000495
310.2894643.75190.000121
320.2487753.22450.000758
330.3007863.89867e-05
340.323974.19912.2e-05
350.291033.77220.000112
360.4226965.47880
370.2764843.58360.000222
380.303263.93076.2e-05
390.2217272.87390.002289
400.1571652.03710.021605
410.1466871.90130.029489
420.0804571.04280.149261
430.1076561.39540.082371
440.0677290.87790.190634
450.1115711.44610.075002
460.1410771.82860.034619
470.1224051.58650.057248
480.2469273.20050.00082
490.1148131.48810.069293
500.1425631.84780.033193
510.0583460.75620.22528
520.0080780.10470.458366
53-0.01181-0.15310.439262
54-0.081389-1.05490.146489
55-0.057459-0.74480.228729
56-0.079429-1.02950.152358
57-0.022874-0.29650.383613
58-0.00142-0.01840.492668
59-0.025178-0.32630.372288
600.0710040.92030.179363


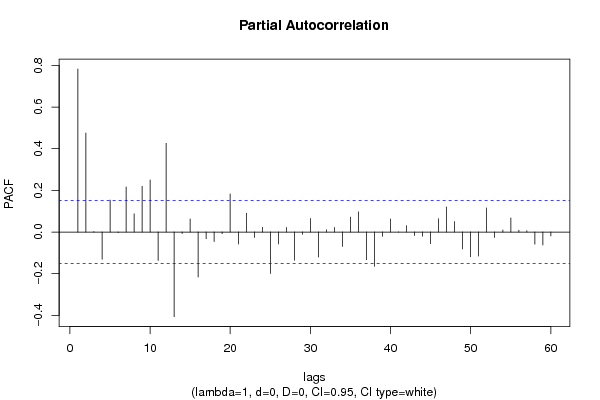
Partial Autocorrelation Function
Time lag kPACF(k)T-STATP-value
10.78339710.1540
20.4762326.17270
30.0019090.02470.490147
4-0.131267-1.70140.045358
50.153381.9880.024216
6-0.002795-0.03620.485572
70.2160112.79980.002856
80.0872071.13030.129972
90.2192792.84220.002518
100.2495373.23440.000734
11-0.136603-1.77060.039223
120.425975.52120
13-0.406746-5.2720
14-0.007103-0.09210.463378
150.0624760.80980.209604
16-0.216134-2.80140.002843
17-0.032-0.41480.339421
18-0.045737-0.59280.277048
19-0.007978-0.10340.458883
200.1826832.36780.009515
21-0.058155-0.75380.226019
220.0897651.16350.12314
23-0.026226-0.33990.367169
240.022250.28840.386699
25-0.198917-2.57830.005394
26-0.057252-0.74210.229539
270.0217490.28190.389184
28-0.135334-1.75410.040616
29-0.011204-0.14520.442357
300.0649420.84170.200565
31-0.120419-1.56080.060225
320.010220.13250.447389
330.0216780.2810.389536
34-0.069726-0.90370.183711
350.0714780.92650.177769
360.0967781.25440.105721
37-0.132801-1.72130.043519
38-0.165086-2.13980.016909
39-0.020638-0.26750.394706
400.0624820.80990.209584
41-0.001193-0.01550.493841
420.0303590.39350.347226
43-0.016942-0.21960.413225
44-0.02009-0.26040.397439
45-0.056484-0.73210.23256
460.0636470.8250.205281
470.1203811.56030.060283
480.0506570.65660.256173
49-0.081235-1.05290.146945
50-0.119477-1.54860.06168
51-0.115453-1.49640.068207
520.1150591.49130.068875
53-0.026747-0.34670.364633
540.0096130.12460.450493
550.0670230.86870.19312
560.0089030.11540.454134
570.0064740.08390.466611
58-0.05845-0.75760.224874
59-0.061943-0.80290.21159
60-0.018841-0.24420.403686

\begin{tabular}{lllllllll}
\hline
Partial Autocorrelation Function \tabularnewline
Time lag k & PACF(k) & T-STAT & P-value \tabularnewline
1 & 0.783397 & 10.154 & 0 \tabularnewline
2 & 0.476232 & 6.1727 & 0 \tabularnewline
3 & 0.001909 & 0.0247 & 0.490147 \tabularnewline
4 & -0.131267 & -1.7014 & 0.045358 \tabularnewline
5 & 0.15338 & 1.988 & 0.024216 \tabularnewline
6 & -0.002795 & -0.0362 & 0.485572 \tabularnewline
7 & 0.216011 & 2.7998 & 0.002856 \tabularnewline
8 & 0.087207 & 1.1303 & 0.129972 \tabularnewline
9 & 0.219279 & 2.8422 & 0.002518 \tabularnewline
10 & 0.249537 & 3.2344 & 0.000734 \tabularnewline
11 & -0.136603 & -1.7706 & 0.039223 \tabularnewline
12 & 0.42597 & 5.5212 & 0 \tabularnewline
13 & -0.406746 & -5.272 & 0 \tabularnewline
14 & -0.007103 & -0.0921 & 0.463378 \tabularnewline
15 & 0.062476 & 0.8098 & 0.209604 \tabularnewline
16 & -0.216134 & -2.8014 & 0.002843 \tabularnewline
17 & -0.032 & -0.4148 & 0.339421 \tabularnewline
18 & -0.045737 & -0.5928 & 0.277048 \tabularnewline
19 & -0.007978 & -0.1034 & 0.458883 \tabularnewline
20 & 0.182683 & 2.3678 & 0.009515 \tabularnewline
21 & -0.058155 & -0.7538 & 0.226019 \tabularnewline
22 & 0.089765 & 1.1635 & 0.12314 \tabularnewline
23 & -0.026226 & -0.3399 & 0.367169 \tabularnewline
24 & 0.02225 & 0.2884 & 0.386699 \tabularnewline
25 & -0.198917 & -2.5783 & 0.005394 \tabularnewline
26 & -0.057252 & -0.7421 & 0.229539 \tabularnewline
27 & 0.021749 & 0.2819 & 0.389184 \tabularnewline
28 & -0.135334 & -1.7541 & 0.040616 \tabularnewline
29 & -0.011204 & -0.1452 & 0.442357 \tabularnewline
30 & 0.064942 & 0.8417 & 0.200565 \tabularnewline
31 & -0.120419 & -1.5608 & 0.060225 \tabularnewline
32 & 0.01022 & 0.1325 & 0.447389 \tabularnewline
33 & 0.021678 & 0.281 & 0.389536 \tabularnewline
34 & -0.069726 & -0.9037 & 0.183711 \tabularnewline
35 & 0.071478 & 0.9265 & 0.177769 \tabularnewline
36 & 0.096778 & 1.2544 & 0.105721 \tabularnewline
37 & -0.132801 & -1.7213 & 0.043519 \tabularnewline
38 & -0.165086 & -2.1398 & 0.016909 \tabularnewline
39 & -0.020638 & -0.2675 & 0.394706 \tabularnewline
40 & 0.062482 & 0.8099 & 0.209584 \tabularnewline
41 & -0.001193 & -0.0155 & 0.493841 \tabularnewline
42 & 0.030359 & 0.3935 & 0.347226 \tabularnewline
43 & -0.016942 & -0.2196 & 0.413225 \tabularnewline
44 & -0.02009 & -0.2604 & 0.397439 \tabularnewline
45 & -0.056484 & -0.7321 & 0.23256 \tabularnewline
46 & 0.063647 & 0.825 & 0.205281 \tabularnewline
47 & 0.120381 & 1.5603 & 0.060283 \tabularnewline
48 & 0.050657 & 0.6566 & 0.256173 \tabularnewline
49 & -0.081235 & -1.0529 & 0.146945 \tabularnewline
50 & -0.119477 & -1.5486 & 0.06168 \tabularnewline
51 & -0.115453 & -1.4964 & 0.068207 \tabularnewline
52 & 0.115059 & 1.4913 & 0.068875 \tabularnewline
53 & -0.026747 & -0.3467 & 0.364633 \tabularnewline
54 & 0.009613 & 0.1246 & 0.450493 \tabularnewline
55 & 0.067023 & 0.8687 & 0.19312 \tabularnewline
56 & 0.008903 & 0.1154 & 0.454134 \tabularnewline
57 & 0.006474 & 0.0839 & 0.466611 \tabularnewline
58 & -0.05845 & -0.7576 & 0.224874 \tabularnewline
59 & -0.061943 & -0.8029 & 0.21159 \tabularnewline
60 & -0.018841 & -0.2442 & 0.403686 \tabularnewline
\hline
\end{tabular}
%Source: https://freestatistics.org/blog/index.php?pk=150174&T=2

[TABLE]
[ROW][C]Partial Autocorrelation Function[/C][/ROW]
[ROW][C]Time lag k[/C][C]PACF(k)[/C][C]T-STAT[/C][C]P-value[/C][/ROW]
[ROW][C]1[/C][C]0.783397[/C][C]10.154[/C][C]0[/C][/ROW]
[ROW][C]2[/C][C]0.476232[/C][C]6.1727[/C][C]0[/C][/ROW]
[ROW][C]3[/C][C]0.001909[/C][C]0.0247[/C][C]0.490147[/C][/ROW]
[ROW][C]4[/C][C]-0.131267[/C][C]-1.7014[/C][C]0.045358[/C][/ROW]
[ROW][C]5[/C][C]0.15338[/C][C]1.988[/C][C]0.024216[/C][/ROW]
[ROW][C]6[/C][C]-0.002795[/C][C]-0.0362[/C][C]0.485572[/C][/ROW]
[ROW][C]7[/C][C]0.216011[/C][C]2.7998[/C][C]0.002856[/C][/ROW]
[ROW][C]8[/C][C]0.087207[/C][C]1.1303[/C][C]0.129972[/C][/ROW]
[ROW][C]9[/C][C]0.219279[/C][C]2.8422[/C][C]0.002518[/C][/ROW]
[ROW][C]10[/C][C]0.249537[/C][C]3.2344[/C][C]0.000734[/C][/ROW]
[ROW][C]11[/C][C]-0.136603[/C][C]-1.7706[/C][C]0.039223[/C][/ROW]
[ROW][C]12[/C][C]0.42597[/C][C]5.5212[/C][C]0[/C][/ROW]
[ROW][C]13[/C][C]-0.406746[/C][C]-5.272[/C][C]0[/C][/ROW]
[ROW][C]14[/C][C]-0.007103[/C][C]-0.0921[/C][C]0.463378[/C][/ROW]
[ROW][C]15[/C][C]0.062476[/C][C]0.8098[/C][C]0.209604[/C][/ROW]
[ROW][C]16[/C][C]-0.216134[/C][C]-2.8014[/C][C]0.002843[/C][/ROW]
[ROW][C]17[/C][C]-0.032[/C][C]-0.4148[/C][C]0.339421[/C][/ROW]
[ROW][C]18[/C][C]-0.045737[/C][C]-0.5928[/C][C]0.277048[/C][/ROW]
[ROW][C]19[/C][C]-0.007978[/C][C]-0.1034[/C][C]0.458883[/C][/ROW]
[ROW][C]20[/C][C]0.182683[/C][C]2.3678[/C][C]0.009515[/C][/ROW]
[ROW][C]21[/C][C]-0.058155[/C][C]-0.7538[/C][C]0.226019[/C][/ROW]
[ROW][C]22[/C][C]0.089765[/C][C]1.1635[/C][C]0.12314[/C][/ROW]
[ROW][C]23[/C][C]-0.026226[/C][C]-0.3399[/C][C]0.367169[/C][/ROW]
[ROW][C]24[/C][C]0.02225[/C][C]0.2884[/C][C]0.386699[/C][/ROW]
[ROW][C]25[/C][C]-0.198917[/C][C]-2.5783[/C][C]0.005394[/C][/ROW]
[ROW][C]26[/C][C]-0.057252[/C][C]-0.7421[/C][C]0.229539[/C][/ROW]
[ROW][C]27[/C][C]0.021749[/C][C]0.2819[/C][C]0.389184[/C][/ROW]
[ROW][C]28[/C][C]-0.135334[/C][C]-1.7541[/C][C]0.040616[/C][/ROW]
[ROW][C]29[/C][C]-0.011204[/C][C]-0.1452[/C][C]0.442357[/C][/ROW]
[ROW][C]30[/C][C]0.064942[/C][C]0.8417[/C][C]0.200565[/C][/ROW]
[ROW][C]31[/C][C]-0.120419[/C][C]-1.5608[/C][C]0.060225[/C][/ROW]
[ROW][C]32[/C][C]0.01022[/C][C]0.1325[/C][C]0.447389[/C][/ROW]
[ROW][C]33[/C][C]0.021678[/C][C]0.281[/C][C]0.389536[/C][/ROW]
[ROW][C]34[/C][C]-0.069726[/C][C]-0.9037[/C][C]0.183711[/C][/ROW]
[ROW][C]35[/C][C]0.071478[/C][C]0.9265[/C][C]0.177769[/C][/ROW]
[ROW][C]36[/C][C]0.096778[/C][C]1.2544[/C][C]0.105721[/C][/ROW]
[ROW][C]37[/C][C]-0.132801[/C][C]-1.7213[/C][C]0.043519[/C][/ROW]
[ROW][C]38[/C][C]-0.165086[/C][C]-2.1398[/C][C]0.016909[/C][/ROW]
[ROW][C]39[/C][C]-0.020638[/C][C]-0.2675[/C][C]0.394706[/C][/ROW]
[ROW][C]40[/C][C]0.062482[/C][C]0.8099[/C][C]0.209584[/C][/ROW]
[ROW][C]41[/C][C]-0.001193[/C][C]-0.0155[/C][C]0.493841[/C][/ROW]
[ROW][C]42[/C][C]0.030359[/C][C]0.3935[/C][C]0.347226[/C][/ROW]
[ROW][C]43[/C][C]-0.016942[/C][C]-0.2196[/C][C]0.413225[/C][/ROW]
[ROW][C]44[/C][C]-0.02009[/C][C]-0.2604[/C][C]0.397439[/C][/ROW]
[ROW][C]45[/C][C]-0.056484[/C][C]-0.7321[/C][C]0.23256[/C][/ROW]
[ROW][C]46[/C][C]0.063647[/C][C]0.825[/C][C]0.205281[/C][/ROW]
[ROW][C]47[/C][C]0.120381[/C][C]1.5603[/C][C]0.060283[/C][/ROW]
[ROW][C]48[/C][C]0.050657[/C][C]0.6566[/C][C]0.256173[/C][/ROW]
[ROW][C]49[/C][C]-0.081235[/C][C]-1.0529[/C][C]0.146945[/C][/ROW]
[ROW][C]50[/C][C]-0.119477[/C][C]-1.5486[/C][C]0.06168[/C][/ROW]
[ROW][C]51[/C][C]-0.115453[/C][C]-1.4964[/C][C]0.068207[/C][/ROW]
[ROW][C]52[/C][C]0.115059[/C][C]1.4913[/C][C]0.068875[/C][/ROW]
[ROW][C]53[/C][C]-0.026747[/C][C]-0.3467[/C][C]0.364633[/C][/ROW]
[ROW][C]54[/C][C]0.009613[/C][C]0.1246[/C][C]0.450493[/C][/ROW]
[ROW][C]55[/C][C]0.067023[/C][C]0.8687[/C][C]0.19312[/C][/ROW]
[ROW][C]56[/C][C]0.008903[/C][C]0.1154[/C][C]0.454134[/C][/ROW]
[ROW][C]57[/C][C]0.006474[/C][C]0.0839[/C][C]0.466611[/C][/ROW]
[ROW][C]58[/C][C]-0.05845[/C][C]-0.7576[/C][C]0.224874[/C][/ROW]
[ROW][C]59[/C][C]-0.061943[/C][C]-0.8029[/C][C]0.21159[/C][/ROW]
[ROW][C]60[/C][C]-0.018841[/C][C]-0.2442[/C][C]0.403686[/C][/ROW]
[/TABLE]
Source: https://freestatistics.org/blog/index.php?pk=150174&T=2

Globally Unique Identifier (entire table): ba.freestatistics.org/blog/index.php?pk=150174&T=2

As an alternative you can also use a QR Code:  

The GUIDs for individual cells are displayed in the table below:

Partial Autocorrelation Function
Time lag kPACF(k)T-STATP-value
10.78339710.1540
20.4762326.17270
30.0019090.02470.490147
4-0.131267-1.70140.045358
50.153381.9880.024216
6-0.002795-0.03620.485572
70.2160112.79980.002856
80.0872071.13030.129972
90.2192792.84220.002518
100.2495373.23440.000734
11-0.136603-1.77060.039223
120.425975.52120
13-0.406746-5.2720
14-0.007103-0.09210.463378
150.0624760.80980.209604
16-0.216134-2.80140.002843
17-0.032-0.41480.339421
18-0.045737-0.59280.277048
19-0.007978-0.10340.458883
200.1826832.36780.009515
21-0.058155-0.75380.226019
220.0897651.16350.12314
23-0.026226-0.33990.367169
240.022250.28840.386699
25-0.198917-2.57830.005394
26-0.057252-0.74210.229539
270.0217490.28190.389184
28-0.135334-1.75410.040616
29-0.011204-0.14520.442357
300.0649420.84170.200565
31-0.120419-1.56080.060225
320.010220.13250.447389
330.0216780.2810.389536
34-0.069726-0.90370.183711
350.0714780.92650.177769
360.0967781.25440.105721
37-0.132801-1.72130.043519
38-0.165086-2.13980.016909
39-0.020638-0.26750.394706
400.0624820.80990.209584
41-0.001193-0.01550.493841
420.0303590.39350.347226
43-0.016942-0.21960.413225
44-0.02009-0.26040.397439
45-0.056484-0.73210.23256
460.0636470.8250.205281
470.1203811.56030.060283
480.0506570.65660.256173
49-0.081235-1.05290.146945
50-0.119477-1.54860.06168
51-0.115453-1.49640.068207
520.1150591.49130.068875
53-0.026747-0.34670.364633
540.0096130.12460.450493
550.0670230.86870.19312
560.0089030.11540.454134
570.0064740.08390.466611
58-0.05845-0.75760.224874
59-0.061943-0.80290.21159
60-0.018841-0.24420.403686


Parameters (Session):
par1 = 60 ; par2 = 1 ; par3 = 0 ; par4 = 0 ; par5 = 12 ; par6 = White Noise ; par7 = 0.95 ;
Parameters (R input):
par1 = 60 ; par2 = 1 ; par3 = 0 ; par4 = 0 ; par5 = 12 ; par6 = White Noise ; par7 = 0.95 ; par8 = ;
R code (references can be found in the software module):
if (par1 == 'Default') {
par1 = 10*log10(length(x))
} else {
par1 <- as.numeric(par1)
}
par2 <- as.numeric(par2)
par3 <- as.numeric(par3)
par4 <- as.numeric(par4)
par5 <- as.numeric(par5)
if (par6 == 'White Noise') par6 <- 'white' else par6 <- 'ma'
par7 <- as.numeric(par7)
if (par8 != '') par8 <- as.numeric(par8)
ox <- x
if (par8 == '') {
if (par2 == 0) {
x <- log(x)
} else {
x <- (x ^ par2 - 1) / par2
}
} else {
x <- log(x,base=par8)
}
if (par3 > 0) x <- diff(x,lag=1,difference=par3)
if (par4 > 0) x <- diff(x,lag=par5,difference=par4)
bitmap(file='picts.png')
op <- par(mfrow=c(2,1))
plot(ox,type='l',main='Original Time Series',xlab='time',ylab='value')
if (par8=='') {
mytitle <- paste('Working Time Series (lambda=',par2,', d=',par3,', D=',par4,')',sep='')
mysub <- paste('(lambda=',par2,', d=',par3,', D=',par4,', CI=', par7, ', CI type=',par6,')',sep='')
} else {
mytitle <- paste('Working Time Series (base=',par8,', d=',par3,', D=',par4,')',sep='')
mysub <- paste('(base=',par8,', d=',par3,', D=',par4,', CI=', par7, ', CI type=',par6,')',sep='')
}
plot(x,type='l', main=mytitle,xlab='time',ylab='value')
par(op)
dev.off()
bitmap(file='pic1.png')
racf <- acf(x, par1, main='Autocorrelation', xlab='time lag', ylab='ACF', ci.type=par6, ci=par7, sub=mysub)
dev.off()
bitmap(file='pic2.png')
rpacf <- pacf(x,par1,main='Partial Autocorrelation',xlab='lags',ylab='PACF',sub=mysub)
dev.off()
(myacf <- c(racf$acf))
(mypacf <- c(rpacf$acf))
lengthx <- length(x)
sqrtn <- sqrt(lengthx)
load(file='createtable')
a<-table.start()
a<-table.row.start(a)
a<-table.element(a,'Autocorrelation Function',4,TRUE)
a<-table.row.end(a)
a<-table.row.start(a)
a<-table.element(a,'Time lag k',header=TRUE)
a<-table.element(a,hyperlink('basics.htm','ACF(k)','click here for more information about the Autocorrelation Function'),header=TRUE)
a<-table.element(a,'T-STAT',header=TRUE)
a<-table.element(a,'P-value',header=TRUE)
a<-table.row.end(a)
for (i in 2:(par1+1)) {
a<-table.row.start(a)
a<-table.element(a,i-1,header=TRUE)
a<-table.element(a,round(myacf[i],6))
mytstat <- myacf[i]*sqrtn
a<-table.element(a,round(mytstat,4))
a<-table.element(a,round(1-pt(abs(mytstat),lengthx),6))
a<-table.row.end(a)
}
a<-table.end(a)
table.save(a,file='mytable.tab')
a<-table.start()
a<-table.row.start(a)
a<-table.element(a,'Partial Autocorrelation Function',4,TRUE)
a<-table.row.end(a)
a<-table.row.start(a)
a<-table.element(a,'Time lag k',header=TRUE)
a<-table.element(a,hyperlink('basics.htm','PACF(k)','click here for more information about the Partial Autocorrelation Function'),header=TRUE)
a<-table.element(a,'T-STAT',header=TRUE)
a<-table.element(a,'P-value',header=TRUE)
a<-table.row.end(a)
for (i in 1:par1) {
a<-table.row.start(a)
a<-table.element(a,i,header=TRUE)
a<-table.element(a,round(mypacf[i],6))
mytstat <- mypacf[i]*sqrtn
a<-table.element(a,round(mytstat,4))
a<-table.element(a,round(1-pt(abs(mytstat),lengthx),6))
a<-table.row.end(a)
}
a<-table.end(a)
table.save(a,file='mytable1.tab')