Free Statistics

of Irreproducible Research!

Author's title

Author*The author of this computation has been verified*
R Software Modulerwasp_arimabackwardselection.wasp
Title produced by softwareARIMA Backward Selection
Date of computationFri, 02 Dec 2011 07:25:47 -0500
Cite this page as followsStatistical Computations at FreeStatistics.org, Office for Research Development and Education, URL https://freestatistics.org/blog/index.php?v=date/2011/Dec/02/t1322828764y6aesfdzps0upxj.htm/, Retrieved Mon, 29 Apr 2024 00:52:42 +0000
Statistical Computations at FreeStatistics.org, Office for Research Development and Education, URL https://freestatistics.org/blog/index.php?pk=150156, Retrieved Mon, 29 Apr 2024 00:52:42 +0000
QR Codes:

Original text written by user:
IsPrivate?No (this computation is public)
User-defined keywords
Estimated Impact135
Family? (F = Feedback message, R = changed R code, M = changed R Module, P = changed Parameters, D = changed Data)
-     [Univariate Data Series] [data set] [2008-12-01 19:54:57] [b98453cac15ba1066b407e146608df68]
- RMP   [Standard Deviation-Mean Plot] [Unemployment] [2010-11-29 10:34:47] [b98453cac15ba1066b407e146608df68]
- RMP     [ARIMA Backward Selection] [Unemployment] [2010-11-29 17:10:28] [b98453cac15ba1066b407e146608df68]
-    D      [ARIMA Backward Selection] [WS 9 ARMA Parameters] [2010-12-03 21:54:01] [8081b8996d5947580de3eb171e82db4f]
-   PD        [ARIMA Backward Selection] [Workshop 9, ARIMA] [2010-12-05 19:24:43] [3635fb7041b1998c5a1332cf9de22bce]
-   P           [ARIMA Backward Selection] [Workshop 9, ARIMA] [2010-12-06 22:46:35] [3635fb7041b1998c5a1332cf9de22bce]
-   PD            [ARIMA Backward Selection] [] [2011-12-01 14:39:23] [d6b4d011b409693eac2700c83288e3e7]
- R P                 [ARIMA Backward Selection] [] [2011-12-02 12:25:47] [d34c5d8ebaf8c35edbecb57bc39ed04e] [Current]
Feedback Forum

Post a new message
Dataseries X:
9676
8642
9402
9610
9294
9448
10319
9548
9801
9596
8923
9746
9829
9125
9782
9441
9162
9915
10444
10209
9985
9842
9429
10132
9849
9172
10313
9819
9955
10048
10082
10541
10208
10233
9439
9963
10158
9225
10474
9757
10490
10281
10444
10640
10695
10786
9832
9747
10411
9511
10402
9701
10540
10112
10915
11183
10384
10834
9886
10216
10943
9867
10203
10837
10573
10647
11502
10656
10866
10835
9945
10331


Summary of computational transaction
Raw Inputview raw input (R code)
Raw Outputview raw output of R engine
Computing time5 seconds
R Server'George Udny Yule' @ yule.wessa.net

\begin{tabular}{lllllllll}
\hline
Summary of computational transaction \tabularnewline
Raw Input & view raw input (R code)  \tabularnewline
Raw Output & view raw output of R engine  \tabularnewline
Computing time & 5 seconds \tabularnewline
R Server & 'George Udny Yule' @ yule.wessa.net \tabularnewline
\hline
\end{tabular}
%Source: https://freestatistics.org/blog/index.php?pk=150156&T=0

[TABLE]
[ROW][C]Summary of computational transaction[/C][/ROW]
[ROW][C]Raw Input[/C][C]view raw input (R code) [/C][/ROW]
[ROW][C]Raw Output[/C][C]view raw output of R engine [/C][/ROW]
[ROW][C]Computing time[/C][C]5 seconds[/C][/ROW]
[ROW][C]R Server[/C][C]'George Udny Yule' @ yule.wessa.net[/C][/ROW]
[/TABLE]
Source: https://freestatistics.org/blog/index.php?pk=150156&T=0

Globally Unique Identifier (entire table): ba.freestatistics.org/blog/index.php?pk=150156&T=0

As an alternative you can also use a QR Code:  

The GUIDs for individual cells are displayed in the table below:

Summary of computational transaction
Raw Inputview raw input (R code)
Raw Outputview raw output of R engine
Computing time5 seconds
R Server'George Udny Yule' @ yule.wessa.net


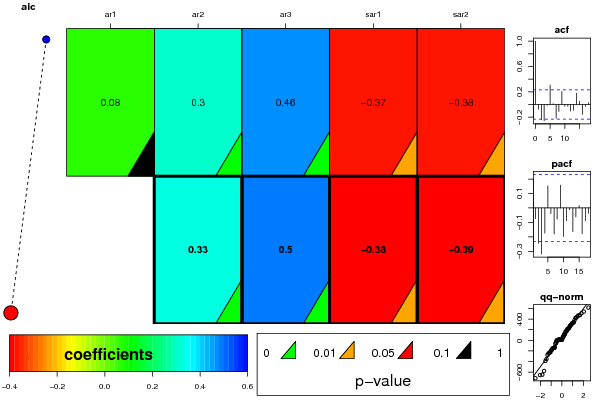
ARIMA Parameter Estimation and Backward Selection
Iterationar1ar2ar3sar1sar2
Estimates ( 1 )0.07810.30430.461-0.3676-0.3767
(p-val)(0.4972 )(0.007 )(5e-04 )(0.0221 )(0.0248 )
Estimates ( 2 )00.32960.4993-0.3846-0.3904
(p-val)(NA )(0.0021 )(0 )(0.0134 )(0.0183 )
Estimates ( 3 )NANANANANA
(p-val)(NA )(NA )(NA )(NA )(NA )
Estimates ( 4 )NANANANANA
(p-val)(NA )(NA )(NA )(NA )(NA )
Estimates ( 5 )NANANANANA
(p-val)(NA )(NA )(NA )(NA )(NA )
Estimates ( 6 )NANANANANA
(p-val)(NA )(NA )(NA )(NA )(NA )
Estimates ( 7 )NANANANANA
(p-val)(NA )(NA )(NA )(NA )(NA )
Estimates ( 8 )NANANANANA
(p-val)(NA )(NA )(NA )(NA )(NA )
Estimates ( 9 )NANANANANA
(p-val)(NA )(NA )(NA )(NA )(NA )

\begin{tabular}{lllllllll}
\hline
ARIMA Parameter Estimation and Backward Selection \tabularnewline
Iteration & ar1 & ar2 & ar3 & sar1 & sar2 \tabularnewline
Estimates ( 1 ) & 0.0781 & 0.3043 & 0.461 & -0.3676 & -0.3767 \tabularnewline
(p-val) & (0.4972 ) & (0.007 ) & (5e-04 ) & (0.0221 ) & (0.0248 ) \tabularnewline
Estimates ( 2 ) & 0 & 0.3296 & 0.4993 & -0.3846 & -0.3904 \tabularnewline
(p-val) & (NA ) & (0.0021 ) & (0 ) & (0.0134 ) & (0.0183 ) \tabularnewline
Estimates ( 3 ) & NA & NA & NA & NA & NA \tabularnewline
(p-val) & (NA ) & (NA ) & (NA ) & (NA ) & (NA ) \tabularnewline
Estimates ( 4 ) & NA & NA & NA & NA & NA \tabularnewline
(p-val) & (NA ) & (NA ) & (NA ) & (NA ) & (NA ) \tabularnewline
Estimates ( 5 ) & NA & NA & NA & NA & NA \tabularnewline
(p-val) & (NA ) & (NA ) & (NA ) & (NA ) & (NA ) \tabularnewline
Estimates ( 6 ) & NA & NA & NA & NA & NA \tabularnewline
(p-val) & (NA ) & (NA ) & (NA ) & (NA ) & (NA ) \tabularnewline
Estimates ( 7 ) & NA & NA & NA & NA & NA \tabularnewline
(p-val) & (NA ) & (NA ) & (NA ) & (NA ) & (NA ) \tabularnewline
Estimates ( 8 ) & NA & NA & NA & NA & NA \tabularnewline
(p-val) & (NA ) & (NA ) & (NA ) & (NA ) & (NA ) \tabularnewline
Estimates ( 9 ) & NA & NA & NA & NA & NA \tabularnewline
(p-val) & (NA ) & (NA ) & (NA ) & (NA ) & (NA ) \tabularnewline
\hline
\end{tabular}
%Source: https://freestatistics.org/blog/index.php?pk=150156&T=1

[TABLE]
[ROW][C]ARIMA Parameter Estimation and Backward Selection[/C][/ROW]
[ROW][C]Iteration[/C][C]ar1[/C][C]ar2[/C][C]ar3[/C][C]sar1[/C][C]sar2[/C][/ROW]
[ROW][C]Estimates ( 1 )[/C][C]0.0781[/C][C]0.3043[/C][C]0.461[/C][C]-0.3676[/C][C]-0.3767[/C][/ROW]
[ROW][C](p-val)[/C][C](0.4972 )[/C][C](0.007 )[/C][C](5e-04 )[/C][C](0.0221 )[/C][C](0.0248 )[/C][/ROW]
[ROW][C]Estimates ( 2 )[/C][C]0[/C][C]0.3296[/C][C]0.4993[/C][C]-0.3846[/C][C]-0.3904[/C][/ROW]
[ROW][C](p-val)[/C][C](NA )[/C][C](0.0021 )[/C][C](0 )[/C][C](0.0134 )[/C][C](0.0183 )[/C][/ROW]
[ROW][C]Estimates ( 3 )[/C][C]NA[/C][C]NA[/C][C]NA[/C][C]NA[/C][C]NA[/C][/ROW]
[ROW][C](p-val)[/C][C](NA )[/C][C](NA )[/C][C](NA )[/C][C](NA )[/C][C](NA )[/C][/ROW]
[ROW][C]Estimates ( 4 )[/C][C]NA[/C][C]NA[/C][C]NA[/C][C]NA[/C][C]NA[/C][/ROW]
[ROW][C](p-val)[/C][C](NA )[/C][C](NA )[/C][C](NA )[/C][C](NA )[/C][C](NA )[/C][/ROW]
[ROW][C]Estimates ( 5 )[/C][C]NA[/C][C]NA[/C][C]NA[/C][C]NA[/C][C]NA[/C][/ROW]
[ROW][C](p-val)[/C][C](NA )[/C][C](NA )[/C][C](NA )[/C][C](NA )[/C][C](NA )[/C][/ROW]
[ROW][C]Estimates ( 6 )[/C][C]NA[/C][C]NA[/C][C]NA[/C][C]NA[/C][C]NA[/C][/ROW]
[ROW][C](p-val)[/C][C](NA )[/C][C](NA )[/C][C](NA )[/C][C](NA )[/C][C](NA )[/C][/ROW]
[ROW][C]Estimates ( 7 )[/C][C]NA[/C][C]NA[/C][C]NA[/C][C]NA[/C][C]NA[/C][/ROW]
[ROW][C](p-val)[/C][C](NA )[/C][C](NA )[/C][C](NA )[/C][C](NA )[/C][C](NA )[/C][/ROW]
[ROW][C]Estimates ( 8 )[/C][C]NA[/C][C]NA[/C][C]NA[/C][C]NA[/C][C]NA[/C][/ROW]
[ROW][C](p-val)[/C][C](NA )[/C][C](NA )[/C][C](NA )[/C][C](NA )[/C][C](NA )[/C][/ROW]
[ROW][C]Estimates ( 9 )[/C][C]NA[/C][C]NA[/C][C]NA[/C][C]NA[/C][C]NA[/C][/ROW]
[ROW][C](p-val)[/C][C](NA )[/C][C](NA )[/C][C](NA )[/C][C](NA )[/C][C](NA )[/C][/ROW]
[/TABLE]
Source: https://freestatistics.org/blog/index.php?pk=150156&T=1

Globally Unique Identifier (entire table): ba.freestatistics.org/blog/index.php?pk=150156&T=1

As an alternative you can also use a QR Code:  

The GUIDs for individual cells are displayed in the table below:

ARIMA Parameter Estimation and Backward Selection
Iterationar1ar2ar3sar1sar2
Estimates ( 1 )0.07810.30430.461-0.3676-0.3767
(p-val)(0.4972 )(0.007 )(5e-04 )(0.0221 )(0.0248 )
Estimates ( 2 )00.32960.4993-0.3846-0.3904
(p-val)(NA )(0.0021 )(0 )(0.0134 )(0.0183 )
Estimates ( 3 )NANANANANA
(p-val)(NA )(NA )(NA )(NA )(NA )
Estimates ( 4 )NANANANANA
(p-val)(NA )(NA )(NA )(NA )(NA )
Estimates ( 5 )NANANANANA
(p-val)(NA )(NA )(NA )(NA )(NA )
Estimates ( 6 )NANANANANA
(p-val)(NA )(NA )(NA )(NA )(NA )
Estimates ( 7 )NANANANANA
(p-val)(NA )(NA )(NA )(NA )(NA )
Estimates ( 8 )NANANANANA
(p-val)(NA )(NA )(NA )(NA )(NA )
Estimates ( 9 )NANANANANA
(p-val)(NA )(NA )(NA )(NA )(NA )


Estimated ARIMA Residuals
Value
9.74593016726995
107.212495023916
321.362213935008
175.011913979122
-351.349902970355
-388.720395328805
339.807777527026
206.289065105223
539.399566534473
-67.1429397177789
2.46543117140921
160.912523593756
223.371913367277
-235.32647011075
-186.643073579768
382.409470000813
208.666874782579
448.016710069357
-147.27445950777
-655.495720829117
123.936526418945
242.065913454676
420.153832700248
-148.379122234559
-251.121003094646
62.0469500775026
74.8044390682294
314.583724127557
-274.836208688736
507.562049049968
162.905523680772
-2.24065241528927
-48.9038470910265
306.564571708251
469.321210037021
114.740097325298
-713.030142464467
-158.115610821724
63.6207277837657
109.335151989448
-221.832031676158
334.494310049837
-181.48272989696
275.0453156001
426.617972345736
-229.94488823743
-27.6212752956971
-139.038752633538
210.959284752013
470.67423146075
230.816244692784
-578.226292899162
616.745093068358
-3.99250489281165
284.599031739296
272.359119327784
-647.254147297789
42.5260389397517
-141.108191714281
175.21480263842
-134.780717595268

\begin{tabular}{lllllllll}
\hline
Estimated ARIMA Residuals \tabularnewline
Value \tabularnewline
9.74593016726995 \tabularnewline
107.212495023916 \tabularnewline
321.362213935008 \tabularnewline
175.011913979122 \tabularnewline
-351.349902970355 \tabularnewline
-388.720395328805 \tabularnewline
339.807777527026 \tabularnewline
206.289065105223 \tabularnewline
539.399566534473 \tabularnewline
-67.1429397177789 \tabularnewline
2.46543117140921 \tabularnewline
160.912523593756 \tabularnewline
223.371913367277 \tabularnewline
-235.32647011075 \tabularnewline
-186.643073579768 \tabularnewline
382.409470000813 \tabularnewline
208.666874782579 \tabularnewline
448.016710069357 \tabularnewline
-147.27445950777 \tabularnewline
-655.495720829117 \tabularnewline
123.936526418945 \tabularnewline
242.065913454676 \tabularnewline
420.153832700248 \tabularnewline
-148.379122234559 \tabularnewline
-251.121003094646 \tabularnewline
62.0469500775026 \tabularnewline
74.8044390682294 \tabularnewline
314.583724127557 \tabularnewline
-274.836208688736 \tabularnewline
507.562049049968 \tabularnewline
162.905523680772 \tabularnewline
-2.24065241528927 \tabularnewline
-48.9038470910265 \tabularnewline
306.564571708251 \tabularnewline
469.321210037021 \tabularnewline
114.740097325298 \tabularnewline
-713.030142464467 \tabularnewline
-158.115610821724 \tabularnewline
63.6207277837657 \tabularnewline
109.335151989448 \tabularnewline
-221.832031676158 \tabularnewline
334.494310049837 \tabularnewline
-181.48272989696 \tabularnewline
275.0453156001 \tabularnewline
426.617972345736 \tabularnewline
-229.94488823743 \tabularnewline
-27.6212752956971 \tabularnewline
-139.038752633538 \tabularnewline
210.959284752013 \tabularnewline
470.67423146075 \tabularnewline
230.816244692784 \tabularnewline
-578.226292899162 \tabularnewline
616.745093068358 \tabularnewline
-3.99250489281165 \tabularnewline
284.599031739296 \tabularnewline
272.359119327784 \tabularnewline
-647.254147297789 \tabularnewline
42.5260389397517 \tabularnewline
-141.108191714281 \tabularnewline
175.21480263842 \tabularnewline
-134.780717595268 \tabularnewline
\hline
\end{tabular}
%Source: https://freestatistics.org/blog/index.php?pk=150156&T=2

[TABLE]
[ROW][C]Estimated ARIMA Residuals[/C][/ROW]
[ROW][C]Value[/C][/ROW]
[ROW][C]9.74593016726995[/C][/ROW]
[ROW][C]107.212495023916[/C][/ROW]
[ROW][C]321.362213935008[/C][/ROW]
[ROW][C]175.011913979122[/C][/ROW]
[ROW][C]-351.349902970355[/C][/ROW]
[ROW][C]-388.720395328805[/C][/ROW]
[ROW][C]339.807777527026[/C][/ROW]
[ROW][C]206.289065105223[/C][/ROW]
[ROW][C]539.399566534473[/C][/ROW]
[ROW][C]-67.1429397177789[/C][/ROW]
[ROW][C]2.46543117140921[/C][/ROW]
[ROW][C]160.912523593756[/C][/ROW]
[ROW][C]223.371913367277[/C][/ROW]
[ROW][C]-235.32647011075[/C][/ROW]
[ROW][C]-186.643073579768[/C][/ROW]
[ROW][C]382.409470000813[/C][/ROW]
[ROW][C]208.666874782579[/C][/ROW]
[ROW][C]448.016710069357[/C][/ROW]
[ROW][C]-147.27445950777[/C][/ROW]
[ROW][C]-655.495720829117[/C][/ROW]
[ROW][C]123.936526418945[/C][/ROW]
[ROW][C]242.065913454676[/C][/ROW]
[ROW][C]420.153832700248[/C][/ROW]
[ROW][C]-148.379122234559[/C][/ROW]
[ROW][C]-251.121003094646[/C][/ROW]
[ROW][C]62.0469500775026[/C][/ROW]
[ROW][C]74.8044390682294[/C][/ROW]
[ROW][C]314.583724127557[/C][/ROW]
[ROW][C]-274.836208688736[/C][/ROW]
[ROW][C]507.562049049968[/C][/ROW]
[ROW][C]162.905523680772[/C][/ROW]
[ROW][C]-2.24065241528927[/C][/ROW]
[ROW][C]-48.9038470910265[/C][/ROW]
[ROW][C]306.564571708251[/C][/ROW]
[ROW][C]469.321210037021[/C][/ROW]
[ROW][C]114.740097325298[/C][/ROW]
[ROW][C]-713.030142464467[/C][/ROW]
[ROW][C]-158.115610821724[/C][/ROW]
[ROW][C]63.6207277837657[/C][/ROW]
[ROW][C]109.335151989448[/C][/ROW]
[ROW][C]-221.832031676158[/C][/ROW]
[ROW][C]334.494310049837[/C][/ROW]
[ROW][C]-181.48272989696[/C][/ROW]
[ROW][C]275.0453156001[/C][/ROW]
[ROW][C]426.617972345736[/C][/ROW]
[ROW][C]-229.94488823743[/C][/ROW]
[ROW][C]-27.6212752956971[/C][/ROW]
[ROW][C]-139.038752633538[/C][/ROW]
[ROW][C]210.959284752013[/C][/ROW]
[ROW][C]470.67423146075[/C][/ROW]
[ROW][C]230.816244692784[/C][/ROW]
[ROW][C]-578.226292899162[/C][/ROW]
[ROW][C]616.745093068358[/C][/ROW]
[ROW][C]-3.99250489281165[/C][/ROW]
[ROW][C]284.599031739296[/C][/ROW]
[ROW][C]272.359119327784[/C][/ROW]
[ROW][C]-647.254147297789[/C][/ROW]
[ROW][C]42.5260389397517[/C][/ROW]
[ROW][C]-141.108191714281[/C][/ROW]
[ROW][C]175.21480263842[/C][/ROW]
[ROW][C]-134.780717595268[/C][/ROW]
[/TABLE]
Source: https://freestatistics.org/blog/index.php?pk=150156&T=2

Globally Unique Identifier (entire table): ba.freestatistics.org/blog/index.php?pk=150156&T=2

As an alternative you can also use a QR Code:  

The GUIDs for individual cells are displayed in the table below:

Estimated ARIMA Residuals
Value
9.74593016726995
107.212495023916
321.362213935008
175.011913979122
-351.349902970355
-388.720395328805
339.807777527026
206.289065105223
539.399566534473
-67.1429397177789
2.46543117140921
160.912523593756
223.371913367277
-235.32647011075
-186.643073579768
382.409470000813
208.666874782579
448.016710069357
-147.27445950777
-655.495720829117
123.936526418945
242.065913454676
420.153832700248
-148.379122234559
-251.121003094646
62.0469500775026
74.8044390682294
314.583724127557
-274.836208688736
507.562049049968
162.905523680772
-2.24065241528927
-48.9038470910265
306.564571708251
469.321210037021
114.740097325298
-713.030142464467
-158.115610821724
63.6207277837657
109.335151989448
-221.832031676158
334.494310049837
-181.48272989696
275.0453156001
426.617972345736
-229.94488823743
-27.6212752956971
-139.038752633538
210.959284752013
470.67423146075
230.816244692784
-578.226292899162
616.745093068358
-3.99250489281165
284.599031739296
272.359119327784
-647.254147297789
42.5260389397517
-141.108191714281
175.21480263842
-134.780717595268


Parameters (Session):
par1 = FALSE ; par2 = 1 ; par3 = 0 ; par4 = 1 ; par5 = 12 ; par6 = 3 ; par7 = 0 ; par8 = 2 ; par9 = 0 ;
Parameters (R input):
par1 = FALSE ; par2 = 1 ; par3 = 0 ; par4 = 1 ; par5 = 12 ; par6 = 3 ; par7 = 0 ; par8 = 2 ; par9 = 0 ;
R code (references can be found in the software module):
library(lattice)
if (par1 == 'TRUE') par1 <- TRUE
if (par1 == 'FALSE') par1 <- FALSE
par2 <- as.numeric(par2) #Box-Cox lambda transformation parameter
par3 <- as.numeric(par3) #degree of non-seasonal differencing
par4 <- as.numeric(par4) #degree of seasonal differencing
par5 <- as.numeric(par5) #seasonal period
par6 <- as.numeric(par6) #degree (p) of the non-seasonal AR(p) polynomial
par7 <- as.numeric(par7) #degree (q) of the non-seasonal MA(q) polynomial
par8 <- as.numeric(par8) #degree (P) of the seasonal AR(P) polynomial
par9 <- as.numeric(par9) #degree (Q) of the seasonal MA(Q) polynomial
armaGR <- function(arima.out, names, n){
try1 <- arima.out$coef
try2 <- sqrt(diag(arima.out$var.coef))
try.data.frame <- data.frame(matrix(NA,ncol=4,nrow=length(names)))
dimnames(try.data.frame) <- list(names,c('coef','std','tstat','pv'))
try.data.frame[,1] <- try1
for(i in 1:length(try2)) try.data.frame[which(rownames(try.data.frame)==names(try2)[i]),2] <- try2[i]
try.data.frame[,3] <- try.data.frame[,1] / try.data.frame[,2]
try.data.frame[,4] <- round((1-pt(abs(try.data.frame[,3]),df=n-(length(try2)+1)))*2,5)
vector <- rep(NA,length(names))
vector[is.na(try.data.frame[,4])] <- 0
maxi <- which.max(try.data.frame[,4])
continue <- max(try.data.frame[,4],na.rm=TRUE) > .05
vector[maxi] <- 0
list(summary=try.data.frame,next.vector=vector,continue=continue)
}
arimaSelect <- function(series, order=c(13,0,0), seasonal=list(order=c(2,0,0),period=12), include.mean=F){
nrc <- order[1]+order[3]+seasonal$order[1]+seasonal$order[3]
coeff <- matrix(NA, nrow=nrc*2, ncol=nrc)
pval <- matrix(NA, nrow=nrc*2, ncol=nrc)
mylist <- rep(list(NULL), nrc)
names <- NULL
if(order[1] > 0) names <- paste('ar',1:order[1],sep='')
if(order[3] > 0) names <- c( names , paste('ma',1:order[3],sep='') )
if(seasonal$order[1] > 0) names <- c(names, paste('sar',1:seasonal$order[1],sep=''))
if(seasonal$order[3] > 0) names <- c(names, paste('sma',1:seasonal$order[3],sep=''))
arima.out <- arima(series, order=order, seasonal=seasonal, include.mean=include.mean, method='ML')
mylist[[1]] <- arima.out
last.arma <- armaGR(arima.out, names, length(series))
mystop <- FALSE
i <- 1
coeff[i,] <- last.arma[[1]][,1]
pval [i,] <- last.arma[[1]][,4]
i <- 2
aic <- arima.out$aic
while(!mystop){
mylist[[i]] <- arima.out
arima.out <- arima(series, order=order, seasonal=seasonal, include.mean=include.mean, method='ML', fixed=last.arma$next.vector)
aic <- c(aic, arima.out$aic)
last.arma <- armaGR(arima.out, names, length(series))
mystop <- !last.arma$continue
coeff[i,] <- last.arma[[1]][,1]
pval [i,] <- last.arma[[1]][,4]
i <- i+1
}
list(coeff, pval, mylist, aic=aic)
}
arimaSelectplot <- function(arimaSelect.out,noms,choix){
noms <- names(arimaSelect.out[[3]][[1]]$coef)
coeff <- arimaSelect.out[[1]]
k <- min(which(is.na(coeff[,1])))-1
coeff <- coeff[1:k,]
pval <- arimaSelect.out[[2]][1:k,]
aic <- arimaSelect.out$aic[1:k]
coeff[coeff==0] <- NA
n <- ncol(coeff)
if(missing(choix)) choix <- k
layout(matrix(c(1,1,1,2,
3,3,3,2,
3,3,3,4,
5,6,7,7),nr=4),
widths=c(10,35,45,15),
heights=c(30,30,15,15))
couleurs <- rainbow(75)[1:50]#(50)
ticks <- pretty(coeff)
par(mar=c(1,1,3,1))
plot(aic,k:1-.5,type='o',pch=21,bg='blue',cex=2,axes=F,lty=2,xpd=NA)
points(aic[choix],k-choix+.5,pch=21,cex=4,bg=2,xpd=NA)
title('aic',line=2)
par(mar=c(3,0,0,0))
plot(0,axes=F,xlab='',ylab='',xlim=range(ticks),ylim=c(.1,1))
rect(xleft = min(ticks) + (0:49)/50*(max(ticks)-min(ticks)),
xright = min(ticks) + (1:50)/50*(max(ticks)-min(ticks)),
ytop = rep(1,50),
ybottom= rep(0,50),col=couleurs,border=NA)
axis(1,ticks)
rect(xleft=min(ticks),xright=max(ticks),ytop=1,ybottom=0)
text(mean(coeff,na.rm=T),.5,'coefficients',cex=2,font=2)
par(mar=c(1,1,3,1))
image(1:n,1:k,t(coeff[k:1,]),axes=F,col=couleurs,zlim=range(ticks))
for(i in 1:n) for(j in 1:k) if(!is.na(coeff[j,i])) {
if(pval[j,i]<.01) symb = 'green'
else if( (pval[j,i]<.05) & (pval[j,i]>=.01)) symb = 'orange'
else if( (pval[j,i]<.1) & (pval[j,i]>=.05)) symb = 'red'
else symb = 'black'
polygon(c(i+.5 ,i+.2 ,i+.5 ,i+.5),
c(k-j+0.5,k-j+0.5,k-j+0.8,k-j+0.5),
col=symb)
if(j==choix) {
rect(xleft=i-.5,
xright=i+.5,
ybottom=k-j+1.5,
ytop=k-j+.5,
lwd=4)
text(i,
k-j+1,
round(coeff[j,i],2),
cex=1.2,
font=2)
}
else{
rect(xleft=i-.5,xright=i+.5,ybottom=k-j+1.5,ytop=k-j+.5)
text(i,k-j+1,round(coeff[j,i],2),cex=1.2,font=1)
}
}
axis(3,1:n,noms)
par(mar=c(0.5,0,0,0.5))
plot(0,axes=F,xlab='',ylab='',type='n',xlim=c(0,8),ylim=c(-.2,.8))
cols <- c('green','orange','red','black')
niv <- c('0','0.01','0.05','0.1')
for(i in 0:3){
polygon(c(1+2*i ,1+2*i ,1+2*i-.5 ,1+2*i),
c(.4 ,.7 , .4 , .4),
col=cols[i+1])
text(2*i,0.5,niv[i+1],cex=1.5)
}
text(8,.5,1,cex=1.5)
text(4,0,'p-value',cex=2)
box()
residus <- arimaSelect.out[[3]][[choix]]$res
par(mar=c(1,2,4,1))
acf(residus,main='')
title('acf',line=.5)
par(mar=c(1,2,4,1))
pacf(residus,main='')
title('pacf',line=.5)
par(mar=c(2,2,4,1))
qqnorm(residus,main='')
title('qq-norm',line=.5)
qqline(residus)
residus
}
if (par2 == 0) x <- log(x)
if (par2 != 0) x <- x^par2
(selection <- arimaSelect(x, order=c(par6,par3,par7), seasonal=list(order=c(par8,par4,par9), period=par5)))
bitmap(file='test1.png')
resid <- arimaSelectplot(selection)
dev.off()
resid
bitmap(file='test2.png')
acf(resid,length(resid)/2, main='Residual Autocorrelation Function')
dev.off()
bitmap(file='test3.png')
pacf(resid,length(resid)/2, main='Residual Partial Autocorrelation Function')
dev.off()
bitmap(file='test4.png')
cpgram(resid, main='Residual Cumulative Periodogram')
dev.off()
bitmap(file='test5.png')
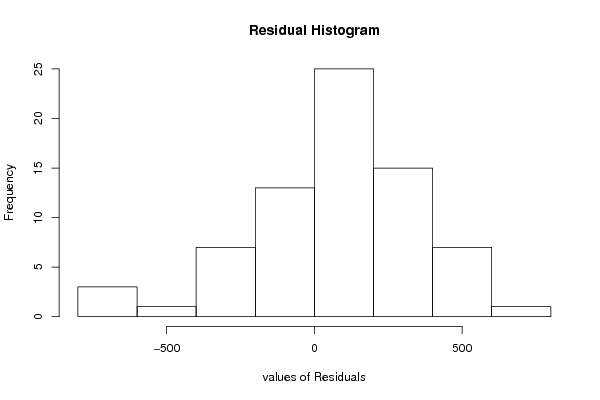
hist(resid, main='Residual Histogram', xlab='values of Residuals')
dev.off()
bitmap(file='test6.png')
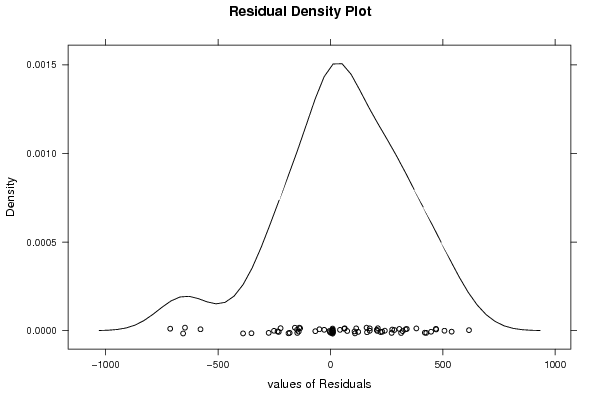
densityplot(~resid,col='black',main='Residual Density Plot', xlab='values of Residuals')
dev.off()
bitmap(file='test7.png')
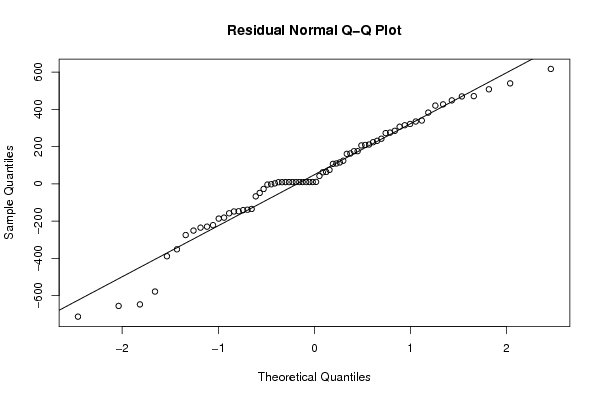
qqnorm(resid, main='Residual Normal Q-Q Plot')
qqline(resid)
dev.off()
ncols <- length(selection[[1]][1,])
nrows <- length(selection[[2]][,1])-1
load(file='createtable')
a<-table.start()
a<-table.row.start(a)
a<-table.element(a,'ARIMA Parameter Estimation and Backward Selection', ncols+1,TRUE)
a<-table.row.end(a)
a<-table.row.start(a)
a<-table.element(a,'Iteration', header=TRUE)
for (i in 1:ncols) {
a<-table.element(a,names(selection[[3]][[1]]$coef)[i],header=TRUE)
}
a<-table.row.end(a)
for (j in 1:nrows) {
a<-table.row.start(a)
mydum <- 'Estimates ('
mydum <- paste(mydum,j)
mydum <- paste(mydum,')')
a<-table.element(a,mydum, header=TRUE)
for (i in 1:ncols) {
a<-table.element(a,round(selection[[1]][j,i],4))
}
a<-table.row.end(a)
a<-table.row.start(a)
a<-table.element(a,'(p-val)', header=TRUE)
for (i in 1:ncols) {
mydum <- '('
mydum <- paste(mydum,round(selection[[2]][j,i],4),sep='')
mydum <- paste(mydum,')')
a<-table.element(a,mydum)
}
a<-table.row.end(a)
}
a<-table.end(a)
table.save(a,file='mytable.tab')
a<-table.start()
a<-table.row.start(a)
a<-table.element(a,'Estimated ARIMA Residuals', 1,TRUE)
a<-table.row.end(a)
a<-table.row.start(a)
a<-table.element(a,'Value', 1,TRUE)
a<-table.row.end(a)
for (i in (par4*par5+par3):length(resid)) {
a<-table.row.start(a)
a<-table.element(a,resid[i])
a<-table.row.end(a)
}
a<-table.end(a)
table.save(a,file='mytable1.tab')