Free Statistics

of Irreproducible Research!

Author's title

Author*The author of this computation has been verified*
R Software Modulerwasp_smp.wasp
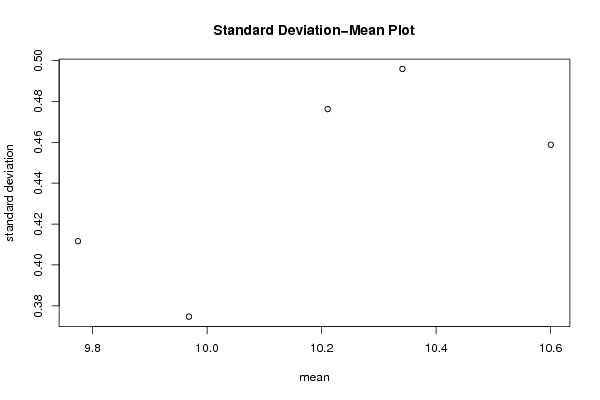
Title produced by softwareStandard Deviation-Mean Plot
Date of computationFri, 02 Dec 2011 07:18:07 -0500
Cite this page as followsStatistical Computations at FreeStatistics.org, Office for Research Development and Education, URL https://freestatistics.org/blog/index.php?v=date/2011/Dec/02/t1322828307oeuais083aqyuu8.htm/, Retrieved Mon, 29 Apr 2024 02:06:48 +0000
Statistical Computations at FreeStatistics.org, Office for Research Development and Education, URL https://freestatistics.org/blog/index.php?pk=150151, Retrieved Mon, 29 Apr 2024 02:06:48 +0000
QR Codes:

Original text written by user:
IsPrivate?No (this computation is public)
User-defined keywords
Estimated Impact90
Family? (F = Feedback message, R = changed R code, M = changed R Module, P = changed Parameters, D = changed Data)
-       [Standard Deviation-Mean Plot] [] [2011-12-02 12:18:07] [13d85cac30d4a10947636c080219d4f4] [Current]
Feedback Forum

Post a new message
Dataseries X:
9.829
9.125
9.782
9.441
9.162
9.915
10.444
10.209
9.985
9.842
9.429
10.132
9.849
9.172
10.313
9.819
9.955
10.048
10.082
10.541
10.208
10.233
9.439
9.963
10.158
9.225
10.474
9.757
10.490
10.281
10.444
10.640
10.695
10.786
9.832
9.747
10.411
9.511
10.402
9.701
10.540
10.112
10.915
11.183
10.384
10.834
9.886
10.216
10.943
9.867
10.203
10.837
10.573
10.647
11.502
10.656
10.866
10.835
9.945
10.331


Summary of computational transaction
Raw Inputview raw input (R code)
Raw Outputview raw output of R engine
Computing time2 seconds
R Server'George Udny Yule' @ yule.wessa.net

\begin{tabular}{lllllllll}
\hline
Summary of computational transaction \tabularnewline
Raw Input & view raw input (R code)  \tabularnewline
Raw Output & view raw output of R engine  \tabularnewline
Computing time & 2 seconds \tabularnewline
R Server & 'George Udny Yule' @ yule.wessa.net \tabularnewline
\hline
\end{tabular}
%Source: https://freestatistics.org/blog/index.php?pk=150151&T=0

[TABLE]
[ROW][C]Summary of computational transaction[/C][/ROW]
[ROW][C]Raw Input[/C][C]view raw input (R code) [/C][/ROW]
[ROW][C]Raw Output[/C][C]view raw output of R engine [/C][/ROW]
[ROW][C]Computing time[/C][C]2 seconds[/C][/ROW]
[ROW][C]R Server[/C][C]'George Udny Yule' @ yule.wessa.net[/C][/ROW]
[/TABLE]
Source: https://freestatistics.org/blog/index.php?pk=150151&T=0

Globally Unique Identifier (entire table): ba.freestatistics.org/blog/index.php?pk=150151&T=0

As an alternative you can also use a QR Code:  

The GUIDs for individual cells are displayed in the table below:

Summary of computational transaction
Raw Inputview raw input (R code)
Raw Outputview raw output of R engine
Computing time2 seconds
R Server'George Udny Yule' @ yule.wessa.net


Standard Deviation-Mean Plot
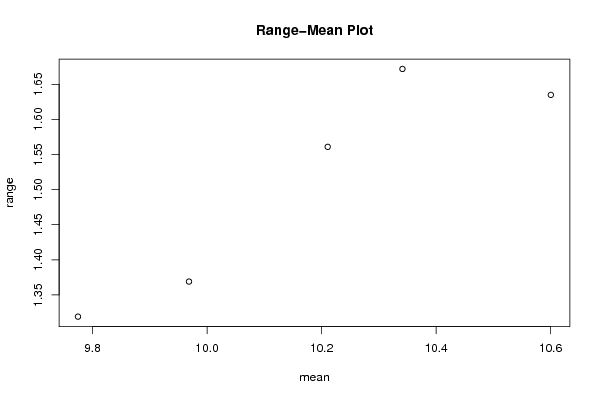
SectionMeanStandard DeviationRange
19.774583333333330.4116550759011131.319
29.96850.3747223214352441.369
310.210750.4762713369116771.561
410.341250.4959059890745421.672
510.60041666666670.4588284405731491.635

\begin{tabular}{lllllllll}
\hline
Standard Deviation-Mean Plot \tabularnewline
Section & Mean & Standard Deviation & Range \tabularnewline
1 & 9.77458333333333 & 0.411655075901113 & 1.319 \tabularnewline
2 & 9.9685 & 0.374722321435244 & 1.369 \tabularnewline
3 & 10.21075 & 0.476271336911677 & 1.561 \tabularnewline
4 & 10.34125 & 0.495905989074542 & 1.672 \tabularnewline
5 & 10.6004166666667 & 0.458828440573149 & 1.635 \tabularnewline
\hline
\end{tabular}
%Source: https://freestatistics.org/blog/index.php?pk=150151&T=1

[TABLE]
[ROW][C]Standard Deviation-Mean Plot[/C][/ROW]
[ROW][C]Section[/C][C]Mean[/C][C]Standard Deviation[/C][C]Range[/C][/ROW]
[ROW][C]1[/C][C]9.77458333333333[/C][C]0.411655075901113[/C][C]1.319[/C][/ROW]
[ROW][C]2[/C][C]9.9685[/C][C]0.374722321435244[/C][C]1.369[/C][/ROW]
[ROW][C]3[/C][C]10.21075[/C][C]0.476271336911677[/C][C]1.561[/C][/ROW]
[ROW][C]4[/C][C]10.34125[/C][C]0.495905989074542[/C][C]1.672[/C][/ROW]
[ROW][C]5[/C][C]10.6004166666667[/C][C]0.458828440573149[/C][C]1.635[/C][/ROW]
[/TABLE]
Source: https://freestatistics.org/blog/index.php?pk=150151&T=1

Globally Unique Identifier (entire table): ba.freestatistics.org/blog/index.php?pk=150151&T=1

As an alternative you can also use a QR Code:  

The GUIDs for individual cells are displayed in the table below:

Standard Deviation-Mean Plot
SectionMeanStandard DeviationRange
19.774583333333330.4116550759011131.319
29.96850.3747223214352441.369
310.210750.4762713369116771.561
410.341250.4959059890745421.672
510.60041666666670.4588284405731491.635


Regression: S.E.(k) = alpha + beta * Mean(k)
alpha-0.625738089574212
beta0.105040202213689
S.D.0.0650820015061208
T-STAT1.6139669921462
p-value0.204939535328753

\begin{tabular}{lllllllll}
\hline
Regression: S.E.(k) = alpha + beta * Mean(k) \tabularnewline
alpha & -0.625738089574212 \tabularnewline
beta & 0.105040202213689 \tabularnewline
S.D. & 0.0650820015061208 \tabularnewline
T-STAT & 1.6139669921462 \tabularnewline
p-value & 0.204939535328753 \tabularnewline
\hline
\end{tabular}
%Source: https://freestatistics.org/blog/index.php?pk=150151&T=2

[TABLE]
[ROW][C]Regression: S.E.(k) = alpha + beta * Mean(k)[/C][/ROW]
[ROW][C]alpha[/C][C]-0.625738089574212[/C][/ROW]
[ROW][C]beta[/C][C]0.105040202213689[/C][/ROW]
[ROW][C]S.D.[/C][C]0.0650820015061208[/C][/ROW]
[ROW][C]T-STAT[/C][C]1.6139669921462[/C][/ROW]
[ROW][C]p-value[/C][C]0.204939535328753[/C][/ROW]
[/TABLE]
Source: https://freestatistics.org/blog/index.php?pk=150151&T=2

Globally Unique Identifier (entire table): ba.freestatistics.org/blog/index.php?pk=150151&T=2

As an alternative you can also use a QR Code:  

The GUIDs for individual cells are displayed in the table below:

Regression: S.E.(k) = alpha + beta * Mean(k)
alpha-0.625738089574212
beta0.105040202213689
S.D.0.0650820015061208
T-STAT1.6139669921462
p-value0.204939535328753


Regression: ln S.E.(k) = alpha + beta * ln Mean(k)
alpha-6.58105637177999
beta2.48402544873842
S.D.1.52863668199313
T-STAT1.62499400805926
p-value0.202631936271243
Lambda-1.48402544873842

\begin{tabular}{lllllllll}
\hline
Regression: ln S.E.(k) = alpha + beta * ln Mean(k) \tabularnewline
alpha & -6.58105637177999 \tabularnewline
beta & 2.48402544873842 \tabularnewline
S.D. & 1.52863668199313 \tabularnewline
T-STAT & 1.62499400805926 \tabularnewline
p-value & 0.202631936271243 \tabularnewline
Lambda & -1.48402544873842 \tabularnewline
\hline
\end{tabular}
%Source: https://freestatistics.org/blog/index.php?pk=150151&T=3

[TABLE]
[ROW][C]Regression: ln S.E.(k) = alpha + beta * ln Mean(k)[/C][/ROW]
[ROW][C]alpha[/C][C]-6.58105637177999[/C][/ROW]
[ROW][C]beta[/C][C]2.48402544873842[/C][/ROW]
[ROW][C]S.D.[/C][C]1.52863668199313[/C][/ROW]
[ROW][C]T-STAT[/C][C]1.62499400805926[/C][/ROW]
[ROW][C]p-value[/C][C]0.202631936271243[/C][/ROW]
[ROW][C]Lambda[/C][C]-1.48402544873842[/C][/ROW]
[/TABLE]
Source: https://freestatistics.org/blog/index.php?pk=150151&T=3

Globally Unique Identifier (entire table): ba.freestatistics.org/blog/index.php?pk=150151&T=3

As an alternative you can also use a QR Code:  

The GUIDs for individual cells are displayed in the table below:

Regression: ln S.E.(k) = alpha + beta * ln Mean(k)
alpha-6.58105637177999
beta2.48402544873842
S.D.1.52863668199313
T-STAT1.62499400805926
p-value0.202631936271243
Lambda-1.48402544873842


Parameters (Session):
par1 = 1 ; par2 = 0 ; par3 = 2 ; par4 = 1 ;
Parameters (R input):
par1 = 12 ;
R code (references can be found in the software module):
par1 <- as.numeric(par1)
(n <- length(x))
(np <- floor(n / par1))
arr <- array(NA,dim=c(par1,np))
j <- 0
k <- 1
for (i in 1:(np*par1))
{
j = j + 1
arr[j,k] <- x[i]
if (j == par1) {
j = 0
k=k+1
}
}
arr
arr.mean <- array(NA,dim=np)
arr.sd <- array(NA,dim=np)
arr.range <- array(NA,dim=np)
for (j in 1:np)
{
arr.mean[j] <- mean(arr[,j],na.rm=TRUE)
arr.sd[j] <- sd(arr[,j],na.rm=TRUE)
arr.range[j] <- max(arr[,j],na.rm=TRUE) - min(arr[,j],na.rm=TRUE)
}
arr.mean
arr.sd
arr.range
(lm1 <- lm(arr.sd~arr.mean))
(lnlm1 <- lm(log(arr.sd)~log(arr.mean)))
(lm2 <- lm(arr.range~arr.mean))
bitmap(file='test1.png')
plot(arr.mean,arr.sd,main='Standard Deviation-Mean Plot',xlab='mean',ylab='standard deviation')
dev.off()
bitmap(file='test2.png')
plot(arr.mean,arr.range,main='Range-Mean Plot',xlab='mean',ylab='range')
dev.off()
load(file='createtable')
a<-table.start()
a<-table.row.start(a)
a<-table.element(a,'Standard Deviation-Mean Plot',4,TRUE)
a<-table.row.end(a)
a<-table.row.start(a)
a<-table.element(a,'Section',header=TRUE)
a<-table.element(a,'Mean',header=TRUE)
a<-table.element(a,'Standard Deviation',header=TRUE)
a<-table.element(a,'Range',header=TRUE)
a<-table.row.end(a)
for (j in 1:np) {
a<-table.row.start(a)
a<-table.element(a,j,header=TRUE)
a<-table.element(a,arr.mean[j])
a<-table.element(a,arr.sd[j] )
a<-table.element(a,arr.range[j] )
a<-table.row.end(a)
}
a<-table.end(a)
table.save(a,file='mytable.tab')
a<-table.start()
a<-table.row.start(a)
a<-table.element(a,'Regression: S.E.(k) = alpha + beta * Mean(k)',2,TRUE)
a<-table.row.end(a)
a<-table.row.start(a)
a<-table.element(a,'alpha',header=TRUE)
a<-table.element(a,lm1$coefficients[[1]])
a<-table.row.end(a)
a<-table.row.start(a)
a<-table.element(a,'beta',header=TRUE)
a<-table.element(a,lm1$coefficients[[2]])
a<-table.row.end(a)
a<-table.row.start(a)
a<-table.element(a,'S.D.',header=TRUE)
a<-table.element(a,summary(lm1)$coefficients[2,2])
a<-table.row.end(a)
a<-table.row.start(a)
a<-table.element(a,'T-STAT',header=TRUE)
a<-table.element(a,summary(lm1)$coefficients[2,3])
a<-table.row.end(a)
a<-table.row.start(a)
a<-table.element(a,'p-value',header=TRUE)
a<-table.element(a,summary(lm1)$coefficients[2,4])
a<-table.row.end(a)
a<-table.end(a)
table.save(a,file='mytable1.tab')
a<-table.start()
a<-table.row.start(a)
a<-table.element(a,'Regression: ln S.E.(k) = alpha + beta * ln Mean(k)',2,TRUE)
a<-table.row.end(a)
a<-table.row.start(a)
a<-table.element(a,'alpha',header=TRUE)
a<-table.element(a,lnlm1$coefficients[[1]])
a<-table.row.end(a)
a<-table.row.start(a)
a<-table.element(a,'beta',header=TRUE)
a<-table.element(a,lnlm1$coefficients[[2]])
a<-table.row.end(a)
a<-table.row.start(a)
a<-table.element(a,'S.D.',header=TRUE)
a<-table.element(a,summary(lnlm1)$coefficients[2,2])
a<-table.row.end(a)
a<-table.row.start(a)
a<-table.element(a,'T-STAT',header=TRUE)
a<-table.element(a,summary(lnlm1)$coefficients[2,3])
a<-table.row.end(a)
a<-table.row.start(a)
a<-table.element(a,'p-value',header=TRUE)
a<-table.element(a,summary(lnlm1)$coefficients[2,4])
a<-table.row.end(a)
a<-table.row.start(a)
a<-table.element(a,'Lambda',header=TRUE)
a<-table.element(a,1-lnlm1$coefficients[[2]])
a<-table.row.end(a)
a<-table.end(a)
table.save(a,file='mytable2.tab')