Free Statistics

of Irreproducible Research!

Author's title

Author*The author of this computation has been verified*
R Software Modulerwasp_autocorrelation.wasp
Title produced by software(Partial) Autocorrelation Function
Date of computationFri, 02 Dec 2011 05:58:37 -0500
Cite this page as followsStatistical Computations at FreeStatistics.org, Office for Research Development and Education, URL https://freestatistics.org/blog/index.php?v=date/2011/Dec/02/t13228235776l299u6k6jtgrxm.htm/, Retrieved Sun, 28 Apr 2024 23:54:27 +0000
Statistical Computations at FreeStatistics.org, Office for Research Development and Education, URL https://freestatistics.org/blog/index.php?pk=150096, Retrieved Sun, 28 Apr 2024 23:54:27 +0000
QR Codes:

Original text written by user:
IsPrivate?No (this computation is public)
User-defined keywords
Estimated Impact105
Family? (F = Feedback message, R = changed R code, M = changed R Module, P = changed Parameters, D = changed Data)
-       [(Partial) Autocorrelation Function] [] [2011-12-02 10:58:37] [13d85cac30d4a10947636c080219d4f4] [Current]
Feedback Forum

Post a new message
Dataseries X:
9.829
9.125
9.782
9.441
9.162
9.915
10.444
10.209
9.985
9.842
9.429
10.132
9.849
9.172
10.313
9.819
9.955
10.048
10.082
10.541
10.208
10.233
9.439
9.963
10.158
9.225
10.474
9.757
10.490
10.281
10.444
10.640
10.695
10.786
9.832
9.747
10.411
9.511
10.402
9.701
10.540
10.112
10.915
11.183
10.384
10.834
9.886
10.216
10.943
9.867
10.203
10.837
10.573
10.647
11.502
10.656
10.866
10.835
9.945
10.331


Summary of computational transaction
Raw Inputview raw input (R code)
Raw Outputview raw output of R engine
Computing time2 seconds
R Server'George Udny Yule' @ yule.wessa.net

\begin{tabular}{lllllllll}
\hline
Summary of computational transaction \tabularnewline
Raw Input & view raw input (R code)  \tabularnewline
Raw Output & view raw output of R engine  \tabularnewline
Computing time & 2 seconds \tabularnewline
R Server & 'George Udny Yule' @ yule.wessa.net \tabularnewline
\hline
\end{tabular}
%Source: https://freestatistics.org/blog/index.php?pk=150096&T=0

[TABLE]
[ROW][C]Summary of computational transaction[/C][/ROW]
[ROW][C]Raw Input[/C][C]view raw input (R code) [/C][/ROW]
[ROW][C]Raw Output[/C][C]view raw output of R engine [/C][/ROW]
[ROW][C]Computing time[/C][C]2 seconds[/C][/ROW]
[ROW][C]R Server[/C][C]'George Udny Yule' @ yule.wessa.net[/C][/ROW]
[/TABLE]
Source: https://freestatistics.org/blog/index.php?pk=150096&T=0

Globally Unique Identifier (entire table): ba.freestatistics.org/blog/index.php?pk=150096&T=0

As an alternative you can also use a QR Code:  

The GUIDs for individual cells are displayed in the table below:

Summary of computational transaction
Raw Inputview raw input (R code)
Raw Outputview raw output of R engine
Computing time2 seconds
R Server'George Udny Yule' @ yule.wessa.net


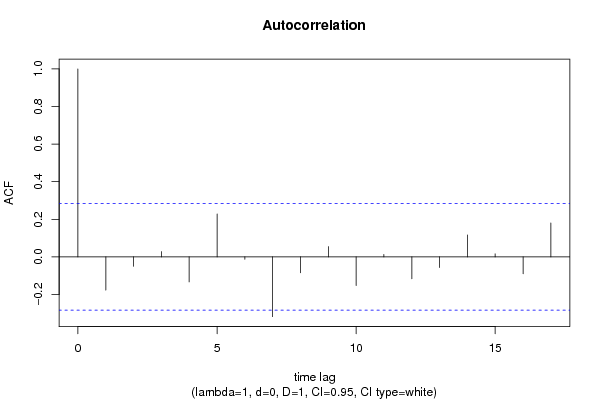
Autocorrelation Function
Time lag kACF(k)T-STATP-value
1-0.176736-1.22450.113377
2-0.049668-0.34410.366132
30.0278380.19290.423938
4-0.132901-0.92080.180888
50.2284021.58240.060061
6-0.013086-0.09070.464069
7-0.318036-2.20340.016198
8-0.084752-0.58720.279917
90.0546770.37880.353249
10-0.151878-1.05220.148978
110.0126570.08770.465245
12-0.116019-0.80380.212737
13-0.056265-0.38980.3492
140.1166260.8080.211537
150.0159950.11080.456113
16-0.089611-0.62080.26882
170.1805721.2510.108491

\begin{tabular}{lllllllll}
\hline
Autocorrelation Function \tabularnewline
Time lag k & ACF(k) & T-STAT & P-value \tabularnewline
1 & -0.176736 & -1.2245 & 0.113377 \tabularnewline
2 & -0.049668 & -0.3441 & 0.366132 \tabularnewline
3 & 0.027838 & 0.1929 & 0.423938 \tabularnewline
4 & -0.132901 & -0.9208 & 0.180888 \tabularnewline
5 & 0.228402 & 1.5824 & 0.060061 \tabularnewline
6 & -0.013086 & -0.0907 & 0.464069 \tabularnewline
7 & -0.318036 & -2.2034 & 0.016198 \tabularnewline
8 & -0.084752 & -0.5872 & 0.279917 \tabularnewline
9 & 0.054677 & 0.3788 & 0.353249 \tabularnewline
10 & -0.151878 & -1.0522 & 0.148978 \tabularnewline
11 & 0.012657 & 0.0877 & 0.465245 \tabularnewline
12 & -0.116019 & -0.8038 & 0.212737 \tabularnewline
13 & -0.056265 & -0.3898 & 0.3492 \tabularnewline
14 & 0.116626 & 0.808 & 0.211537 \tabularnewline
15 & 0.015995 & 0.1108 & 0.456113 \tabularnewline
16 & -0.089611 & -0.6208 & 0.26882 \tabularnewline
17 & 0.180572 & 1.251 & 0.108491 \tabularnewline
\hline
\end{tabular}
%Source: https://freestatistics.org/blog/index.php?pk=150096&T=1

[TABLE]
[ROW][C]Autocorrelation Function[/C][/ROW]
[ROW][C]Time lag k[/C][C]ACF(k)[/C][C]T-STAT[/C][C]P-value[/C][/ROW]
[ROW][C]1[/C][C]-0.176736[/C][C]-1.2245[/C][C]0.113377[/C][/ROW]
[ROW][C]2[/C][C]-0.049668[/C][C]-0.3441[/C][C]0.366132[/C][/ROW]
[ROW][C]3[/C][C]0.027838[/C][C]0.1929[/C][C]0.423938[/C][/ROW]
[ROW][C]4[/C][C]-0.132901[/C][C]-0.9208[/C][C]0.180888[/C][/ROW]
[ROW][C]5[/C][C]0.228402[/C][C]1.5824[/C][C]0.060061[/C][/ROW]
[ROW][C]6[/C][C]-0.013086[/C][C]-0.0907[/C][C]0.464069[/C][/ROW]
[ROW][C]7[/C][C]-0.318036[/C][C]-2.2034[/C][C]0.016198[/C][/ROW]
[ROW][C]8[/C][C]-0.084752[/C][C]-0.5872[/C][C]0.279917[/C][/ROW]
[ROW][C]9[/C][C]0.054677[/C][C]0.3788[/C][C]0.353249[/C][/ROW]
[ROW][C]10[/C][C]-0.151878[/C][C]-1.0522[/C][C]0.148978[/C][/ROW]
[ROW][C]11[/C][C]0.012657[/C][C]0.0877[/C][C]0.465245[/C][/ROW]
[ROW][C]12[/C][C]-0.116019[/C][C]-0.8038[/C][C]0.212737[/C][/ROW]
[ROW][C]13[/C][C]-0.056265[/C][C]-0.3898[/C][C]0.3492[/C][/ROW]
[ROW][C]14[/C][C]0.116626[/C][C]0.808[/C][C]0.211537[/C][/ROW]
[ROW][C]15[/C][C]0.015995[/C][C]0.1108[/C][C]0.456113[/C][/ROW]
[ROW][C]16[/C][C]-0.089611[/C][C]-0.6208[/C][C]0.26882[/C][/ROW]
[ROW][C]17[/C][C]0.180572[/C][C]1.251[/C][C]0.108491[/C][/ROW]
[/TABLE]
Source: https://freestatistics.org/blog/index.php?pk=150096&T=1

Globally Unique Identifier (entire table): ba.freestatistics.org/blog/index.php?pk=150096&T=1

As an alternative you can also use a QR Code:  

The GUIDs for individual cells are displayed in the table below:

Autocorrelation Function
Time lag kACF(k)T-STATP-value
1-0.176736-1.22450.113377
2-0.049668-0.34410.366132
30.0278380.19290.423938
4-0.132901-0.92080.180888
50.2284021.58240.060061
6-0.013086-0.09070.464069
7-0.318036-2.20340.016198
8-0.084752-0.58720.279917
90.0546770.37880.353249
10-0.151878-1.05220.148978
110.0126570.08770.465245
12-0.116019-0.80380.212737
13-0.056265-0.38980.3492
140.1166260.8080.211537
150.0159950.11080.456113
16-0.089611-0.62080.26882
170.1805721.2510.108491


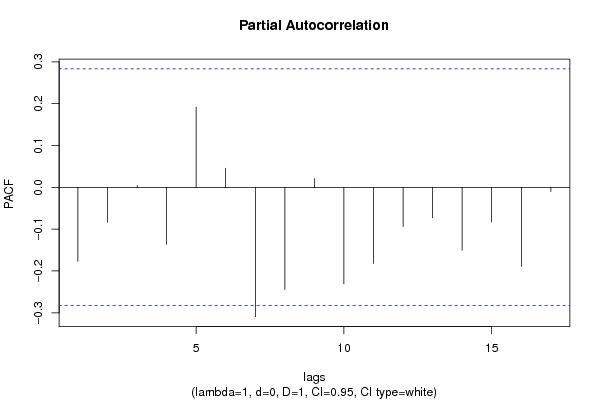
Partial Autocorrelation Function
Time lag kPACF(k)T-STATP-value
1-0.176736-1.22450.113377
2-0.083513-0.57860.282785
30.0037080.02570.489805
4-0.136213-0.94370.175021
50.1911751.32450.095805
60.0456620.31640.376553
7-0.309319-2.1430.018605
8-0.244548-1.69430.048346
90.0206260.14290.443484
10-0.231016-1.60050.058022
11-0.182406-1.26370.106212
12-0.093833-0.65010.259366
13-0.072843-0.50470.308049
14-0.150791-1.04470.150695
15-0.082707-0.5730.284656
16-0.189343-1.31180.097913
17-0.010002-0.06930.472521

\begin{tabular}{lllllllll}
\hline
Partial Autocorrelation Function \tabularnewline
Time lag k & PACF(k) & T-STAT & P-value \tabularnewline
1 & -0.176736 & -1.2245 & 0.113377 \tabularnewline
2 & -0.083513 & -0.5786 & 0.282785 \tabularnewline
3 & 0.003708 & 0.0257 & 0.489805 \tabularnewline
4 & -0.136213 & -0.9437 & 0.175021 \tabularnewline
5 & 0.191175 & 1.3245 & 0.095805 \tabularnewline
6 & 0.045662 & 0.3164 & 0.376553 \tabularnewline
7 & -0.309319 & -2.143 & 0.018605 \tabularnewline
8 & -0.244548 & -1.6943 & 0.048346 \tabularnewline
9 & 0.020626 & 0.1429 & 0.443484 \tabularnewline
10 & -0.231016 & -1.6005 & 0.058022 \tabularnewline
11 & -0.182406 & -1.2637 & 0.106212 \tabularnewline
12 & -0.093833 & -0.6501 & 0.259366 \tabularnewline
13 & -0.072843 & -0.5047 & 0.308049 \tabularnewline
14 & -0.150791 & -1.0447 & 0.150695 \tabularnewline
15 & -0.082707 & -0.573 & 0.284656 \tabularnewline
16 & -0.189343 & -1.3118 & 0.097913 \tabularnewline
17 & -0.010002 & -0.0693 & 0.472521 \tabularnewline
\hline
\end{tabular}
%Source: https://freestatistics.org/blog/index.php?pk=150096&T=2

[TABLE]
[ROW][C]Partial Autocorrelation Function[/C][/ROW]
[ROW][C]Time lag k[/C][C]PACF(k)[/C][C]T-STAT[/C][C]P-value[/C][/ROW]
[ROW][C]1[/C][C]-0.176736[/C][C]-1.2245[/C][C]0.113377[/C][/ROW]
[ROW][C]2[/C][C]-0.083513[/C][C]-0.5786[/C][C]0.282785[/C][/ROW]
[ROW][C]3[/C][C]0.003708[/C][C]0.0257[/C][C]0.489805[/C][/ROW]
[ROW][C]4[/C][C]-0.136213[/C][C]-0.9437[/C][C]0.175021[/C][/ROW]
[ROW][C]5[/C][C]0.191175[/C][C]1.3245[/C][C]0.095805[/C][/ROW]
[ROW][C]6[/C][C]0.045662[/C][C]0.3164[/C][C]0.376553[/C][/ROW]
[ROW][C]7[/C][C]-0.309319[/C][C]-2.143[/C][C]0.018605[/C][/ROW]
[ROW][C]8[/C][C]-0.244548[/C][C]-1.6943[/C][C]0.048346[/C][/ROW]
[ROW][C]9[/C][C]0.020626[/C][C]0.1429[/C][C]0.443484[/C][/ROW]
[ROW][C]10[/C][C]-0.231016[/C][C]-1.6005[/C][C]0.058022[/C][/ROW]
[ROW][C]11[/C][C]-0.182406[/C][C]-1.2637[/C][C]0.106212[/C][/ROW]
[ROW][C]12[/C][C]-0.093833[/C][C]-0.6501[/C][C]0.259366[/C][/ROW]
[ROW][C]13[/C][C]-0.072843[/C][C]-0.5047[/C][C]0.308049[/C][/ROW]
[ROW][C]14[/C][C]-0.150791[/C][C]-1.0447[/C][C]0.150695[/C][/ROW]
[ROW][C]15[/C][C]-0.082707[/C][C]-0.573[/C][C]0.284656[/C][/ROW]
[ROW][C]16[/C][C]-0.189343[/C][C]-1.3118[/C][C]0.097913[/C][/ROW]
[ROW][C]17[/C][C]-0.010002[/C][C]-0.0693[/C][C]0.472521[/C][/ROW]
[/TABLE]
Source: https://freestatistics.org/blog/index.php?pk=150096&T=2

Globally Unique Identifier (entire table): ba.freestatistics.org/blog/index.php?pk=150096&T=2

As an alternative you can also use a QR Code:  

The GUIDs for individual cells are displayed in the table below:

Partial Autocorrelation Function
Time lag kPACF(k)T-STATP-value
1-0.176736-1.22450.113377
2-0.083513-0.57860.282785
30.0037080.02570.489805
4-0.136213-0.94370.175021
50.1911751.32450.095805
60.0456620.31640.376553
7-0.309319-2.1430.018605
8-0.244548-1.69430.048346
90.0206260.14290.443484
10-0.231016-1.60050.058022
11-0.182406-1.26370.106212
12-0.093833-0.65010.259366
13-0.072843-0.50470.308049
14-0.150791-1.04470.150695
15-0.082707-0.5730.284656
16-0.189343-1.31180.097913
17-0.010002-0.06930.472521


Parameters (Session):
par1 = Default ; par2 = 1 ; par3 = 0 ; par4 = 1 ; par5 = 12 ; par6 = White Noise ; par7 = 0.95 ;
Parameters (R input):
par1 = Default ; par2 = 1 ; par3 = 0 ; par4 = 1 ; par5 = 12 ; par6 = White Noise ; par7 = 0.95 ; par8 = ;
R code (references can be found in the software module):
if (par1 == 'Default') {
par1 = 10*log10(length(x))
} else {
par1 <- as.numeric(par1)
}
par2 <- as.numeric(par2)
par3 <- as.numeric(par3)
par4 <- as.numeric(par4)
par5 <- as.numeric(par5)
if (par6 == 'White Noise') par6 <- 'white' else par6 <- 'ma'
par7 <- as.numeric(par7)
if (par8 != '') par8 <- as.numeric(par8)
ox <- x
if (par8 == '') {
if (par2 == 0) {
x <- log(x)
} else {
x <- (x ^ par2 - 1) / par2
}
} else {
x <- log(x,base=par8)
}
if (par3 > 0) x <- diff(x,lag=1,difference=par3)
if (par4 > 0) x <- diff(x,lag=par5,difference=par4)
bitmap(file='picts.png')
op <- par(mfrow=c(2,1))
plot(ox,type='l',main='Original Time Series',xlab='time',ylab='value')
if (par8=='') {
mytitle <- paste('Working Time Series (lambda=',par2,', d=',par3,', D=',par4,')',sep='')
mysub <- paste('(lambda=',par2,', d=',par3,', D=',par4,', CI=', par7, ', CI type=',par6,')',sep='')
} else {
mytitle <- paste('Working Time Series (base=',par8,', d=',par3,', D=',par4,')',sep='')
mysub <- paste('(base=',par8,', d=',par3,', D=',par4,', CI=', par7, ', CI type=',par6,')',sep='')
}
plot(x,type='l', main=mytitle,xlab='time',ylab='value')
par(op)
dev.off()
bitmap(file='pic1.png')
racf <- acf(x, par1, main='Autocorrelation', xlab='time lag', ylab='ACF', ci.type=par6, ci=par7, sub=mysub)
dev.off()
bitmap(file='pic2.png')
rpacf <- pacf(x,par1,main='Partial Autocorrelation',xlab='lags',ylab='PACF',sub=mysub)
dev.off()
(myacf <- c(racf$acf))
(mypacf <- c(rpacf$acf))
lengthx <- length(x)
sqrtn <- sqrt(lengthx)
load(file='createtable')
a<-table.start()
a<-table.row.start(a)
a<-table.element(a,'Autocorrelation Function',4,TRUE)
a<-table.row.end(a)
a<-table.row.start(a)
a<-table.element(a,'Time lag k',header=TRUE)
a<-table.element(a,hyperlink('basics.htm','ACF(k)','click here for more information about the Autocorrelation Function'),header=TRUE)
a<-table.element(a,'T-STAT',header=TRUE)
a<-table.element(a,'P-value',header=TRUE)
a<-table.row.end(a)
for (i in 2:(par1+1)) {
a<-table.row.start(a)
a<-table.element(a,i-1,header=TRUE)
a<-table.element(a,round(myacf[i],6))
mytstat <- myacf[i]*sqrtn
a<-table.element(a,round(mytstat,4))
a<-table.element(a,round(1-pt(abs(mytstat),lengthx),6))
a<-table.row.end(a)
}
a<-table.end(a)
table.save(a,file='mytable.tab')
a<-table.start()
a<-table.row.start(a)
a<-table.element(a,'Partial Autocorrelation Function',4,TRUE)
a<-table.row.end(a)
a<-table.row.start(a)
a<-table.element(a,'Time lag k',header=TRUE)
a<-table.element(a,hyperlink('basics.htm','PACF(k)','click here for more information about the Partial Autocorrelation Function'),header=TRUE)
a<-table.element(a,'T-STAT',header=TRUE)
a<-table.element(a,'P-value',header=TRUE)
a<-table.row.end(a)
for (i in 1:par1) {
a<-table.row.start(a)
a<-table.element(a,i,header=TRUE)
a<-table.element(a,round(mypacf[i],6))
mytstat <- mypacf[i]*sqrtn
a<-table.element(a,round(mytstat,4))
a<-table.element(a,round(1-pt(abs(mytstat),lengthx),6))
a<-table.row.end(a)
}
a<-table.end(a)
table.save(a,file='mytable1.tab')