Free Statistics

of Irreproducible Research!

Author's title

Author*The author of this computation has been verified*
R Software Modulerwasp_smp.wasp
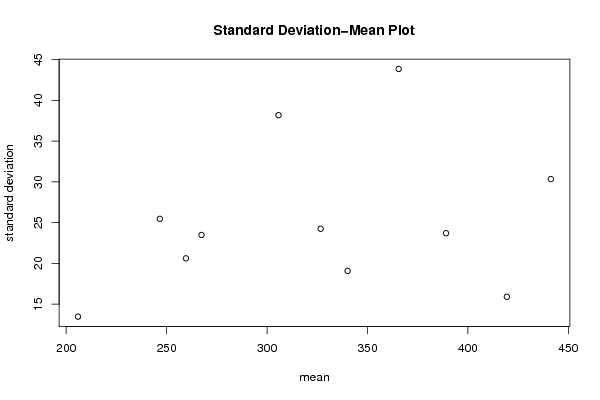
Title produced by softwareStandard Deviation-Mean Plot
Date of computationThu, 01 Dec 2011 16:39:37 -0500
Cite this page as followsStatistical Computations at FreeStatistics.org, Office for Research Development and Education, URL https://freestatistics.org/blog/index.php?v=date/2011/Dec/01/t13227756107l1gm5kcofwoo1i.htm/, Retrieved Sat, 27 Apr 2024 02:34:08 +0000
Statistical Computations at FreeStatistics.org, Office for Research Development and Education, URL https://freestatistics.org/blog/index.php?pk=150006, Retrieved Sat, 27 Apr 2024 02:34:08 +0000
QR Codes:

Original text written by user:
IsPrivate?No (this computation is public)
User-defined keywords
Estimated Impact130
Family? (F = Feedback message, R = changed R code, M = changed R Module, P = changed Parameters, D = changed Data)
-     [(Partial) Autocorrelation Function] [] [2011-12-01 19:58:02] [ee8c3a74bf3b349877806e9a50913c60]
- R P   [(Partial) Autocorrelation Function] [] [2011-12-01 20:01:46] [ee8c3a74bf3b349877806e9a50913c60]
- RMP     [Spectral Analysis] [] [2011-12-01 20:13:31] [ee8c3a74bf3b349877806e9a50913c60]
- RMP         [Standard Deviation-Mean Plot] [] [2011-12-01 21:39:37] [7dc03dd48c8acabd98b217fada4a6bc0] [Current]
Feedback Forum

Post a new message
Dataseries X:
274
291
280
258
252
251
224
225
234
233
229
208
224
226
223
205
201
202
183
188
200
206
211
201
299
244
251
241
244
252
234
246
265
277
287
275
320
338
342
322
323
343
315
334
359
362
378
345
422
430
443
431
425
432
387
396
411
421
424
410
464
486
490
459
454
446
406
412
428
429
425
396
429
439
424
379
370
353
322
322
338
348
350
312
358
378
352
312
310
292
276
269
286
292
288
255
304
299
293
275
272
264
234
231
263
264
264
245
297
317
318
315
312
310
306
313
350
354
371
357
419
425
424
399
393
378
371
364
384
377
383
352


Summary of computational transaction
Raw Inputview raw input (R code)
Raw Outputview raw output of R engine
Computing time0 seconds
R Server'Gwilym Jenkins' @ jenkins.wessa.net

\begin{tabular}{lllllllll}
\hline
Summary of computational transaction \tabularnewline
Raw Input & view raw input (R code)  \tabularnewline
Raw Output & view raw output of R engine  \tabularnewline
Computing time & 0 seconds \tabularnewline
R Server & 'Gwilym Jenkins' @ jenkins.wessa.net \tabularnewline
\hline
\end{tabular}
%Source: https://freestatistics.org/blog/index.php?pk=150006&T=0

[TABLE]
[ROW][C]Summary of computational transaction[/C][/ROW]
[ROW][C]Raw Input[/C][C]view raw input (R code) [/C][/ROW]
[ROW][C]Raw Output[/C][C]view raw output of R engine [/C][/ROW]
[ROW][C]Computing time[/C][C]0 seconds[/C][/ROW]
[ROW][C]R Server[/C][C]'Gwilym Jenkins' @ jenkins.wessa.net[/C][/ROW]
[/TABLE]
Source: https://freestatistics.org/blog/index.php?pk=150006&T=0

Globally Unique Identifier (entire table): ba.freestatistics.org/blog/index.php?pk=150006&T=0

As an alternative you can also use a QR Code:  

The GUIDs for individual cells are displayed in the table below:

Summary of computational transaction
Raw Inputview raw input (R code)
Raw Outputview raw output of R engine
Computing time0 seconds
R Server'Gwilym Jenkins' @ jenkins.wessa.net


Standard Deviation-Mean Plot
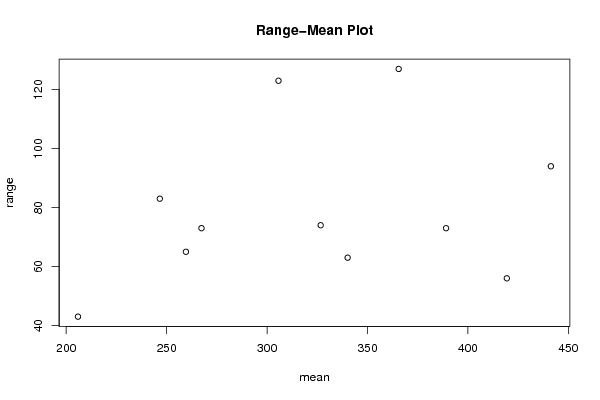
SectionMeanStandard DeviationRange
1246.58333333333325.471760953271583
2205.83333333333313.462630658323243
3259.58333333333320.619753694558165
4340.08333333333319.080967830100663
5419.33333333333315.899304349180856
6441.2530.349853975985494
7365.543.8644606611196127
8305.66666666666738.186940493347123
9267.33333333333323.48823045052573
10326.66666666666724.249960949671874
11389.08333333333323.704461924952373

\begin{tabular}{lllllllll}
\hline
Standard Deviation-Mean Plot \tabularnewline
Section & Mean & Standard Deviation & Range \tabularnewline
1 & 246.583333333333 & 25.4717609532715 & 83 \tabularnewline
2 & 205.833333333333 & 13.4626306583232 & 43 \tabularnewline
3 & 259.583333333333 & 20.6197536945581 & 65 \tabularnewline
4 & 340.083333333333 & 19.0809678301006 & 63 \tabularnewline
5 & 419.333333333333 & 15.8993043491808 & 56 \tabularnewline
6 & 441.25 & 30.3498539759854 & 94 \tabularnewline
7 & 365.5 & 43.8644606611196 & 127 \tabularnewline
8 & 305.666666666667 & 38.186940493347 & 123 \tabularnewline
9 & 267.333333333333 & 23.488230450525 & 73 \tabularnewline
10 & 326.666666666667 & 24.2499609496718 & 74 \tabularnewline
11 & 389.083333333333 & 23.7044619249523 & 73 \tabularnewline
\hline
\end{tabular}
%Source: https://freestatistics.org/blog/index.php?pk=150006&T=1

[TABLE]
[ROW][C]Standard Deviation-Mean Plot[/C][/ROW]
[ROW][C]Section[/C][C]Mean[/C][C]Standard Deviation[/C][C]Range[/C][/ROW]
[ROW][C]1[/C][C]246.583333333333[/C][C]25.4717609532715[/C][C]83[/C][/ROW]
[ROW][C]2[/C][C]205.833333333333[/C][C]13.4626306583232[/C][C]43[/C][/ROW]
[ROW][C]3[/C][C]259.583333333333[/C][C]20.6197536945581[/C][C]65[/C][/ROW]
[ROW][C]4[/C][C]340.083333333333[/C][C]19.0809678301006[/C][C]63[/C][/ROW]
[ROW][C]5[/C][C]419.333333333333[/C][C]15.8993043491808[/C][C]56[/C][/ROW]
[ROW][C]6[/C][C]441.25[/C][C]30.3498539759854[/C][C]94[/C][/ROW]
[ROW][C]7[/C][C]365.5[/C][C]43.8644606611196[/C][C]127[/C][/ROW]
[ROW][C]8[/C][C]305.666666666667[/C][C]38.186940493347[/C][C]123[/C][/ROW]
[ROW][C]9[/C][C]267.333333333333[/C][C]23.488230450525[/C][C]73[/C][/ROW]
[ROW][C]10[/C][C]326.666666666667[/C][C]24.2499609496718[/C][C]74[/C][/ROW]
[ROW][C]11[/C][C]389.083333333333[/C][C]23.7044619249523[/C][C]73[/C][/ROW]
[/TABLE]
Source: https://freestatistics.org/blog/index.php?pk=150006&T=1

Globally Unique Identifier (entire table): ba.freestatistics.org/blog/index.php?pk=150006&T=1

As an alternative you can also use a QR Code:  

The GUIDs for individual cells are displayed in the table below:

Standard Deviation-Mean Plot
SectionMeanStandard DeviationRange
1246.58333333333325.471760953271583
2205.83333333333313.462630658323243
3259.58333333333320.619753694558165
4340.08333333333319.080967830100663
5419.33333333333315.899304349180856
6441.2530.349853975985494
7365.543.8644606611196127
8305.66666666666738.186940493347123
9267.33333333333323.48823045052573
10326.66666666666724.249960949671874
11389.08333333333323.704461924952373


Regression: S.E.(k) = alpha + beta * Mean(k)
alpha14.9408671471312
beta0.0319684472553584
S.D.0.0389485641069823
T-STAT0.820786285408334
p-value0.432969769195702

\begin{tabular}{lllllllll}
\hline
Regression: S.E.(k) = alpha + beta * Mean(k) \tabularnewline
alpha & 14.9408671471312 \tabularnewline
beta & 0.0319684472553584 \tabularnewline
S.D. & 0.0389485641069823 \tabularnewline
T-STAT & 0.820786285408334 \tabularnewline
p-value & 0.432969769195702 \tabularnewline
\hline
\end{tabular}
%Source: https://freestatistics.org/blog/index.php?pk=150006&T=2

[TABLE]
[ROW][C]Regression: S.E.(k) = alpha + beta * Mean(k)[/C][/ROW]
[ROW][C]alpha[/C][C]14.9408671471312[/C][/ROW]
[ROW][C]beta[/C][C]0.0319684472553584[/C][/ROW]
[ROW][C]S.D.[/C][C]0.0389485641069823[/C][/ROW]
[ROW][C]T-STAT[/C][C]0.820786285408334[/C][/ROW]
[ROW][C]p-value[/C][C]0.432969769195702[/C][/ROW]
[/TABLE]
Source: https://freestatistics.org/blog/index.php?pk=150006&T=2

Globally Unique Identifier (entire table): ba.freestatistics.org/blog/index.php?pk=150006&T=2

As an alternative you can also use a QR Code:  

The GUIDs for individual cells are displayed in the table below:

Regression: S.E.(k) = alpha + beta * Mean(k)
alpha14.9408671471312
beta0.0319684472553584
S.D.0.0389485641069823
T-STAT0.820786285408334
p-value0.432969769195702


Regression: ln S.E.(k) = alpha + beta * ln Mean(k)
alpha0.35817173062132
beta0.489380785928451
S.D.0.456684684159484
T-STAT1.07159447842912
p-value0.311795335295064
Lambda0.510619214071549

\begin{tabular}{lllllllll}
\hline
Regression: ln S.E.(k) = alpha + beta * ln Mean(k) \tabularnewline
alpha & 0.35817173062132 \tabularnewline
beta & 0.489380785928451 \tabularnewline
S.D. & 0.456684684159484 \tabularnewline
T-STAT & 1.07159447842912 \tabularnewline
p-value & 0.311795335295064 \tabularnewline
Lambda & 0.510619214071549 \tabularnewline
\hline
\end{tabular}
%Source: https://freestatistics.org/blog/index.php?pk=150006&T=3

[TABLE]
[ROW][C]Regression: ln S.E.(k) = alpha + beta * ln Mean(k)[/C][/ROW]
[ROW][C]alpha[/C][C]0.35817173062132[/C][/ROW]
[ROW][C]beta[/C][C]0.489380785928451[/C][/ROW]
[ROW][C]S.D.[/C][C]0.456684684159484[/C][/ROW]
[ROW][C]T-STAT[/C][C]1.07159447842912[/C][/ROW]
[ROW][C]p-value[/C][C]0.311795335295064[/C][/ROW]
[ROW][C]Lambda[/C][C]0.510619214071549[/C][/ROW]
[/TABLE]
Source: https://freestatistics.org/blog/index.php?pk=150006&T=3

Globally Unique Identifier (entire table): ba.freestatistics.org/blog/index.php?pk=150006&T=3

As an alternative you can also use a QR Code:  

The GUIDs for individual cells are displayed in the table below:

Regression: ln S.E.(k) = alpha + beta * ln Mean(k)
alpha0.35817173062132
beta0.489380785928451
S.D.0.456684684159484
T-STAT1.07159447842912
p-value0.311795335295064
Lambda0.510619214071549


Parameters (Session):
par1 = 12 ;
Parameters (R input):
par1 = 12 ;
R code (references can be found in the software module):
par1 <- as.numeric(par1)
(n <- length(x))
(np <- floor(n / par1))
arr <- array(NA,dim=c(par1,np))
j <- 0
k <- 1
for (i in 1:(np*par1))
{
j = j + 1
arr[j,k] <- x[i]
if (j == par1) {
j = 0
k=k+1
}
}
arr
arr.mean <- array(NA,dim=np)
arr.sd <- array(NA,dim=np)
arr.range <- array(NA,dim=np)
for (j in 1:np)
{
arr.mean[j] <- mean(arr[,j],na.rm=TRUE)
arr.sd[j] <- sd(arr[,j],na.rm=TRUE)
arr.range[j] <- max(arr[,j],na.rm=TRUE) - min(arr[,j],na.rm=TRUE)
}
arr.mean
arr.sd
arr.range
(lm1 <- lm(arr.sd~arr.mean))
(lnlm1 <- lm(log(arr.sd)~log(arr.mean)))
(lm2 <- lm(arr.range~arr.mean))
bitmap(file='test1.png')
plot(arr.mean,arr.sd,main='Standard Deviation-Mean Plot',xlab='mean',ylab='standard deviation')
dev.off()
bitmap(file='test2.png')
plot(arr.mean,arr.range,main='Range-Mean Plot',xlab='mean',ylab='range')
dev.off()
load(file='createtable')
a<-table.start()
a<-table.row.start(a)
a<-table.element(a,'Standard Deviation-Mean Plot',4,TRUE)
a<-table.row.end(a)
a<-table.row.start(a)
a<-table.element(a,'Section',header=TRUE)
a<-table.element(a,'Mean',header=TRUE)
a<-table.element(a,'Standard Deviation',header=TRUE)
a<-table.element(a,'Range',header=TRUE)
a<-table.row.end(a)
for (j in 1:np) {
a<-table.row.start(a)
a<-table.element(a,j,header=TRUE)
a<-table.element(a,arr.mean[j])
a<-table.element(a,arr.sd[j] )
a<-table.element(a,arr.range[j] )
a<-table.row.end(a)
}
a<-table.end(a)
table.save(a,file='mytable.tab')
a<-table.start()
a<-table.row.start(a)
a<-table.element(a,'Regression: S.E.(k) = alpha + beta * Mean(k)',2,TRUE)
a<-table.row.end(a)
a<-table.row.start(a)
a<-table.element(a,'alpha',header=TRUE)
a<-table.element(a,lm1$coefficients[[1]])
a<-table.row.end(a)
a<-table.row.start(a)
a<-table.element(a,'beta',header=TRUE)
a<-table.element(a,lm1$coefficients[[2]])
a<-table.row.end(a)
a<-table.row.start(a)
a<-table.element(a,'S.D.',header=TRUE)
a<-table.element(a,summary(lm1)$coefficients[2,2])
a<-table.row.end(a)
a<-table.row.start(a)
a<-table.element(a,'T-STAT',header=TRUE)
a<-table.element(a,summary(lm1)$coefficients[2,3])
a<-table.row.end(a)
a<-table.row.start(a)
a<-table.element(a,'p-value',header=TRUE)
a<-table.element(a,summary(lm1)$coefficients[2,4])
a<-table.row.end(a)
a<-table.end(a)
table.save(a,file='mytable1.tab')
a<-table.start()
a<-table.row.start(a)
a<-table.element(a,'Regression: ln S.E.(k) = alpha + beta * ln Mean(k)',2,TRUE)
a<-table.row.end(a)
a<-table.row.start(a)
a<-table.element(a,'alpha',header=TRUE)
a<-table.element(a,lnlm1$coefficients[[1]])
a<-table.row.end(a)
a<-table.row.start(a)
a<-table.element(a,'beta',header=TRUE)
a<-table.element(a,lnlm1$coefficients[[2]])
a<-table.row.end(a)
a<-table.row.start(a)
a<-table.element(a,'S.D.',header=TRUE)
a<-table.element(a,summary(lnlm1)$coefficients[2,2])
a<-table.row.end(a)
a<-table.row.start(a)
a<-table.element(a,'T-STAT',header=TRUE)
a<-table.element(a,summary(lnlm1)$coefficients[2,3])
a<-table.row.end(a)
a<-table.row.start(a)
a<-table.element(a,'p-value',header=TRUE)
a<-table.element(a,summary(lnlm1)$coefficients[2,4])
a<-table.row.end(a)
a<-table.row.start(a)
a<-table.element(a,'Lambda',header=TRUE)
a<-table.element(a,1-lnlm1$coefficients[[2]])
a<-table.row.end(a)
a<-table.end(a)
table.save(a,file='mytable2.tab')