Free Statistics

of Irreproducible Research!

Author's title

Author*The author of this computation has been verified*
R Software Modulerwasp_arimabackwardselection.wasp
Title produced by softwareARIMA Backward Selection
Date of computationThu, 01 Dec 2011 11:44:11 -0500
Cite this page as followsStatistical Computations at FreeStatistics.org, Office for Research Development and Education, URL https://freestatistics.org/blog/index.php?v=date/2011/Dec/01/t13227578965zy3h3yciqpbqmu.htm/, Retrieved Fri, 26 Apr 2024 23:49:00 +0000
Statistical Computations at FreeStatistics.org, Office for Research Development and Education, URL https://freestatistics.org/blog/index.php?pk=149863, Retrieved Fri, 26 Apr 2024 23:49:00 +0000
QR Codes:

Original text written by user:
IsPrivate?No (this computation is public)
User-defined keywords
Estimated Impact111
Family? (F = Feedback message, R = changed R code, M = changed R Module, P = changed Parameters, D = changed Data)
-     [Univariate Explorative Data Analysis] [Run Sequence gebo...] [2008-12-12 13:32:37] [76963dc1903f0f612b6153510a3818cf]
- R  D  [Univariate Explorative Data Analysis] [Run Sequence gebo...] [2008-12-17 12:14:40] [76963dc1903f0f612b6153510a3818cf]
-         [Univariate Explorative Data Analysis] [Run Sequence Plot...] [2008-12-22 18:19:51] [1ce0d16c8f4225c977b42c8fa93bc163]
- RMP       [Univariate Data Series] [Identifying Integ...] [2009-11-22 12:08:06] [b98453cac15ba1066b407e146608df68]
- RMP         [Spectral Analysis] [Births] [2010-11-29 09:38:20] [b98453cac15ba1066b407e146608df68]
- R  D          [Spectral Analysis] [WS9 3.2 CP d=0, D=0] [2010-12-07 10:39:32] [afe9379cca749d06b3d6872e02cc47ed]
- R P             [Spectral Analysis] [] [2011-12-01 15:46:44] [c53df38315e3cbde2dbe0de809195ef2]
- RM                  [ARIMA Backward Selection] [] [2011-12-01 16:44:11] [ff205c8f94ca61ac7cf7eb30cad83105] [Current]
Feedback Forum

Post a new message
Dataseries X:
12008
9169
8788
8417
8247
8197
8236
8253
7733
8366
8626
8863
10102
8463
9114
8563
8872
8301
8301
8278
7736
7973
8268
9476
11100
8962
9173
8738
8459
8078
8411
8291
7810
8616
8312
9692
9911
8915
9452
9112
8472
8230
8384
8625
8221
8649
8625
10443
10357
8586
8892
8329
8101
7922
8120
7838
7735
8406
8209
9451
10041
9411
10405
8467
8464
8102
7627
7513
7510
8291
8064
9383
9706
8579
9474
8318
8213
8059
9111
7708
7680
8014
8007
8718
9486
9113
9025
8476
7952
7759
7835
7600
7651
8319
8812
8630


Summary of computational transaction
Raw Inputview raw input (R code)
Raw Outputview raw output of R engine
Computing time11 seconds
R Server'Herman Ole Andreas Wold' @ wold.wessa.net

\begin{tabular}{lllllllll}
\hline
Summary of computational transaction \tabularnewline
Raw Input & view raw input (R code)  \tabularnewline
Raw Output & view raw output of R engine  \tabularnewline
Computing time & 11 seconds \tabularnewline
R Server & 'Herman Ole Andreas Wold' @ wold.wessa.net \tabularnewline
\hline
\end{tabular}
%Source: https://freestatistics.org/blog/index.php?pk=149863&T=0

[TABLE]
[ROW][C]Summary of computational transaction[/C][/ROW]
[ROW][C]Raw Input[/C][C]view raw input (R code) [/C][/ROW]
[ROW][C]Raw Output[/C][C]view raw output of R engine [/C][/ROW]
[ROW][C]Computing time[/C][C]11 seconds[/C][/ROW]
[ROW][C]R Server[/C][C]'Herman Ole Andreas Wold' @ wold.wessa.net[/C][/ROW]
[/TABLE]
Source: https://freestatistics.org/blog/index.php?pk=149863&T=0

Globally Unique Identifier (entire table): ba.freestatistics.org/blog/index.php?pk=149863&T=0

As an alternative you can also use a QR Code:  

The GUIDs for individual cells are displayed in the table below:

Summary of computational transaction
Raw Inputview raw input (R code)
Raw Outputview raw output of R engine
Computing time11 seconds
R Server'Herman Ole Andreas Wold' @ wold.wessa.net


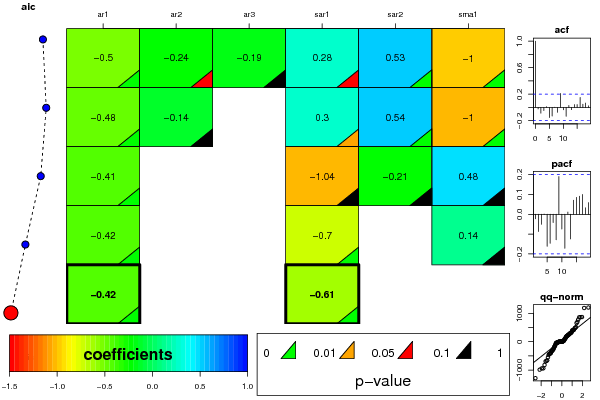
ARIMA Parameter Estimation and Backward Selection
Iterationar1ar2ar3sar1sar2sma1
Estimates ( 1 )-0.5047-0.2403-0.1860.28340.5294-0.9999
(p-val)(1e-04 )(0.0797 )(0.1239 )(0.0694 )(8e-04 )(5e-04 )
Estimates ( 2 )-0.4771-0.144300.29880.542-1.0001
(p-val)(2e-04 )(0.2338 )(NA )(0.0465 )(5e-04 )(1e-04 )
Estimates ( 3 )-0.411500-1.0383-0.20850.4809
(p-val)(3e-04 )(NA )(NA )(0.1088 )(0.624 )(0.4419 )
Estimates ( 4 )-0.415400-0.701900.1437
(p-val)(3e-04 )(NA )(NA )(0 )(NA )(0.5686 )
Estimates ( 5 )-0.417200-0.613200
(p-val)(3e-04 )(NA )(NA )(0 )(NA )(NA )
Estimates ( 6 )NANANANANANA
(p-val)(NA )(NA )(NA )(NA )(NA )(NA )
Estimates ( 7 )NANANANANANA
(p-val)(NA )(NA )(NA )(NA )(NA )(NA )
Estimates ( 8 )NANANANANANA
(p-val)(NA )(NA )(NA )(NA )(NA )(NA )
Estimates ( 9 )NANANANANANA
(p-val)(NA )(NA )(NA )(NA )(NA )(NA )
Estimates ( 10 )NANANANANANA
(p-val)(NA )(NA )(NA )(NA )(NA )(NA )
Estimates ( 11 )NANANANANANA
(p-val)(NA )(NA )(NA )(NA )(NA )(NA )

\begin{tabular}{lllllllll}
\hline
ARIMA Parameter Estimation and Backward Selection \tabularnewline
Iteration & ar1 & ar2 & ar3 & sar1 & sar2 & sma1 \tabularnewline
Estimates ( 1 ) & -0.5047 & -0.2403 & -0.186 & 0.2834 & 0.5294 & -0.9999 \tabularnewline
(p-val) & (1e-04 ) & (0.0797 ) & (0.1239 ) & (0.0694 ) & (8e-04 ) & (5e-04 ) \tabularnewline
Estimates ( 2 ) & -0.4771 & -0.1443 & 0 & 0.2988 & 0.542 & -1.0001 \tabularnewline
(p-val) & (2e-04 ) & (0.2338 ) & (NA ) & (0.0465 ) & (5e-04 ) & (1e-04 ) \tabularnewline
Estimates ( 3 ) & -0.4115 & 0 & 0 & -1.0383 & -0.2085 & 0.4809 \tabularnewline
(p-val) & (3e-04 ) & (NA ) & (NA ) & (0.1088 ) & (0.624 ) & (0.4419 ) \tabularnewline
Estimates ( 4 ) & -0.4154 & 0 & 0 & -0.7019 & 0 & 0.1437 \tabularnewline
(p-val) & (3e-04 ) & (NA ) & (NA ) & (0 ) & (NA ) & (0.5686 ) \tabularnewline
Estimates ( 5 ) & -0.4172 & 0 & 0 & -0.6132 & 0 & 0 \tabularnewline
(p-val) & (3e-04 ) & (NA ) & (NA ) & (0 ) & (NA ) & (NA ) \tabularnewline
Estimates ( 6 ) & NA & NA & NA & NA & NA & NA \tabularnewline
(p-val) & (NA ) & (NA ) & (NA ) & (NA ) & (NA ) & (NA ) \tabularnewline
Estimates ( 7 ) & NA & NA & NA & NA & NA & NA \tabularnewline
(p-val) & (NA ) & (NA ) & (NA ) & (NA ) & (NA ) & (NA ) \tabularnewline
Estimates ( 8 ) & NA & NA & NA & NA & NA & NA \tabularnewline
(p-val) & (NA ) & (NA ) & (NA ) & (NA ) & (NA ) & (NA ) \tabularnewline
Estimates ( 9 ) & NA & NA & NA & NA & NA & NA \tabularnewline
(p-val) & (NA ) & (NA ) & (NA ) & (NA ) & (NA ) & (NA ) \tabularnewline
Estimates ( 10 ) & NA & NA & NA & NA & NA & NA \tabularnewline
(p-val) & (NA ) & (NA ) & (NA ) & (NA ) & (NA ) & (NA ) \tabularnewline
Estimates ( 11 ) & NA & NA & NA & NA & NA & NA \tabularnewline
(p-val) & (NA ) & (NA ) & (NA ) & (NA ) & (NA ) & (NA ) \tabularnewline
\hline
\end{tabular}
%Source: https://freestatistics.org/blog/index.php?pk=149863&T=1

[TABLE]
[ROW][C]ARIMA Parameter Estimation and Backward Selection[/C][/ROW]
[ROW][C]Iteration[/C][C]ar1[/C][C]ar2[/C][C]ar3[/C][C]sar1[/C][C]sar2[/C][C]sma1[/C][/ROW]
[ROW][C]Estimates ( 1 )[/C][C]-0.5047[/C][C]-0.2403[/C][C]-0.186[/C][C]0.2834[/C][C]0.5294[/C][C]-0.9999[/C][/ROW]
[ROW][C](p-val)[/C][C](1e-04 )[/C][C](0.0797 )[/C][C](0.1239 )[/C][C](0.0694 )[/C][C](8e-04 )[/C][C](5e-04 )[/C][/ROW]
[ROW][C]Estimates ( 2 )[/C][C]-0.4771[/C][C]-0.1443[/C][C]0[/C][C]0.2988[/C][C]0.542[/C][C]-1.0001[/C][/ROW]
[ROW][C](p-val)[/C][C](2e-04 )[/C][C](0.2338 )[/C][C](NA )[/C][C](0.0465 )[/C][C](5e-04 )[/C][C](1e-04 )[/C][/ROW]
[ROW][C]Estimates ( 3 )[/C][C]-0.4115[/C][C]0[/C][C]0[/C][C]-1.0383[/C][C]-0.2085[/C][C]0.4809[/C][/ROW]
[ROW][C](p-val)[/C][C](3e-04 )[/C][C](NA )[/C][C](NA )[/C][C](0.1088 )[/C][C](0.624 )[/C][C](0.4419 )[/C][/ROW]
[ROW][C]Estimates ( 4 )[/C][C]-0.4154[/C][C]0[/C][C]0[/C][C]-0.7019[/C][C]0[/C][C]0.1437[/C][/ROW]
[ROW][C](p-val)[/C][C](3e-04 )[/C][C](NA )[/C][C](NA )[/C][C](0 )[/C][C](NA )[/C][C](0.5686 )[/C][/ROW]
[ROW][C]Estimates ( 5 )[/C][C]-0.4172[/C][C]0[/C][C]0[/C][C]-0.6132[/C][C]0[/C][C]0[/C][/ROW]
[ROW][C](p-val)[/C][C](3e-04 )[/C][C](NA )[/C][C](NA )[/C][C](0 )[/C][C](NA )[/C][C](NA )[/C][/ROW]
[ROW][C]Estimates ( 6 )[/C][C]NA[/C][C]NA[/C][C]NA[/C][C]NA[/C][C]NA[/C][C]NA[/C][/ROW]
[ROW][C](p-val)[/C][C](NA )[/C][C](NA )[/C][C](NA )[/C][C](NA )[/C][C](NA )[/C][C](NA )[/C][/ROW]
[ROW][C]Estimates ( 7 )[/C][C]NA[/C][C]NA[/C][C]NA[/C][C]NA[/C][C]NA[/C][C]NA[/C][/ROW]
[ROW][C](p-val)[/C][C](NA )[/C][C](NA )[/C][C](NA )[/C][C](NA )[/C][C](NA )[/C][C](NA )[/C][/ROW]
[ROW][C]Estimates ( 8 )[/C][C]NA[/C][C]NA[/C][C]NA[/C][C]NA[/C][C]NA[/C][C]NA[/C][/ROW]
[ROW][C](p-val)[/C][C](NA )[/C][C](NA )[/C][C](NA )[/C][C](NA )[/C][C](NA )[/C][C](NA )[/C][/ROW]
[ROW][C]Estimates ( 9 )[/C][C]NA[/C][C]NA[/C][C]NA[/C][C]NA[/C][C]NA[/C][C]NA[/C][/ROW]
[ROW][C](p-val)[/C][C](NA )[/C][C](NA )[/C][C](NA )[/C][C](NA )[/C][C](NA )[/C][C](NA )[/C][/ROW]
[ROW][C]Estimates ( 10 )[/C][C]NA[/C][C]NA[/C][C]NA[/C][C]NA[/C][C]NA[/C][C]NA[/C][/ROW]
[ROW][C](p-val)[/C][C](NA )[/C][C](NA )[/C][C](NA )[/C][C](NA )[/C][C](NA )[/C][C](NA )[/C][/ROW]
[ROW][C]Estimates ( 11 )[/C][C]NA[/C][C]NA[/C][C]NA[/C][C]NA[/C][C]NA[/C][C]NA[/C][/ROW]
[ROW][C](p-val)[/C][C](NA )[/C][C](NA )[/C][C](NA )[/C][C](NA )[/C][C](NA )[/C][C](NA )[/C][/ROW]
[/TABLE]
Source: https://freestatistics.org/blog/index.php?pk=149863&T=1

Globally Unique Identifier (entire table): ba.freestatistics.org/blog/index.php?pk=149863&T=1

As an alternative you can also use a QR Code:  

The GUIDs for individual cells are displayed in the table below:

ARIMA Parameter Estimation and Backward Selection
Iterationar1ar2ar3sar1sar2sma1
Estimates ( 1 )-0.5047-0.2403-0.1860.28340.5294-0.9999
(p-val)(1e-04 )(0.0797 )(0.1239 )(0.0694 )(8e-04 )(5e-04 )
Estimates ( 2 )-0.4771-0.144300.29880.542-1.0001
(p-val)(2e-04 )(0.2338 )(NA )(0.0465 )(5e-04 )(1e-04 )
Estimates ( 3 )-0.411500-1.0383-0.20850.4809
(p-val)(3e-04 )(NA )(NA )(0.1088 )(0.624 )(0.4419 )
Estimates ( 4 )-0.415400-0.701900.1437
(p-val)(3e-04 )(NA )(NA )(0 )(NA )(0.5686 )
Estimates ( 5 )-0.417200-0.613200
(p-val)(3e-04 )(NA )(NA )(0 )(NA )(NA )
Estimates ( 6 )NANANANANANA
(p-val)(NA )(NA )(NA )(NA )(NA )(NA )
Estimates ( 7 )NANANANANANA
(p-val)(NA )(NA )(NA )(NA )(NA )(NA )
Estimates ( 8 )NANANANANANA
(p-val)(NA )(NA )(NA )(NA )(NA )(NA )
Estimates ( 9 )NANANANANANA
(p-val)(NA )(NA )(NA )(NA )(NA )(NA )
Estimates ( 10 )NANANANANANA
(p-val)(NA )(NA )(NA )(NA )(NA )(NA )
Estimates ( 11 )NANANANANANA
(p-val)(NA )(NA )(NA )(NA )(NA )(NA )


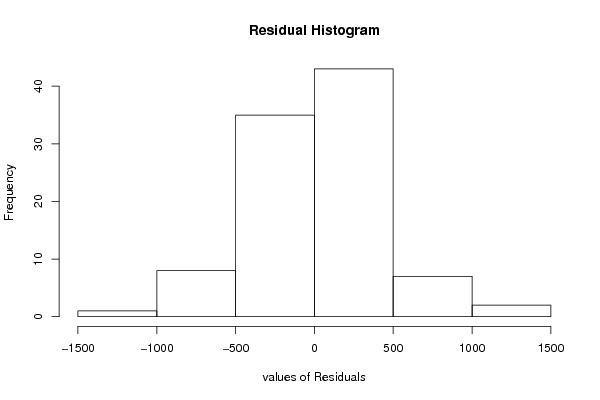
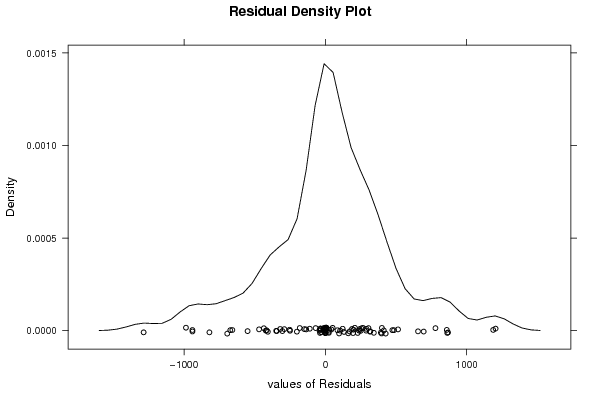
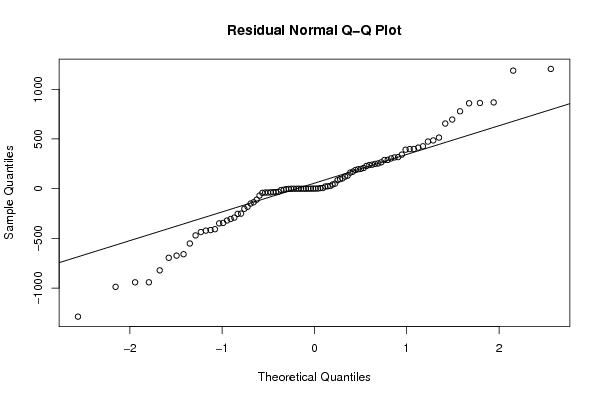
Estimated ARIMA Residuals
Value
-38.280044053756
859.061594731935
1204.53276745201
195.791539353491
317.945162827855
-253.056445721137
-202.096772735608
-41.8161927280077
-36.3693539104458
-304.697111204595
-136.239447540104
862.336025595192
413.311814253559
249.023485121188
289.655664403872
85.3132659148831
-290.885312540935
-250.704049313997
254.514460980409
6.53055785022062
-2.14971167106729
342.758339839525
-435.670573825077
514.160583111945
-821.05326360038
288.661101484534
304.568088434737
171.325240273351
-658.761387479998
-13.1677889160803
131.449841110918
314.689617807264
241.792327043744
22.0925476820357
-69.1612204779885
426.662956210618
-941.365501284877
-551.150080665501
-34.8785180830276
-181.832528841876
188.310072634641
228.344564170993
-33.8283982283357
-348.729808177616
208.31519761778
121.987562987415
24.1998632470292
-320.073754675388
485.589930830491
868.074372970429
778.867477870794
-1286.96055327368
-149.070042137192
42.013092628999
-694.904544964416
-415.742006256387
198.639283761698
392.348849933659
-38.3602139303856
-344.228569583785
1.76777060569047
265.373032511454
398.260944573013
161.242899650694
1.27030675545554
96.7464061373528
1187.48996595798
-673.254584019367
-469.820327816184
-407.386060629006
50.8411478438137
-421.852360295555
27.216591621056
474.018212229519
-941.412027794028
695.527198263535
-10.6078088040488
-110.696731916743
-30.3250094841501
399.761336193244
238.296396965615
104.298480990566
655.526494267071
-987.308561611881

\begin{tabular}{lllllllll}
\hline
Estimated ARIMA Residuals \tabularnewline
Value \tabularnewline
-38.280044053756 \tabularnewline
859.061594731935 \tabularnewline
1204.53276745201 \tabularnewline
195.791539353491 \tabularnewline
317.945162827855 \tabularnewline
-253.056445721137 \tabularnewline
-202.096772735608 \tabularnewline
-41.8161927280077 \tabularnewline
-36.3693539104458 \tabularnewline
-304.697111204595 \tabularnewline
-136.239447540104 \tabularnewline
862.336025595192 \tabularnewline
413.311814253559 \tabularnewline
249.023485121188 \tabularnewline
289.655664403872 \tabularnewline
85.3132659148831 \tabularnewline
-290.885312540935 \tabularnewline
-250.704049313997 \tabularnewline
254.514460980409 \tabularnewline
6.53055785022062 \tabularnewline
-2.14971167106729 \tabularnewline
342.758339839525 \tabularnewline
-435.670573825077 \tabularnewline
514.160583111945 \tabularnewline
-821.05326360038 \tabularnewline
288.661101484534 \tabularnewline
304.568088434737 \tabularnewline
171.325240273351 \tabularnewline
-658.761387479998 \tabularnewline
-13.1677889160803 \tabularnewline
131.449841110918 \tabularnewline
314.689617807264 \tabularnewline
241.792327043744 \tabularnewline
22.0925476820357 \tabularnewline
-69.1612204779885 \tabularnewline
426.662956210618 \tabularnewline
-941.365501284877 \tabularnewline
-551.150080665501 \tabularnewline
-34.8785180830276 \tabularnewline
-181.832528841876 \tabularnewline
188.310072634641 \tabularnewline
228.344564170993 \tabularnewline
-33.8283982283357 \tabularnewline
-348.729808177616 \tabularnewline
208.31519761778 \tabularnewline
121.987562987415 \tabularnewline
24.1998632470292 \tabularnewline
-320.073754675388 \tabularnewline
485.589930830491 \tabularnewline
868.074372970429 \tabularnewline
778.867477870794 \tabularnewline
-1286.96055327368 \tabularnewline
-149.070042137192 \tabularnewline
42.013092628999 \tabularnewline
-694.904544964416 \tabularnewline
-415.742006256387 \tabularnewline
198.639283761698 \tabularnewline
392.348849933659 \tabularnewline
-38.3602139303856 \tabularnewline
-344.228569583785 \tabularnewline
1.76777060569047 \tabularnewline
265.373032511454 \tabularnewline
398.260944573013 \tabularnewline
161.242899650694 \tabularnewline
1.27030675545554 \tabularnewline
96.7464061373528 \tabularnewline
1187.48996595798 \tabularnewline
-673.254584019367 \tabularnewline
-469.820327816184 \tabularnewline
-407.386060629006 \tabularnewline
50.8411478438137 \tabularnewline
-421.852360295555 \tabularnewline
27.216591621056 \tabularnewline
474.018212229519 \tabularnewline
-941.412027794028 \tabularnewline
695.527198263535 \tabularnewline
-10.6078088040488 \tabularnewline
-110.696731916743 \tabularnewline
-30.3250094841501 \tabularnewline
399.761336193244 \tabularnewline
238.296396965615 \tabularnewline
104.298480990566 \tabularnewline
655.526494267071 \tabularnewline
-987.308561611881 \tabularnewline
\hline
\end{tabular}
%Source: https://freestatistics.org/blog/index.php?pk=149863&T=2

[TABLE]
[ROW][C]Estimated ARIMA Residuals[/C][/ROW]
[ROW][C]Value[/C][/ROW]
[ROW][C]-38.280044053756[/C][/ROW]
[ROW][C]859.061594731935[/C][/ROW]
[ROW][C]1204.53276745201[/C][/ROW]
[ROW][C]195.791539353491[/C][/ROW]
[ROW][C]317.945162827855[/C][/ROW]
[ROW][C]-253.056445721137[/C][/ROW]
[ROW][C]-202.096772735608[/C][/ROW]
[ROW][C]-41.8161927280077[/C][/ROW]
[ROW][C]-36.3693539104458[/C][/ROW]
[ROW][C]-304.697111204595[/C][/ROW]
[ROW][C]-136.239447540104[/C][/ROW]
[ROW][C]862.336025595192[/C][/ROW]
[ROW][C]413.311814253559[/C][/ROW]
[ROW][C]249.023485121188[/C][/ROW]
[ROW][C]289.655664403872[/C][/ROW]
[ROW][C]85.3132659148831[/C][/ROW]
[ROW][C]-290.885312540935[/C][/ROW]
[ROW][C]-250.704049313997[/C][/ROW]
[ROW][C]254.514460980409[/C][/ROW]
[ROW][C]6.53055785022062[/C][/ROW]
[ROW][C]-2.14971167106729[/C][/ROW]
[ROW][C]342.758339839525[/C][/ROW]
[ROW][C]-435.670573825077[/C][/ROW]
[ROW][C]514.160583111945[/C][/ROW]
[ROW][C]-821.05326360038[/C][/ROW]
[ROW][C]288.661101484534[/C][/ROW]
[ROW][C]304.568088434737[/C][/ROW]
[ROW][C]171.325240273351[/C][/ROW]
[ROW][C]-658.761387479998[/C][/ROW]
[ROW][C]-13.1677889160803[/C][/ROW]
[ROW][C]131.449841110918[/C][/ROW]
[ROW][C]314.689617807264[/C][/ROW]
[ROW][C]241.792327043744[/C][/ROW]
[ROW][C]22.0925476820357[/C][/ROW]
[ROW][C]-69.1612204779885[/C][/ROW]
[ROW][C]426.662956210618[/C][/ROW]
[ROW][C]-941.365501284877[/C][/ROW]
[ROW][C]-551.150080665501[/C][/ROW]
[ROW][C]-34.8785180830276[/C][/ROW]
[ROW][C]-181.832528841876[/C][/ROW]
[ROW][C]188.310072634641[/C][/ROW]
[ROW][C]228.344564170993[/C][/ROW]
[ROW][C]-33.8283982283357[/C][/ROW]
[ROW][C]-348.729808177616[/C][/ROW]
[ROW][C]208.31519761778[/C][/ROW]
[ROW][C]121.987562987415[/C][/ROW]
[ROW][C]24.1998632470292[/C][/ROW]
[ROW][C]-320.073754675388[/C][/ROW]
[ROW][C]485.589930830491[/C][/ROW]
[ROW][C]868.074372970429[/C][/ROW]
[ROW][C]778.867477870794[/C][/ROW]
[ROW][C]-1286.96055327368[/C][/ROW]
[ROW][C]-149.070042137192[/C][/ROW]
[ROW][C]42.013092628999[/C][/ROW]
[ROW][C]-694.904544964416[/C][/ROW]
[ROW][C]-415.742006256387[/C][/ROW]
[ROW][C]198.639283761698[/C][/ROW]
[ROW][C]392.348849933659[/C][/ROW]
[ROW][C]-38.3602139303856[/C][/ROW]
[ROW][C]-344.228569583785[/C][/ROW]
[ROW][C]1.76777060569047[/C][/ROW]
[ROW][C]265.373032511454[/C][/ROW]
[ROW][C]398.260944573013[/C][/ROW]
[ROW][C]161.242899650694[/C][/ROW]
[ROW][C]1.27030675545554[/C][/ROW]
[ROW][C]96.7464061373528[/C][/ROW]
[ROW][C]1187.48996595798[/C][/ROW]
[ROW][C]-673.254584019367[/C][/ROW]
[ROW][C]-469.820327816184[/C][/ROW]
[ROW][C]-407.386060629006[/C][/ROW]
[ROW][C]50.8411478438137[/C][/ROW]
[ROW][C]-421.852360295555[/C][/ROW]
[ROW][C]27.216591621056[/C][/ROW]
[ROW][C]474.018212229519[/C][/ROW]
[ROW][C]-941.412027794028[/C][/ROW]
[ROW][C]695.527198263535[/C][/ROW]
[ROW][C]-10.6078088040488[/C][/ROW]
[ROW][C]-110.696731916743[/C][/ROW]
[ROW][C]-30.3250094841501[/C][/ROW]
[ROW][C]399.761336193244[/C][/ROW]
[ROW][C]238.296396965615[/C][/ROW]
[ROW][C]104.298480990566[/C][/ROW]
[ROW][C]655.526494267071[/C][/ROW]
[ROW][C]-987.308561611881[/C][/ROW]
[/TABLE]
Source: https://freestatistics.org/blog/index.php?pk=149863&T=2

Globally Unique Identifier (entire table): ba.freestatistics.org/blog/index.php?pk=149863&T=2

As an alternative you can also use a QR Code:  

The GUIDs for individual cells are displayed in the table below:

Estimated ARIMA Residuals
Value
-38.280044053756
859.061594731935
1204.53276745201
195.791539353491
317.945162827855
-253.056445721137
-202.096772735608
-41.8161927280077
-36.3693539104458
-304.697111204595
-136.239447540104
862.336025595192
413.311814253559
249.023485121188
289.655664403872
85.3132659148831
-290.885312540935
-250.704049313997
254.514460980409
6.53055785022062
-2.14971167106729
342.758339839525
-435.670573825077
514.160583111945
-821.05326360038
288.661101484534
304.568088434737
171.325240273351
-658.761387479998
-13.1677889160803
131.449841110918
314.689617807264
241.792327043744
22.0925476820357
-69.1612204779885
426.662956210618
-941.365501284877
-551.150080665501
-34.8785180830276
-181.832528841876
188.310072634641
228.344564170993
-33.8283982283357
-348.729808177616
208.31519761778
121.987562987415
24.1998632470292
-320.073754675388
485.589930830491
868.074372970429
778.867477870794
-1286.96055327368
-149.070042137192
42.013092628999
-694.904544964416
-415.742006256387
198.639283761698
392.348849933659
-38.3602139303856
-344.228569583785
1.76777060569047
265.373032511454
398.260944573013
161.242899650694
1.27030675545554
96.7464061373528
1187.48996595798
-673.254584019367
-469.820327816184
-407.386060629006
50.8411478438137
-421.852360295555
27.216591621056
474.018212229519
-941.412027794028
695.527198263535
-10.6078088040488
-110.696731916743
-30.3250094841501
399.761336193244
238.296396965615
104.298480990566
655.526494267071
-987.308561611881


Parameters (Session):
par1 = 0 ;
Parameters (R input):
par1 = FALSE ; par2 = 1 ; par3 = 1 ; par4 = 1 ; par5 = 12 ; par6 = 3 ; par7 = 0 ; par8 = 2 ; par9 = 1 ;
R code (references can be found in the software module):
library(lattice)
if (par1 == 'TRUE') par1 <- TRUE
if (par1 == 'FALSE') par1 <- FALSE
par2 <- as.numeric(par2) #Box-Cox lambda transformation parameter
par3 <- as.numeric(par3) #degree of non-seasonal differencing
par4 <- as.numeric(par4) #degree of seasonal differencing
par5 <- as.numeric(par5) #seasonal period
par6 <- as.numeric(par6) #degree (p) of the non-seasonal AR(p) polynomial
par7 <- as.numeric(par7) #degree (q) of the non-seasonal MA(q) polynomial
par8 <- as.numeric(par8) #degree (P) of the seasonal AR(P) polynomial
par9 <- as.numeric(par9) #degree (Q) of the seasonal MA(Q) polynomial
armaGR <- function(arima.out, names, n){
try1 <- arima.out$coef
try2 <- sqrt(diag(arima.out$var.coef))
try.data.frame <- data.frame(matrix(NA,ncol=4,nrow=length(names)))
dimnames(try.data.frame) <- list(names,c('coef','std','tstat','pv'))
try.data.frame[,1] <- try1
for(i in 1:length(try2)) try.data.frame[which(rownames(try.data.frame)==names(try2)[i]),2] <- try2[i]
try.data.frame[,3] <- try.data.frame[,1] / try.data.frame[,2]
try.data.frame[,4] <- round((1-pt(abs(try.data.frame[,3]),df=n-(length(try2)+1)))*2,5)
vector <- rep(NA,length(names))
vector[is.na(try.data.frame[,4])] <- 0
maxi <- which.max(try.data.frame[,4])
continue <- max(try.data.frame[,4],na.rm=TRUE) > .05
vector[maxi] <- 0
list(summary=try.data.frame,next.vector=vector,continue=continue)
}
arimaSelect <- function(series, order=c(13,0,0), seasonal=list(order=c(2,0,0),period=12), include.mean=F){
nrc <- order[1]+order[3]+seasonal$order[1]+seasonal$order[3]
coeff <- matrix(NA, nrow=nrc*2, ncol=nrc)
pval <- matrix(NA, nrow=nrc*2, ncol=nrc)
mylist <- rep(list(NULL), nrc)
names <- NULL
if(order[1] > 0) names <- paste('ar',1:order[1],sep='')
if(order[3] > 0) names <- c( names , paste('ma',1:order[3],sep='') )
if(seasonal$order[1] > 0) names <- c(names, paste('sar',1:seasonal$order[1],sep=''))
if(seasonal$order[3] > 0) names <- c(names, paste('sma',1:seasonal$order[3],sep=''))
arima.out <- arima(series, order=order, seasonal=seasonal, include.mean=include.mean, method='ML')
mylist[[1]] <- arima.out
last.arma <- armaGR(arima.out, names, length(series))
mystop <- FALSE
i <- 1
coeff[i,] <- last.arma[[1]][,1]
pval [i,] <- last.arma[[1]][,4]
i <- 2
aic <- arima.out$aic
while(!mystop){
mylist[[i]] <- arima.out
arima.out <- arima(series, order=order, seasonal=seasonal, include.mean=include.mean, method='ML', fixed=last.arma$next.vector)
aic <- c(aic, arima.out$aic)
last.arma <- armaGR(arima.out, names, length(series))
mystop <- !last.arma$continue
coeff[i,] <- last.arma[[1]][,1]
pval [i,] <- last.arma[[1]][,4]
i <- i+1
}
list(coeff, pval, mylist, aic=aic)
}
arimaSelectplot <- function(arimaSelect.out,noms,choix){
noms <- names(arimaSelect.out[[3]][[1]]$coef)
coeff <- arimaSelect.out[[1]]
k <- min(which(is.na(coeff[,1])))-1
coeff <- coeff[1:k,]
pval <- arimaSelect.out[[2]][1:k,]
aic <- arimaSelect.out$aic[1:k]
coeff[coeff==0] <- NA
n <- ncol(coeff)
if(missing(choix)) choix <- k
layout(matrix(c(1,1,1,2,
3,3,3,2,
3,3,3,4,
5,6,7,7),nr=4),
widths=c(10,35,45,15),
heights=c(30,30,15,15))
couleurs <- rainbow(75)[1:50]#(50)
ticks <- pretty(coeff)
par(mar=c(1,1,3,1))
plot(aic,k:1-.5,type='o',pch=21,bg='blue',cex=2,axes=F,lty=2,xpd=NA)
points(aic[choix],k-choix+.5,pch=21,cex=4,bg=2,xpd=NA)
title('aic',line=2)
par(mar=c(3,0,0,0))
plot(0,axes=F,xlab='',ylab='',xlim=range(ticks),ylim=c(.1,1))
rect(xleft = min(ticks) + (0:49)/50*(max(ticks)-min(ticks)),
xright = min(ticks) + (1:50)/50*(max(ticks)-min(ticks)),
ytop = rep(1,50),
ybottom= rep(0,50),col=couleurs,border=NA)
axis(1,ticks)
rect(xleft=min(ticks),xright=max(ticks),ytop=1,ybottom=0)
text(mean(coeff,na.rm=T),.5,'coefficients',cex=2,font=2)
par(mar=c(1,1,3,1))
image(1:n,1:k,t(coeff[k:1,]),axes=F,col=couleurs,zlim=range(ticks))
for(i in 1:n) for(j in 1:k) if(!is.na(coeff[j,i])) {
if(pval[j,i]<.01) symb = 'green'
else if( (pval[j,i]<.05) & (pval[j,i]>=.01)) symb = 'orange'
else if( (pval[j,i]<.1) & (pval[j,i]>=.05)) symb = 'red'
else symb = 'black'
polygon(c(i+.5 ,i+.2 ,i+.5 ,i+.5),
c(k-j+0.5,k-j+0.5,k-j+0.8,k-j+0.5),
col=symb)
if(j==choix) {
rect(xleft=i-.5,
xright=i+.5,
ybottom=k-j+1.5,
ytop=k-j+.5,
lwd=4)
text(i,
k-j+1,
round(coeff[j,i],2),
cex=1.2,
font=2)
}
else{
rect(xleft=i-.5,xright=i+.5,ybottom=k-j+1.5,ytop=k-j+.5)
text(i,k-j+1,round(coeff[j,i],2),cex=1.2,font=1)
}
}
axis(3,1:n,noms)
par(mar=c(0.5,0,0,0.5))
plot(0,axes=F,xlab='',ylab='',type='n',xlim=c(0,8),ylim=c(-.2,.8))
cols <- c('green','orange','red','black')
niv <- c('0','0.01','0.05','0.1')
for(i in 0:3){
polygon(c(1+2*i ,1+2*i ,1+2*i-.5 ,1+2*i),
c(.4 ,.7 , .4 , .4),
col=cols[i+1])
text(2*i,0.5,niv[i+1],cex=1.5)
}
text(8,.5,1,cex=1.5)
text(4,0,'p-value',cex=2)
box()
residus <- arimaSelect.out[[3]][[choix]]$res
par(mar=c(1,2,4,1))
acf(residus,main='')
title('acf',line=.5)
par(mar=c(1,2,4,1))
pacf(residus,main='')
title('pacf',line=.5)
par(mar=c(2,2,4,1))
qqnorm(residus,main='')
title('qq-norm',line=.5)
qqline(residus)
residus
}
if (par2 == 0) x <- log(x)
if (par2 != 0) x <- x^par2
(selection <- arimaSelect(x, order=c(par6,par3,par7), seasonal=list(order=c(par8,par4,par9), period=par5)))
bitmap(file='test1.png')
resid <- arimaSelectplot(selection)
dev.off()
resid
bitmap(file='test2.png')
acf(resid,length(resid)/2, main='Residual Autocorrelation Function')
dev.off()
bitmap(file='test3.png')
pacf(resid,length(resid)/2, main='Residual Partial Autocorrelation Function')
dev.off()
bitmap(file='test4.png')
cpgram(resid, main='Residual Cumulative Periodogram')
dev.off()
bitmap(file='test5.png')
hist(resid, main='Residual Histogram', xlab='values of Residuals')
dev.off()
bitmap(file='test6.png')
densityplot(~resid,col='black',main='Residual Density Plot', xlab='values of Residuals')
dev.off()
bitmap(file='test7.png')
qqnorm(resid, main='Residual Normal Q-Q Plot')
qqline(resid)
dev.off()
ncols <- length(selection[[1]][1,])
nrows <- length(selection[[2]][,1])-1
load(file='createtable')
a<-table.start()
a<-table.row.start(a)
a<-table.element(a,'ARIMA Parameter Estimation and Backward Selection', ncols+1,TRUE)
a<-table.row.end(a)
a<-table.row.start(a)
a<-table.element(a,'Iteration', header=TRUE)
for (i in 1:ncols) {
a<-table.element(a,names(selection[[3]][[1]]$coef)[i],header=TRUE)
}
a<-table.row.end(a)
for (j in 1:nrows) {
a<-table.row.start(a)
mydum <- 'Estimates ('
mydum <- paste(mydum,j)
mydum <- paste(mydum,')')
a<-table.element(a,mydum, header=TRUE)
for (i in 1:ncols) {
a<-table.element(a,round(selection[[1]][j,i],4))
}
a<-table.row.end(a)
a<-table.row.start(a)
a<-table.element(a,'(p-val)', header=TRUE)
for (i in 1:ncols) {
mydum <- '('
mydum <- paste(mydum,round(selection[[2]][j,i],4),sep='')
mydum <- paste(mydum,')')
a<-table.element(a,mydum)
}
a<-table.row.end(a)
}
a<-table.end(a)
table.save(a,file='mytable.tab')
a<-table.start()
a<-table.row.start(a)
a<-table.element(a,'Estimated ARIMA Residuals', 1,TRUE)
a<-table.row.end(a)
a<-table.row.start(a)
a<-table.element(a,'Value', 1,TRUE)
a<-table.row.end(a)
for (i in (par4*par5+par3):length(resid)) {
a<-table.row.start(a)
a<-table.element(a,resid[i])
a<-table.row.end(a)
}
a<-table.end(a)
table.save(a,file='mytable1.tab')