Free Statistics

of Irreproducible Research!

Author's title

Author*The author of this computation has been verified*
R Software Modulerwasp_exponentialsmoothing.wasp
Title produced by softwareExponential Smoothing
Date of computationThu, 01 Dec 2011 09:53:21 -0500
Cite this page as followsStatistical Computations at FreeStatistics.org, Office for Research Development and Education, URL https://freestatistics.org/blog/index.php?v=date/2011/Dec/01/t13227512874bkarezk29hg0qs.htm/, Retrieved Fri, 26 Apr 2024 10:43:30 +0000
Statistical Computations at FreeStatistics.org, Office for Research Development and Education, URL https://freestatistics.org/blog/index.php?pk=149758, Retrieved Fri, 26 Apr 2024 10:43:30 +0000
QR Codes:

Original text written by user:
IsPrivate?No (this computation is public)
User-defined keywords
Estimated Impact137
Family? (F = Feedback message, R = changed R code, M = changed R Module, P = changed Parameters, D = changed Data)
-     [Univariate Data Series] [data set] [2008-12-01 19:54:57] [b98453cac15ba1066b407e146608df68]
- RMPD  [Univariate Data Series] [ws 8 industrie] [2011-12-01 14:21:56] [141ef847e2c5f8e947fe4eabcb0cf143]
- RMPD    [Classical Decomposition] [ws8 classical] [2011-12-01 14:26:34] [141ef847e2c5f8e947fe4eabcb0cf143]
- RMPD        [Exponential Smoothing] [ws 8 smoothing] [2011-12-01 14:53:21] [1a4698f17d8e7f554418314cf0e4bd67] [Current]
Feedback Forum

Post a new message
Dataseries X:
114.7
108
101.3
108.4
105.6
120.4
107.6
111.4
122.1
104.8
103.2
112.3
123.1
115.5
106.3
119.9
119.5
120.9
127.5
116.6
126.7
110.6
100.4
125.2
125
105.2
102.7
94.2
97
111.1
102
97.3
109.8
98.9
93.2
115.2
115
107
104.1
106
110.8
127.8
116.9
113.8
131.6
106.1
107.2
127.4
123
121.8
117.6
118.4
121.8
141.9
122.1
132.2
131.6
108.8
120.4
134.7


Summary of computational transaction
Raw Inputview raw input (R code)
Raw Outputview raw output of R engine
Computing time2 seconds
R Server'Gertrude Mary Cox' @ cox.wessa.net

\begin{tabular}{lllllllll}
\hline
Summary of computational transaction \tabularnewline
Raw Input & view raw input (R code)  \tabularnewline
Raw Output & view raw output of R engine  \tabularnewline
Computing time & 2 seconds \tabularnewline
R Server & 'Gertrude Mary Cox' @ cox.wessa.net \tabularnewline
\hline
\end{tabular}
%Source: https://freestatistics.org/blog/index.php?pk=149758&T=0

[TABLE]
[ROW][C]Summary of computational transaction[/C][/ROW]
[ROW][C]Raw Input[/C][C]view raw input (R code) [/C][/ROW]
[ROW][C]Raw Output[/C][C]view raw output of R engine [/C][/ROW]
[ROW][C]Computing time[/C][C]2 seconds[/C][/ROW]
[ROW][C]R Server[/C][C]'Gertrude Mary Cox' @ cox.wessa.net[/C][/ROW]
[/TABLE]
Source: https://freestatistics.org/blog/index.php?pk=149758&T=0

Globally Unique Identifier (entire table): ba.freestatistics.org/blog/index.php?pk=149758&T=0

As an alternative you can also use a QR Code:  

The GUIDs for individual cells are displayed in the table below:

Summary of computational transaction
Raw Inputview raw input (R code)
Raw Outputview raw output of R engine
Computing time2 seconds
R Server'Gertrude Mary Cox' @ cox.wessa.net


Estimated Parameters of Exponential Smoothing
ParameterValue
alpha0.470508804820107
beta0
gamma1

\begin{tabular}{lllllllll}
\hline
Estimated Parameters of Exponential Smoothing \tabularnewline
Parameter & Value \tabularnewline
alpha & 0.470508804820107 \tabularnewline
beta & 0 \tabularnewline
gamma & 1 \tabularnewline
\hline
\end{tabular}
%Source: https://freestatistics.org/blog/index.php?pk=149758&T=1

[TABLE]
[ROW][C]Estimated Parameters of Exponential Smoothing[/C][/ROW]
[ROW][C]Parameter[/C][C]Value[/C][/ROW]
[ROW][C]alpha[/C][C]0.470508804820107[/C][/ROW]
[ROW][C]beta[/C][C]0[/C][/ROW]
[ROW][C]gamma[/C][C]1[/C][/ROW]
[/TABLE]
Source: https://freestatistics.org/blog/index.php?pk=149758&T=1

Globally Unique Identifier (entire table): ba.freestatistics.org/blog/index.php?pk=149758&T=1

As an alternative you can also use a QR Code:  

The GUIDs for individual cells are displayed in the table below:

Estimated Parameters of Exponential Smoothing
ParameterValue
alpha0.470508804820107
beta0
gamma1


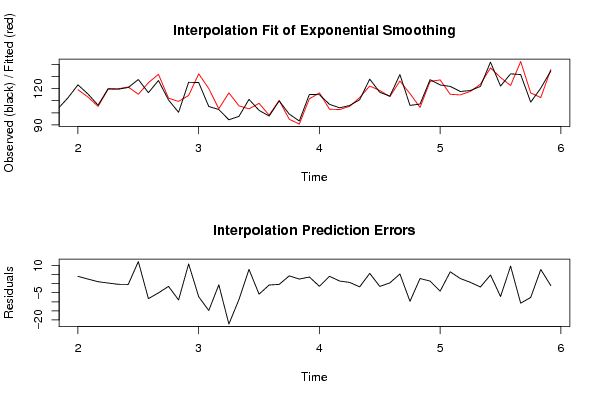
Interpolation Forecasts of Exponential Smoothing
tObservedFittedResiduals
13123.1119.0597222222224.04027777777776
14115.5112.9800266724042.51997332759613
15106.3105.2225144927681.07748550723214
16119.9119.5612990928050.338700907195161
17119.5119.860812366992-0.360812366992235
18120.9121.335365153253-0.43536515325259
19127.5115.30817353048712.1918264695131
20116.6124.847186746383-8.24718674638318
21126.7131.811130949032-5.11113094903239
22110.6112.083950350076-1.4839503500756
23100.4109.392556826267-8.99255682626732
24125.2114.32663117681510.8733688231851
25125132.197089970746-7.19708997074576
26105.2120.025126131882-14.8251261318816
27102.7103.342807336044-0.642807336043873
2894.2116.480999065596-22.2809990655964
2997105.767358220603-8.76735822060255
30111.1103.2470821207147.85291787928568
31102107.805587425703-5.80558742570271
3297.398.0543814039257-0.754381403925663
33109.8110.204270425294-0.404270425294385
3498.994.61226933629154.28773066370854
3593.290.66076153086742.53923846913257
36115.2111.5394798187673.6605201812328
37115116.448080994577-1.4480809945773
38107102.9420985141554.05790148584504
39104.1102.6538234037491.44617659625075
40106105.3176684661620.682331533838322
41110.8112.563830698444-1.76383069844447
42127.8122.1390658188815.66093418111882
43116.9118.434165195551-1.5341651955507
44113.8113.3672700557350.432729944264892
45131.6126.261086099255.33891390074957
46106.1115.855677067758-9.75567706775755
47107.2104.3708110531312.8291889468688
48127.4125.9796623876411.42033761235903
49123127.129278598114-4.12927859811434
50121.8115.2771382819646.52286171803637
51117.6114.7657633310632.834236668937
52118.4117.6782536442650.721746355735476
53121.8123.647739533315-1.84773953331501
54141.9137.1148424381534.7851575618474
55122.1129.188139436008-7.0881394360085
56132.2122.5495041726889.65049582731207
57131.6142.378141431839-10.7781414318388
58108.8116.397062945924-7.59706294592378
59120.4112.5914196290937.80858037090742
60134.7135.797144094318-1.09714409431791

\begin{tabular}{lllllllll}
\hline
Interpolation Forecasts of Exponential Smoothing \tabularnewline
t & Observed & Fitted & Residuals \tabularnewline
13 & 123.1 & 119.059722222222 & 4.04027777777776 \tabularnewline
14 & 115.5 & 112.980026672404 & 2.51997332759613 \tabularnewline
15 & 106.3 & 105.222514492768 & 1.07748550723214 \tabularnewline
16 & 119.9 & 119.561299092805 & 0.338700907195161 \tabularnewline
17 & 119.5 & 119.860812366992 & -0.360812366992235 \tabularnewline
18 & 120.9 & 121.335365153253 & -0.43536515325259 \tabularnewline
19 & 127.5 & 115.308173530487 & 12.1918264695131 \tabularnewline
20 & 116.6 & 124.847186746383 & -8.24718674638318 \tabularnewline
21 & 126.7 & 131.811130949032 & -5.11113094903239 \tabularnewline
22 & 110.6 & 112.083950350076 & -1.4839503500756 \tabularnewline
23 & 100.4 & 109.392556826267 & -8.99255682626732 \tabularnewline
24 & 125.2 & 114.326631176815 & 10.8733688231851 \tabularnewline
25 & 125 & 132.197089970746 & -7.19708997074576 \tabularnewline
26 & 105.2 & 120.025126131882 & -14.8251261318816 \tabularnewline
27 & 102.7 & 103.342807336044 & -0.642807336043873 \tabularnewline
28 & 94.2 & 116.480999065596 & -22.2809990655964 \tabularnewline
29 & 97 & 105.767358220603 & -8.76735822060255 \tabularnewline
30 & 111.1 & 103.247082120714 & 7.85291787928568 \tabularnewline
31 & 102 & 107.805587425703 & -5.80558742570271 \tabularnewline
32 & 97.3 & 98.0543814039257 & -0.754381403925663 \tabularnewline
33 & 109.8 & 110.204270425294 & -0.404270425294385 \tabularnewline
34 & 98.9 & 94.6122693362915 & 4.28773066370854 \tabularnewline
35 & 93.2 & 90.6607615308674 & 2.53923846913257 \tabularnewline
36 & 115.2 & 111.539479818767 & 3.6605201812328 \tabularnewline
37 & 115 & 116.448080994577 & -1.4480809945773 \tabularnewline
38 & 107 & 102.942098514155 & 4.05790148584504 \tabularnewline
39 & 104.1 & 102.653823403749 & 1.44617659625075 \tabularnewline
40 & 106 & 105.317668466162 & 0.682331533838322 \tabularnewline
41 & 110.8 & 112.563830698444 & -1.76383069844447 \tabularnewline
42 & 127.8 & 122.139065818881 & 5.66093418111882 \tabularnewline
43 & 116.9 & 118.434165195551 & -1.5341651955507 \tabularnewline
44 & 113.8 & 113.367270055735 & 0.432729944264892 \tabularnewline
45 & 131.6 & 126.26108609925 & 5.33891390074957 \tabularnewline
46 & 106.1 & 115.855677067758 & -9.75567706775755 \tabularnewline
47 & 107.2 & 104.370811053131 & 2.8291889468688 \tabularnewline
48 & 127.4 & 125.979662387641 & 1.42033761235903 \tabularnewline
49 & 123 & 127.129278598114 & -4.12927859811434 \tabularnewline
50 & 121.8 & 115.277138281964 & 6.52286171803637 \tabularnewline
51 & 117.6 & 114.765763331063 & 2.834236668937 \tabularnewline
52 & 118.4 & 117.678253644265 & 0.721746355735476 \tabularnewline
53 & 121.8 & 123.647739533315 & -1.84773953331501 \tabularnewline
54 & 141.9 & 137.114842438153 & 4.7851575618474 \tabularnewline
55 & 122.1 & 129.188139436008 & -7.0881394360085 \tabularnewline
56 & 132.2 & 122.549504172688 & 9.65049582731207 \tabularnewline
57 & 131.6 & 142.378141431839 & -10.7781414318388 \tabularnewline
58 & 108.8 & 116.397062945924 & -7.59706294592378 \tabularnewline
59 & 120.4 & 112.591419629093 & 7.80858037090742 \tabularnewline
60 & 134.7 & 135.797144094318 & -1.09714409431791 \tabularnewline
\hline
\end{tabular}
%Source: https://freestatistics.org/blog/index.php?pk=149758&T=2

[TABLE]
[ROW][C]Interpolation Forecasts of Exponential Smoothing[/C][/ROW]
[ROW][C]t[/C][C]Observed[/C][C]Fitted[/C][C]Residuals[/C][/ROW]
[ROW][C]13[/C][C]123.1[/C][C]119.059722222222[/C][C]4.04027777777776[/C][/ROW]
[ROW][C]14[/C][C]115.5[/C][C]112.980026672404[/C][C]2.51997332759613[/C][/ROW]
[ROW][C]15[/C][C]106.3[/C][C]105.222514492768[/C][C]1.07748550723214[/C][/ROW]
[ROW][C]16[/C][C]119.9[/C][C]119.561299092805[/C][C]0.338700907195161[/C][/ROW]
[ROW][C]17[/C][C]119.5[/C][C]119.860812366992[/C][C]-0.360812366992235[/C][/ROW]
[ROW][C]18[/C][C]120.9[/C][C]121.335365153253[/C][C]-0.43536515325259[/C][/ROW]
[ROW][C]19[/C][C]127.5[/C][C]115.308173530487[/C][C]12.1918264695131[/C][/ROW]
[ROW][C]20[/C][C]116.6[/C][C]124.847186746383[/C][C]-8.24718674638318[/C][/ROW]
[ROW][C]21[/C][C]126.7[/C][C]131.811130949032[/C][C]-5.11113094903239[/C][/ROW]
[ROW][C]22[/C][C]110.6[/C][C]112.083950350076[/C][C]-1.4839503500756[/C][/ROW]
[ROW][C]23[/C][C]100.4[/C][C]109.392556826267[/C][C]-8.99255682626732[/C][/ROW]
[ROW][C]24[/C][C]125.2[/C][C]114.326631176815[/C][C]10.8733688231851[/C][/ROW]
[ROW][C]25[/C][C]125[/C][C]132.197089970746[/C][C]-7.19708997074576[/C][/ROW]
[ROW][C]26[/C][C]105.2[/C][C]120.025126131882[/C][C]-14.8251261318816[/C][/ROW]
[ROW][C]27[/C][C]102.7[/C][C]103.342807336044[/C][C]-0.642807336043873[/C][/ROW]
[ROW][C]28[/C][C]94.2[/C][C]116.480999065596[/C][C]-22.2809990655964[/C][/ROW]
[ROW][C]29[/C][C]97[/C][C]105.767358220603[/C][C]-8.76735822060255[/C][/ROW]
[ROW][C]30[/C][C]111.1[/C][C]103.247082120714[/C][C]7.85291787928568[/C][/ROW]
[ROW][C]31[/C][C]102[/C][C]107.805587425703[/C][C]-5.80558742570271[/C][/ROW]
[ROW][C]32[/C][C]97.3[/C][C]98.0543814039257[/C][C]-0.754381403925663[/C][/ROW]
[ROW][C]33[/C][C]109.8[/C][C]110.204270425294[/C][C]-0.404270425294385[/C][/ROW]
[ROW][C]34[/C][C]98.9[/C][C]94.6122693362915[/C][C]4.28773066370854[/C][/ROW]
[ROW][C]35[/C][C]93.2[/C][C]90.6607615308674[/C][C]2.53923846913257[/C][/ROW]
[ROW][C]36[/C][C]115.2[/C][C]111.539479818767[/C][C]3.6605201812328[/C][/ROW]
[ROW][C]37[/C][C]115[/C][C]116.448080994577[/C][C]-1.4480809945773[/C][/ROW]
[ROW][C]38[/C][C]107[/C][C]102.942098514155[/C][C]4.05790148584504[/C][/ROW]
[ROW][C]39[/C][C]104.1[/C][C]102.653823403749[/C][C]1.44617659625075[/C][/ROW]
[ROW][C]40[/C][C]106[/C][C]105.317668466162[/C][C]0.682331533838322[/C][/ROW]
[ROW][C]41[/C][C]110.8[/C][C]112.563830698444[/C][C]-1.76383069844447[/C][/ROW]
[ROW][C]42[/C][C]127.8[/C][C]122.139065818881[/C][C]5.66093418111882[/C][/ROW]
[ROW][C]43[/C][C]116.9[/C][C]118.434165195551[/C][C]-1.5341651955507[/C][/ROW]
[ROW][C]44[/C][C]113.8[/C][C]113.367270055735[/C][C]0.432729944264892[/C][/ROW]
[ROW][C]45[/C][C]131.6[/C][C]126.26108609925[/C][C]5.33891390074957[/C][/ROW]
[ROW][C]46[/C][C]106.1[/C][C]115.855677067758[/C][C]-9.75567706775755[/C][/ROW]
[ROW][C]47[/C][C]107.2[/C][C]104.370811053131[/C][C]2.8291889468688[/C][/ROW]
[ROW][C]48[/C][C]127.4[/C][C]125.979662387641[/C][C]1.42033761235903[/C][/ROW]
[ROW][C]49[/C][C]123[/C][C]127.129278598114[/C][C]-4.12927859811434[/C][/ROW]
[ROW][C]50[/C][C]121.8[/C][C]115.277138281964[/C][C]6.52286171803637[/C][/ROW]
[ROW][C]51[/C][C]117.6[/C][C]114.765763331063[/C][C]2.834236668937[/C][/ROW]
[ROW][C]52[/C][C]118.4[/C][C]117.678253644265[/C][C]0.721746355735476[/C][/ROW]
[ROW][C]53[/C][C]121.8[/C][C]123.647739533315[/C][C]-1.84773953331501[/C][/ROW]
[ROW][C]54[/C][C]141.9[/C][C]137.114842438153[/C][C]4.7851575618474[/C][/ROW]
[ROW][C]55[/C][C]122.1[/C][C]129.188139436008[/C][C]-7.0881394360085[/C][/ROW]
[ROW][C]56[/C][C]132.2[/C][C]122.549504172688[/C][C]9.65049582731207[/C][/ROW]
[ROW][C]57[/C][C]131.6[/C][C]142.378141431839[/C][C]-10.7781414318388[/C][/ROW]
[ROW][C]58[/C][C]108.8[/C][C]116.397062945924[/C][C]-7.59706294592378[/C][/ROW]
[ROW][C]59[/C][C]120.4[/C][C]112.591419629093[/C][C]7.80858037090742[/C][/ROW]
[ROW][C]60[/C][C]134.7[/C][C]135.797144094318[/C][C]-1.09714409431791[/C][/ROW]
[/TABLE]
Source: https://freestatistics.org/blog/index.php?pk=149758&T=2

Globally Unique Identifier (entire table): ba.freestatistics.org/blog/index.php?pk=149758&T=2

As an alternative you can also use a QR Code:  

The GUIDs for individual cells are displayed in the table below:

Interpolation Forecasts of Exponential Smoothing
tObservedFittedResiduals
13123.1119.0597222222224.04027777777776
14115.5112.9800266724042.51997332759613
15106.3105.2225144927681.07748550723214
16119.9119.5612990928050.338700907195161
17119.5119.860812366992-0.360812366992235
18120.9121.335365153253-0.43536515325259
19127.5115.30817353048712.1918264695131
20116.6124.847186746383-8.24718674638318
21126.7131.811130949032-5.11113094903239
22110.6112.083950350076-1.4839503500756
23100.4109.392556826267-8.99255682626732
24125.2114.32663117681510.8733688231851
25125132.197089970746-7.19708997074576
26105.2120.025126131882-14.8251261318816
27102.7103.342807336044-0.642807336043873
2894.2116.480999065596-22.2809990655964
2997105.767358220603-8.76735822060255
30111.1103.2470821207147.85291787928568
31102107.805587425703-5.80558742570271
3297.398.0543814039257-0.754381403925663
33109.8110.204270425294-0.404270425294385
3498.994.61226933629154.28773066370854
3593.290.66076153086742.53923846913257
36115.2111.5394798187673.6605201812328
37115116.448080994577-1.4480809945773
38107102.9420985141554.05790148584504
39104.1102.6538234037491.44617659625075
40106105.3176684661620.682331533838322
41110.8112.563830698444-1.76383069844447
42127.8122.1390658188815.66093418111882
43116.9118.434165195551-1.5341651955507
44113.8113.3672700557350.432729944264892
45131.6126.261086099255.33891390074957
46106.1115.855677067758-9.75567706775755
47107.2104.3708110531312.8291889468688
48127.4125.9796623876411.42033761235903
49123127.129278598114-4.12927859811434
50121.8115.2771382819646.52286171803637
51117.6114.7657633310632.834236668937
52118.4117.6782536442650.721746355735476
53121.8123.647739533315-1.84773953331501
54141.9137.1148424381534.7851575618474
55122.1129.188139436008-7.0881394360085
56132.2122.5495041726889.65049582731207
57131.6142.378141431839-10.7781414318388
58108.8116.397062945924-7.59706294592378
59120.4112.5914196290937.80858037090742
60134.7135.797144094318-1.09714409431791


Extrapolation Forecasts of Exponential Smoothing
tForecast95% Lower Bound95% Upper Bound
61132.823790075753119.731523874954145.916056276552
62128.554726204793114.085677824516143.023774585069
63123.021192897114107.295440521187138.746945273041
64123.481604881894106.592400799191140.370808964597
65127.750982601332109.773464938835145.72850026383
66145.599523836032126.595917124052164.603130548012
67129.134555850466109.157494134043149.11161756689
68134.693912592836113.788675890517155.599149295156
69139.165123036113117.371205344743160.959040727483
70119.93960804294397.2918537371307142.587362348755
71127.865602225285104.395052554376151.336151896195
72142.681818181818118.416356541601166.947279822035

\begin{tabular}{lllllllll}
\hline
Extrapolation Forecasts of Exponential Smoothing \tabularnewline
t & Forecast & 95% Lower Bound & 95% Upper Bound \tabularnewline
61 & 132.823790075753 & 119.731523874954 & 145.916056276552 \tabularnewline
62 & 128.554726204793 & 114.085677824516 & 143.023774585069 \tabularnewline
63 & 123.021192897114 & 107.295440521187 & 138.746945273041 \tabularnewline
64 & 123.481604881894 & 106.592400799191 & 140.370808964597 \tabularnewline
65 & 127.750982601332 & 109.773464938835 & 145.72850026383 \tabularnewline
66 & 145.599523836032 & 126.595917124052 & 164.603130548012 \tabularnewline
67 & 129.134555850466 & 109.157494134043 & 149.11161756689 \tabularnewline
68 & 134.693912592836 & 113.788675890517 & 155.599149295156 \tabularnewline
69 & 139.165123036113 & 117.371205344743 & 160.959040727483 \tabularnewline
70 & 119.939608042943 & 97.2918537371307 & 142.587362348755 \tabularnewline
71 & 127.865602225285 & 104.395052554376 & 151.336151896195 \tabularnewline
72 & 142.681818181818 & 118.416356541601 & 166.947279822035 \tabularnewline
\hline
\end{tabular}
%Source: https://freestatistics.org/blog/index.php?pk=149758&T=3

[TABLE]
[ROW][C]Extrapolation Forecasts of Exponential Smoothing[/C][/ROW]
[ROW][C]t[/C][C]Forecast[/C][C]95% Lower Bound[/C][C]95% Upper Bound[/C][/ROW]
[ROW][C]61[/C][C]132.823790075753[/C][C]119.731523874954[/C][C]145.916056276552[/C][/ROW]
[ROW][C]62[/C][C]128.554726204793[/C][C]114.085677824516[/C][C]143.023774585069[/C][/ROW]
[ROW][C]63[/C][C]123.021192897114[/C][C]107.295440521187[/C][C]138.746945273041[/C][/ROW]
[ROW][C]64[/C][C]123.481604881894[/C][C]106.592400799191[/C][C]140.370808964597[/C][/ROW]
[ROW][C]65[/C][C]127.750982601332[/C][C]109.773464938835[/C][C]145.72850026383[/C][/ROW]
[ROW][C]66[/C][C]145.599523836032[/C][C]126.595917124052[/C][C]164.603130548012[/C][/ROW]
[ROW][C]67[/C][C]129.134555850466[/C][C]109.157494134043[/C][C]149.11161756689[/C][/ROW]
[ROW][C]68[/C][C]134.693912592836[/C][C]113.788675890517[/C][C]155.599149295156[/C][/ROW]
[ROW][C]69[/C][C]139.165123036113[/C][C]117.371205344743[/C][C]160.959040727483[/C][/ROW]
[ROW][C]70[/C][C]119.939608042943[/C][C]97.2918537371307[/C][C]142.587362348755[/C][/ROW]
[ROW][C]71[/C][C]127.865602225285[/C][C]104.395052554376[/C][C]151.336151896195[/C][/ROW]
[ROW][C]72[/C][C]142.681818181818[/C][C]118.416356541601[/C][C]166.947279822035[/C][/ROW]
[/TABLE]
Source: https://freestatistics.org/blog/index.php?pk=149758&T=3

Globally Unique Identifier (entire table): ba.freestatistics.org/blog/index.php?pk=149758&T=3

As an alternative you can also use a QR Code:  

The GUIDs for individual cells are displayed in the table below:

Extrapolation Forecasts of Exponential Smoothing
tForecast95% Lower Bound95% Upper Bound
61132.823790075753119.731523874954145.916056276552
62128.554726204793114.085677824516143.023774585069
63123.021192897114107.295440521187138.746945273041
64123.481604881894106.592400799191140.370808964597
65127.750982601332109.773464938835145.72850026383
66145.599523836032126.595917124052164.603130548012
67129.134555850466109.157494134043149.11161756689
68134.693912592836113.788675890517155.599149295156
69139.165123036113117.371205344743160.959040727483
70119.93960804294397.2918537371307142.587362348755
71127.865602225285104.395052554376151.336151896195
72142.681818181818118.416356541601166.947279822035


Parameters (Session):
par1 = 12 ; par2 = Triple ; par3 = additive ;
Parameters (R input):
par1 = 12 ; par2 = Triple ; par3 = additive ;
R code (references can be found in the software module):
par1 <- as.numeric(par1)
if (par2 == 'Single') K <- 1
if (par2 == 'Double') K <- 2
if (par2 == 'Triple') K <- par1
nx <- length(x)
nxmK <- nx - K
x <- ts(x, frequency = par1)
if (par2 == 'Single') fit <- HoltWinters(x, gamma=F, beta=F)
if (par2 == 'Double') fit <- HoltWinters(x, gamma=F)
if (par2 == 'Triple') fit <- HoltWinters(x, seasonal=par3)
fit
myresid <- x - fit$fitted[,'xhat']
bitmap(file='test1.png')
op <- par(mfrow=c(2,1))
plot(fit,ylab='Observed (black) / Fitted (red)',main='Interpolation Fit of Exponential Smoothing')
plot(myresid,ylab='Residuals',main='Interpolation Prediction Errors')
par(op)
dev.off()
bitmap(file='test2.png')
p <- predict(fit, par1, prediction.interval=TRUE)
np <- length(p[,1])
plot(fit,p,ylab='Observed (black) / Fitted (red)',main='Extrapolation Fit of Exponential Smoothing')
dev.off()
bitmap(file='test3.png')
op <- par(mfrow = c(2,2))
acf(as.numeric(myresid),lag.max = nx/2,main='Residual ACF')
spectrum(myresid,main='Residals Periodogram')
cpgram(myresid,main='Residal Cumulative Periodogram')
qqnorm(myresid,main='Residual Normal QQ Plot')
qqline(myresid)
par(op)
dev.off()
load(file='createtable')
a<-table.start()
a<-table.row.start(a)
a<-table.element(a,'Estimated Parameters of Exponential Smoothing',2,TRUE)
a<-table.row.end(a)
a<-table.row.start(a)
a<-table.element(a,'Parameter',header=TRUE)
a<-table.element(a,'Value',header=TRUE)
a<-table.row.end(a)
a<-table.row.start(a)
a<-table.element(a,'alpha',header=TRUE)
a<-table.element(a,fit$alpha)
a<-table.row.end(a)
a<-table.row.start(a)
a<-table.element(a,'beta',header=TRUE)
a<-table.element(a,fit$beta)
a<-table.row.end(a)
a<-table.row.start(a)
a<-table.element(a,'gamma',header=TRUE)
a<-table.element(a,fit$gamma)
a<-table.row.end(a)
a<-table.end(a)
table.save(a,file='mytable.tab')
a<-table.start()
a<-table.row.start(a)
a<-table.element(a,'Interpolation Forecasts of Exponential Smoothing',4,TRUE)
a<-table.row.end(a)
a<-table.row.start(a)
a<-table.element(a,'t',header=TRUE)
a<-table.element(a,'Observed',header=TRUE)
a<-table.element(a,'Fitted',header=TRUE)
a<-table.element(a,'Residuals',header=TRUE)
a<-table.row.end(a)
for (i in 1:nxmK) {
a<-table.row.start(a)
a<-table.element(a,i+K,header=TRUE)
a<-table.element(a,x[i+K])
a<-table.element(a,fit$fitted[i,'xhat'])
a<-table.element(a,myresid[i])
a<-table.row.end(a)
}
a<-table.end(a)
table.save(a,file='mytable1.tab')
a<-table.start()
a<-table.row.start(a)
a<-table.element(a,'Extrapolation Forecasts of Exponential Smoothing',4,TRUE)
a<-table.row.end(a)
a<-table.row.start(a)
a<-table.element(a,'t',header=TRUE)
a<-table.element(a,'Forecast',header=TRUE)
a<-table.element(a,'95% Lower Bound',header=TRUE)
a<-table.element(a,'95% Upper Bound',header=TRUE)
a<-table.row.end(a)
for (i in 1:np) {
a<-table.row.start(a)
a<-table.element(a,nx+i,header=TRUE)
a<-table.element(a,p[i,'fit'])
a<-table.element(a,p[i,'lwr'])
a<-table.element(a,p[i,'upr'])
a<-table.row.end(a)
}
a<-table.end(a)
table.save(a,file='mytable2.tab')