Free Statistics
of Irreproducible Research!
Description of Statistical Computation | ||||||||||||||||||||||||||||||
|---|---|---|---|---|---|---|---|---|---|---|---|---|---|---|---|---|---|---|---|---|---|---|---|---|---|---|---|---|---|---|
| Author's title | ||||||||||||||||||||||||||||||
| Author | *The author of this computation has been verified* | |||||||||||||||||||||||||||||
| R Software Module | rwasp_Distributional Plots.wasp | |||||||||||||||||||||||||||||
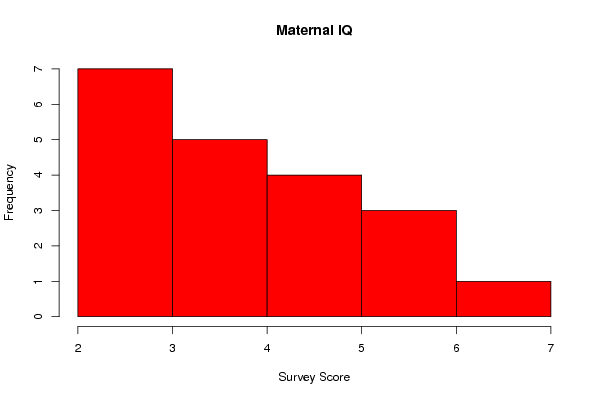
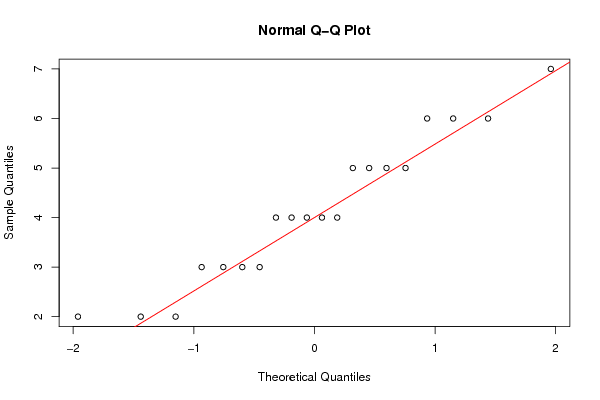
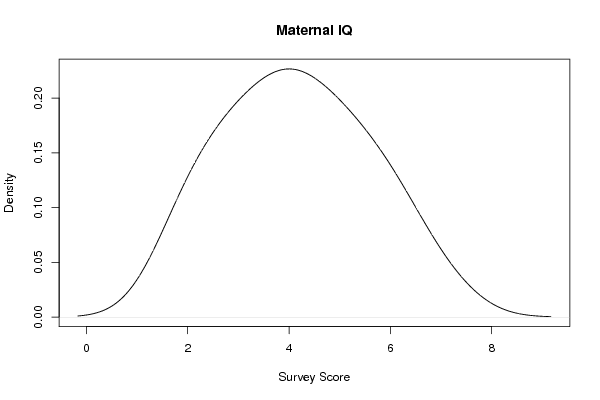
| Title produced by software | Histogram, QQplot and Density | |||||||||||||||||||||||||||||
| Date of computation | Thu, 01 Dec 2011 08:47:34 -0500 | |||||||||||||||||||||||||||||
| Cite this page as follows | Statistical Computations at FreeStatistics.org, Office for Research Development and Education, URL https://freestatistics.org/blog/index.php?v=date/2011/Dec/01/t13227472857k4k3cvj9g6vzen.htm/, Retrieved Wed, 24 Apr 2024 07:17:03 +0000 | |||||||||||||||||||||||||||||
| Statistical Computations at FreeStatistics.org, Office for Research Development and Education, URL https://freestatistics.org/blog/index.php?pk=149594, Retrieved Wed, 24 Apr 2024 07:17:03 +0000 | ||||||||||||||||||||||||||||||
| QR Codes: | ||||||||||||||||||||||||||||||
|
| ||||||||||||||||||||||||||||||
| Original text written by user: | ||||||||||||||||||||||||||||||
| IsPrivate? | No (this computation is public) | |||||||||||||||||||||||||||||
| User-defined keywords | ||||||||||||||||||||||||||||||
| Estimated Impact | 65 | |||||||||||||||||||||||||||||
Tree of Dependent Computations | ||||||||||||||||||||||||||||||
| Family? (F = Feedback message, R = changed R code, M = changed R Module, P = changed Parameters, D = changed Data) | ||||||||||||||||||||||||||||||
| - [Variability] [Two-Way ANOVA] [2010-11-30 21:42:30] [74be16979710d4c4e7c6647856088456] - RM [Two-Way ANOVA] [Two-Way ANOVA - C...] [2011-11-28 17:22:56] [98fd0e87c3eb04e0cc2efde01dbafab6] - RMPD [Histogram, QQplot and Density] [histogram smokers...] [2011-12-01 13:47:34] [59312cd388a22453680c04e4e4e3aaf4] [Current] - R [Histogram, QQplot and Density] [histogram smokers...] [2011-12-01 13:51:18] [bf1ddb3cd45fb5d723b760bc40755ff6] - D [Histogram, QQplot and Density] [Histograms smoker...] [2011-12-01 13:56:28] [bf1ddb3cd45fb5d723b760bc40755ff6] - R D [Histogram, QQplot and Density] [Non-smokers hot c...] [2011-12-01 14:05:38] [bf1ddb3cd45fb5d723b760bc40755ff6] - R D [Histogram, QQplot and Density] [non smokers mild ...] [2011-12-01 14:07:56] [bf1ddb3cd45fb5d723b760bc40755ff6] | ||||||||||||||||||||||||||||||
| Feedback Forum | ||||||||||||||||||||||||||||||
Post a new message | ||||||||||||||||||||||||||||||
Dataset | ||||||||||||||||||||||||||||||
| Dataseries X: | ||||||||||||||||||||||||||||||
4 5 3 4 5 3 7 5 6 3 2 4 5 2 3 6 4 4 6 2 | ||||||||||||||||||||||||||||||
Tables (Output of Computation) | ||||||||||||||||||||||||||||||
| ||||||||||||||||||||||||||||||
Figures (Output of Computation) | ||||||||||||||||||||||||||||||
Input Parameters & R Code | ||||||||||||||||||||||||||||||
| Parameters (Session): | ||||||||||||||||||||||||||||||
| par1 = 5 ; | ||||||||||||||||||||||||||||||
| Parameters (R input): | ||||||||||||||||||||||||||||||
| par1 = 7 ; | ||||||||||||||||||||||||||||||
| R code (references can be found in the software module): | ||||||||||||||||||||||||||||||
bitmap(file='test1.png') | ||||||||||||||||||||||||||||||