Free Statistics

of Irreproducible Research!

Author's title

Author*The author of this computation has been verified*
R Software Modulerwasp_autocorrelation.wasp
Title produced by software(Partial) Autocorrelation Function
Date of computationThu, 01 Dec 2011 08:27:55 -0500
Cite this page as followsStatistical Computations at FreeStatistics.org, Office for Research Development and Education, URL https://freestatistics.org/blog/index.php?v=date/2011/Dec/01/t1322746102jgy87ud0nsddims.htm/, Retrieved Sat, 20 Apr 2024 07:08:20 +0000
Statistical Computations at FreeStatistics.org, Office for Research Development and Education, URL https://freestatistics.org/blog/index.php?pk=149535, Retrieved Sat, 20 Apr 2024 07:08:20 +0000
QR Codes:

Original text written by user:
IsPrivate?No (this computation is public)
User-defined keywords
Estimated Impact176
Family? (F = Feedback message, R = changed R code, M = changed R Module, P = changed Parameters, D = changed Data)
-     [(Partial) Autocorrelation Function] [Workshop9: ACF] [2011-12-01 13:18:49] [09e53a95f5780167f20e6b4304200573]
- R PD  [(Partial) Autocorrelation Function] [Workshop 9: ACF d=1] [2011-12-01 13:23:51] [09e53a95f5780167f20e6b4304200573]
-   P       [(Partial) Autocorrelation Function] [Workshop 9: ACF D=1] [2011-12-01 13:27:55] [9431a512beb885c6943db1a049152d0e] [Current]
-   P         [(Partial) Autocorrelation Function] [Workshop 9: ACF d...] [2011-12-01 13:29:58] [09e53a95f5780167f20e6b4304200573]
- RMPD        [Spectral Analysis] [Workshop9: Spectr...] [2011-12-01 13:36:20] [09e53a95f5780167f20e6b4304200573]
Feedback Forum

Post a new message
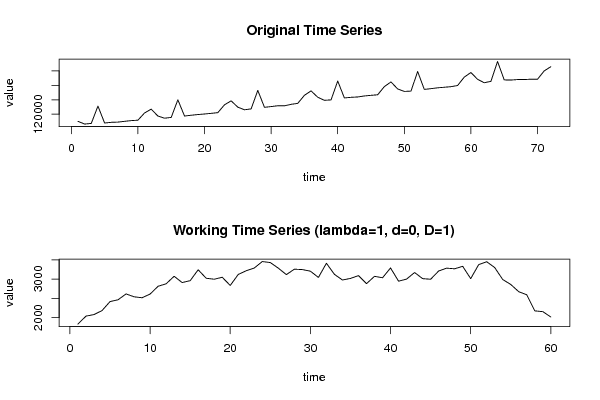
Dataseries X:
117541.78
116587
116809
122819.55
116955
117186
117265
117536
117781
117928
120437.52
121753.21
119369.88
118622
118885
124998.3
119369
119647
119879
120075
120295
120538
123250.68
124631.03
122443.31
121532
121844
128241.75
122391
122644
122927
122909
123417
123756
126540.18
128088.74
125874.28
124817
124961
131499.9
125639
125851
125970
126322
126540
126733
129557.34
131179.77
128754.8
127890
127996
134790.6
128585
128851
129142
129334
129536
129944
132842.76
134447.96
132088.81
130902
131374
138243
131885
131839
132002
132005
132127
132116
134993.94
136459.55


Summary of computational transaction
Raw Inputview raw input (R code)
Raw Outputview raw output of R engine
Computing time1 seconds
R Server'Gwilym Jenkins' @ jenkins.wessa.net

\begin{tabular}{lllllllll}
\hline
Summary of computational transaction \tabularnewline
Raw Input & view raw input (R code)  \tabularnewline
Raw Output & view raw output of R engine  \tabularnewline
Computing time & 1 seconds \tabularnewline
R Server & 'Gwilym Jenkins' @ jenkins.wessa.net \tabularnewline
\hline
\end{tabular}
%Source: https://freestatistics.org/blog/index.php?pk=149535&T=0

[TABLE]
[ROW][C]Summary of computational transaction[/C][/ROW]
[ROW][C]Raw Input[/C][C]view raw input (R code) [/C][/ROW]
[ROW][C]Raw Output[/C][C]view raw output of R engine [/C][/ROW]
[ROW][C]Computing time[/C][C]1 seconds[/C][/ROW]
[ROW][C]R Server[/C][C]'Gwilym Jenkins' @ jenkins.wessa.net[/C][/ROW]
[/TABLE]
Source: https://freestatistics.org/blog/index.php?pk=149535&T=0

Globally Unique Identifier (entire table): ba.freestatistics.org/blog/index.php?pk=149535&T=0

As an alternative you can also use a QR Code:  

The GUIDs for individual cells are displayed in the table below:

Summary of computational transaction
Raw Inputview raw input (R code)
Raw Outputview raw output of R engine
Computing time1 seconds
R Server'Gwilym Jenkins' @ jenkins.wessa.net


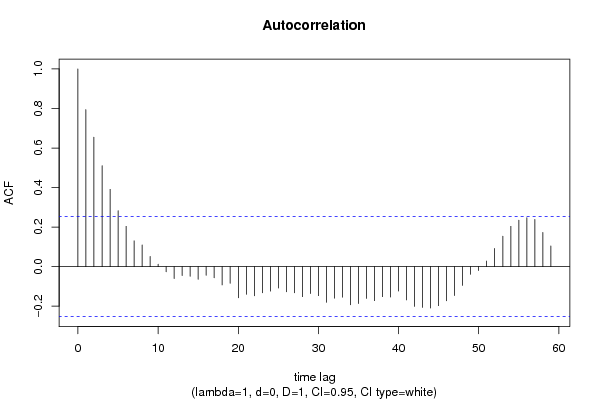
Autocorrelation Function
Time lag kACF(k)T-STATP-value
10.7940996.15110
20.6544715.06952e-06
30.5102423.95230.000103
40.3908343.02740.001816
50.2823312.18690.016329
60.2036891.57780.059939
70.1305231.0110.158032
80.1097350.850.19935
90.0516210.39990.345342
100.0121850.09440.462559
11-0.026217-0.20310.419882
12-0.060514-0.46870.320476
13-0.044688-0.34620.365219
14-0.048869-0.37850.353185
15-0.0643-0.49810.310129
16-0.044031-0.34110.367124
17-0.056336-0.43640.332065
18-0.092352-0.71540.238581
19-0.083733-0.64860.259538
20-0.157741-1.22190.11327
21-0.140014-1.08450.141232
22-0.147407-1.14180.129035
23-0.13215-1.02360.15506
24-0.123796-0.95890.170723
25-0.108274-0.83870.202487
26-0.127515-0.98770.163627
27-0.132117-1.02340.155119
28-0.151747-1.17540.122234
29-0.135998-1.05340.148183
30-0.146622-1.13570.130292
31-0.180371-1.39710.083758
32-0.159557-1.23590.110652
33-0.15433-1.19540.11831
34-0.193255-1.49690.069824
35-0.186436-1.44410.076952
36-0.160616-1.24410.109146
37-0.172065-1.33280.093816
38-0.151652-1.17470.12238
39-0.153871-1.19190.119001
40-0.123183-0.95420.171914
41-0.168191-1.30280.09881
42-0.200895-1.55610.062469
43-0.20597-1.59540.057934
44-0.209003-1.61890.055354
45-0.197414-1.52920.06574
46-0.172915-1.33940.092747
47-0.146262-1.13290.130874
48-0.094927-0.73530.23251
49-0.038897-0.30130.382117
50-0.019645-0.15220.439781
510.0278950.21610.414833
520.091980.71250.239466
530.153591.18970.119425
540.2037191.5780.059912
550.2347721.81850.036987
560.2469261.91270.030283
570.2381841.8450.03499
580.1728441.33880.092836
590.1042360.80740.211309
60NANANA

\begin{tabular}{lllllllll}
\hline
Autocorrelation Function \tabularnewline
Time lag k & ACF(k) & T-STAT & P-value \tabularnewline
1 & 0.794099 & 6.1511 & 0 \tabularnewline
2 & 0.654471 & 5.0695 & 2e-06 \tabularnewline
3 & 0.510242 & 3.9523 & 0.000103 \tabularnewline
4 & 0.390834 & 3.0274 & 0.001816 \tabularnewline
5 & 0.282331 & 2.1869 & 0.016329 \tabularnewline
6 & 0.203689 & 1.5778 & 0.059939 \tabularnewline
7 & 0.130523 & 1.011 & 0.158032 \tabularnewline
8 & 0.109735 & 0.85 & 0.19935 \tabularnewline
9 & 0.051621 & 0.3999 & 0.345342 \tabularnewline
10 & 0.012185 & 0.0944 & 0.462559 \tabularnewline
11 & -0.026217 & -0.2031 & 0.419882 \tabularnewline
12 & -0.060514 & -0.4687 & 0.320476 \tabularnewline
13 & -0.044688 & -0.3462 & 0.365219 \tabularnewline
14 & -0.048869 & -0.3785 & 0.353185 \tabularnewline
15 & -0.0643 & -0.4981 & 0.310129 \tabularnewline
16 & -0.044031 & -0.3411 & 0.367124 \tabularnewline
17 & -0.056336 & -0.4364 & 0.332065 \tabularnewline
18 & -0.092352 & -0.7154 & 0.238581 \tabularnewline
19 & -0.083733 & -0.6486 & 0.259538 \tabularnewline
20 & -0.157741 & -1.2219 & 0.11327 \tabularnewline
21 & -0.140014 & -1.0845 & 0.141232 \tabularnewline
22 & -0.147407 & -1.1418 & 0.129035 \tabularnewline
23 & -0.13215 & -1.0236 & 0.15506 \tabularnewline
24 & -0.123796 & -0.9589 & 0.170723 \tabularnewline
25 & -0.108274 & -0.8387 & 0.202487 \tabularnewline
26 & -0.127515 & -0.9877 & 0.163627 \tabularnewline
27 & -0.132117 & -1.0234 & 0.155119 \tabularnewline
28 & -0.151747 & -1.1754 & 0.122234 \tabularnewline
29 & -0.135998 & -1.0534 & 0.148183 \tabularnewline
30 & -0.146622 & -1.1357 & 0.130292 \tabularnewline
31 & -0.180371 & -1.3971 & 0.083758 \tabularnewline
32 & -0.159557 & -1.2359 & 0.110652 \tabularnewline
33 & -0.15433 & -1.1954 & 0.11831 \tabularnewline
34 & -0.193255 & -1.4969 & 0.069824 \tabularnewline
35 & -0.186436 & -1.4441 & 0.076952 \tabularnewline
36 & -0.160616 & -1.2441 & 0.109146 \tabularnewline
37 & -0.172065 & -1.3328 & 0.093816 \tabularnewline
38 & -0.151652 & -1.1747 & 0.12238 \tabularnewline
39 & -0.153871 & -1.1919 & 0.119001 \tabularnewline
40 & -0.123183 & -0.9542 & 0.171914 \tabularnewline
41 & -0.168191 & -1.3028 & 0.09881 \tabularnewline
42 & -0.200895 & -1.5561 & 0.062469 \tabularnewline
43 & -0.20597 & -1.5954 & 0.057934 \tabularnewline
44 & -0.209003 & -1.6189 & 0.055354 \tabularnewline
45 & -0.197414 & -1.5292 & 0.06574 \tabularnewline
46 & -0.172915 & -1.3394 & 0.092747 \tabularnewline
47 & -0.146262 & -1.1329 & 0.130874 \tabularnewline
48 & -0.094927 & -0.7353 & 0.23251 \tabularnewline
49 & -0.038897 & -0.3013 & 0.382117 \tabularnewline
50 & -0.019645 & -0.1522 & 0.439781 \tabularnewline
51 & 0.027895 & 0.2161 & 0.414833 \tabularnewline
52 & 0.09198 & 0.7125 & 0.239466 \tabularnewline
53 & 0.15359 & 1.1897 & 0.119425 \tabularnewline
54 & 0.203719 & 1.578 & 0.059912 \tabularnewline
55 & 0.234772 & 1.8185 & 0.036987 \tabularnewline
56 & 0.246926 & 1.9127 & 0.030283 \tabularnewline
57 & 0.238184 & 1.845 & 0.03499 \tabularnewline
58 & 0.172844 & 1.3388 & 0.092836 \tabularnewline
59 & 0.104236 & 0.8074 & 0.211309 \tabularnewline
60 & NA & NA & NA \tabularnewline
\hline
\end{tabular}
%Source: https://freestatistics.org/blog/index.php?pk=149535&T=1

[TABLE]
[ROW][C]Autocorrelation Function[/C][/ROW]
[ROW][C]Time lag k[/C][C]ACF(k)[/C][C]T-STAT[/C][C]P-value[/C][/ROW]
[ROW][C]1[/C][C]0.794099[/C][C]6.1511[/C][C]0[/C][/ROW]
[ROW][C]2[/C][C]0.654471[/C][C]5.0695[/C][C]2e-06[/C][/ROW]
[ROW][C]3[/C][C]0.510242[/C][C]3.9523[/C][C]0.000103[/C][/ROW]
[ROW][C]4[/C][C]0.390834[/C][C]3.0274[/C][C]0.001816[/C][/ROW]
[ROW][C]5[/C][C]0.282331[/C][C]2.1869[/C][C]0.016329[/C][/ROW]
[ROW][C]6[/C][C]0.203689[/C][C]1.5778[/C][C]0.059939[/C][/ROW]
[ROW][C]7[/C][C]0.130523[/C][C]1.011[/C][C]0.158032[/C][/ROW]
[ROW][C]8[/C][C]0.109735[/C][C]0.85[/C][C]0.19935[/C][/ROW]
[ROW][C]9[/C][C]0.051621[/C][C]0.3999[/C][C]0.345342[/C][/ROW]
[ROW][C]10[/C][C]0.012185[/C][C]0.0944[/C][C]0.462559[/C][/ROW]
[ROW][C]11[/C][C]-0.026217[/C][C]-0.2031[/C][C]0.419882[/C][/ROW]
[ROW][C]12[/C][C]-0.060514[/C][C]-0.4687[/C][C]0.320476[/C][/ROW]
[ROW][C]13[/C][C]-0.044688[/C][C]-0.3462[/C][C]0.365219[/C][/ROW]
[ROW][C]14[/C][C]-0.048869[/C][C]-0.3785[/C][C]0.353185[/C][/ROW]
[ROW][C]15[/C][C]-0.0643[/C][C]-0.4981[/C][C]0.310129[/C][/ROW]
[ROW][C]16[/C][C]-0.044031[/C][C]-0.3411[/C][C]0.367124[/C][/ROW]
[ROW][C]17[/C][C]-0.056336[/C][C]-0.4364[/C][C]0.332065[/C][/ROW]
[ROW][C]18[/C][C]-0.092352[/C][C]-0.7154[/C][C]0.238581[/C][/ROW]
[ROW][C]19[/C][C]-0.083733[/C][C]-0.6486[/C][C]0.259538[/C][/ROW]
[ROW][C]20[/C][C]-0.157741[/C][C]-1.2219[/C][C]0.11327[/C][/ROW]
[ROW][C]21[/C][C]-0.140014[/C][C]-1.0845[/C][C]0.141232[/C][/ROW]
[ROW][C]22[/C][C]-0.147407[/C][C]-1.1418[/C][C]0.129035[/C][/ROW]
[ROW][C]23[/C][C]-0.13215[/C][C]-1.0236[/C][C]0.15506[/C][/ROW]
[ROW][C]24[/C][C]-0.123796[/C][C]-0.9589[/C][C]0.170723[/C][/ROW]
[ROW][C]25[/C][C]-0.108274[/C][C]-0.8387[/C][C]0.202487[/C][/ROW]
[ROW][C]26[/C][C]-0.127515[/C][C]-0.9877[/C][C]0.163627[/C][/ROW]
[ROW][C]27[/C][C]-0.132117[/C][C]-1.0234[/C][C]0.155119[/C][/ROW]
[ROW][C]28[/C][C]-0.151747[/C][C]-1.1754[/C][C]0.122234[/C][/ROW]
[ROW][C]29[/C][C]-0.135998[/C][C]-1.0534[/C][C]0.148183[/C][/ROW]
[ROW][C]30[/C][C]-0.146622[/C][C]-1.1357[/C][C]0.130292[/C][/ROW]
[ROW][C]31[/C][C]-0.180371[/C][C]-1.3971[/C][C]0.083758[/C][/ROW]
[ROW][C]32[/C][C]-0.159557[/C][C]-1.2359[/C][C]0.110652[/C][/ROW]
[ROW][C]33[/C][C]-0.15433[/C][C]-1.1954[/C][C]0.11831[/C][/ROW]
[ROW][C]34[/C][C]-0.193255[/C][C]-1.4969[/C][C]0.069824[/C][/ROW]
[ROW][C]35[/C][C]-0.186436[/C][C]-1.4441[/C][C]0.076952[/C][/ROW]
[ROW][C]36[/C][C]-0.160616[/C][C]-1.2441[/C][C]0.109146[/C][/ROW]
[ROW][C]37[/C][C]-0.172065[/C][C]-1.3328[/C][C]0.093816[/C][/ROW]
[ROW][C]38[/C][C]-0.151652[/C][C]-1.1747[/C][C]0.12238[/C][/ROW]
[ROW][C]39[/C][C]-0.153871[/C][C]-1.1919[/C][C]0.119001[/C][/ROW]
[ROW][C]40[/C][C]-0.123183[/C][C]-0.9542[/C][C]0.171914[/C][/ROW]
[ROW][C]41[/C][C]-0.168191[/C][C]-1.3028[/C][C]0.09881[/C][/ROW]
[ROW][C]42[/C][C]-0.200895[/C][C]-1.5561[/C][C]0.062469[/C][/ROW]
[ROW][C]43[/C][C]-0.20597[/C][C]-1.5954[/C][C]0.057934[/C][/ROW]
[ROW][C]44[/C][C]-0.209003[/C][C]-1.6189[/C][C]0.055354[/C][/ROW]
[ROW][C]45[/C][C]-0.197414[/C][C]-1.5292[/C][C]0.06574[/C][/ROW]
[ROW][C]46[/C][C]-0.172915[/C][C]-1.3394[/C][C]0.092747[/C][/ROW]
[ROW][C]47[/C][C]-0.146262[/C][C]-1.1329[/C][C]0.130874[/C][/ROW]
[ROW][C]48[/C][C]-0.094927[/C][C]-0.7353[/C][C]0.23251[/C][/ROW]
[ROW][C]49[/C][C]-0.038897[/C][C]-0.3013[/C][C]0.382117[/C][/ROW]
[ROW][C]50[/C][C]-0.019645[/C][C]-0.1522[/C][C]0.439781[/C][/ROW]
[ROW][C]51[/C][C]0.027895[/C][C]0.2161[/C][C]0.414833[/C][/ROW]
[ROW][C]52[/C][C]0.09198[/C][C]0.7125[/C][C]0.239466[/C][/ROW]
[ROW][C]53[/C][C]0.15359[/C][C]1.1897[/C][C]0.119425[/C][/ROW]
[ROW][C]54[/C][C]0.203719[/C][C]1.578[/C][C]0.059912[/C][/ROW]
[ROW][C]55[/C][C]0.234772[/C][C]1.8185[/C][C]0.036987[/C][/ROW]
[ROW][C]56[/C][C]0.246926[/C][C]1.9127[/C][C]0.030283[/C][/ROW]
[ROW][C]57[/C][C]0.238184[/C][C]1.845[/C][C]0.03499[/C][/ROW]
[ROW][C]58[/C][C]0.172844[/C][C]1.3388[/C][C]0.092836[/C][/ROW]
[ROW][C]59[/C][C]0.104236[/C][C]0.8074[/C][C]0.211309[/C][/ROW]
[ROW][C]60[/C][C]NA[/C][C]NA[/C][C]NA[/C][/ROW]
[/TABLE]
Source: https://freestatistics.org/blog/index.php?pk=149535&T=1

Globally Unique Identifier (entire table): ba.freestatistics.org/blog/index.php?pk=149535&T=1

As an alternative you can also use a QR Code:  

The GUIDs for individual cells are displayed in the table below:

Autocorrelation Function
Time lag kACF(k)T-STATP-value
10.7940996.15110
20.6544715.06952e-06
30.5102423.95230.000103
40.3908343.02740.001816
50.2823312.18690.016329
60.2036891.57780.059939
70.1305231.0110.158032
80.1097350.850.19935
90.0516210.39990.345342
100.0121850.09440.462559
11-0.026217-0.20310.419882
12-0.060514-0.46870.320476
13-0.044688-0.34620.365219
14-0.048869-0.37850.353185
15-0.0643-0.49810.310129
16-0.044031-0.34110.367124
17-0.056336-0.43640.332065
18-0.092352-0.71540.238581
19-0.083733-0.64860.259538
20-0.157741-1.22190.11327
21-0.140014-1.08450.141232
22-0.147407-1.14180.129035
23-0.13215-1.02360.15506
24-0.123796-0.95890.170723
25-0.108274-0.83870.202487
26-0.127515-0.98770.163627
27-0.132117-1.02340.155119
28-0.151747-1.17540.122234
29-0.135998-1.05340.148183
30-0.146622-1.13570.130292
31-0.180371-1.39710.083758
32-0.159557-1.23590.110652
33-0.15433-1.19540.11831
34-0.193255-1.49690.069824
35-0.186436-1.44410.076952
36-0.160616-1.24410.109146
37-0.172065-1.33280.093816
38-0.151652-1.17470.12238
39-0.153871-1.19190.119001
40-0.123183-0.95420.171914
41-0.168191-1.30280.09881
42-0.200895-1.55610.062469
43-0.20597-1.59540.057934
44-0.209003-1.61890.055354
45-0.197414-1.52920.06574
46-0.172915-1.33940.092747
47-0.146262-1.13290.130874
48-0.094927-0.73530.23251
49-0.038897-0.30130.382117
50-0.019645-0.15220.439781
510.0278950.21610.414833
520.091980.71250.239466
530.153591.18970.119425
540.2037191.5780.059912
550.2347721.81850.036987
560.2469261.91270.030283
570.2381841.8450.03499
580.1728441.33880.092836
590.1042360.80740.211309
60NANANA


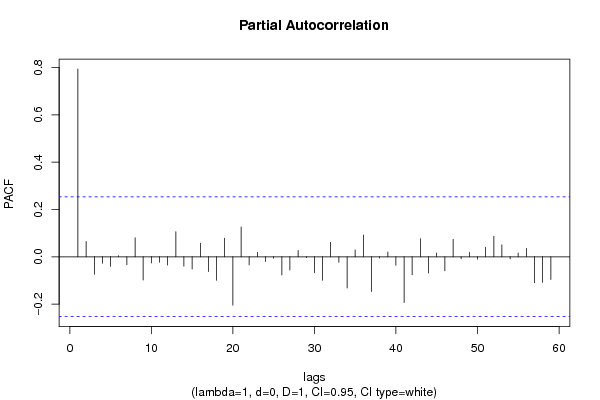
Partial Autocorrelation Function
Time lag kPACF(k)T-STATP-value
10.7940996.15110
20.064640.50070.309209
3-0.073963-0.57290.28442
4-0.02767-0.21430.415507
5-0.040747-0.31560.376691
60.0042860.03320.486813
7-0.033405-0.25880.398355
80.0805810.62420.267438
9-0.097808-0.75760.225823
10-0.02585-0.20020.420987
11-0.022938-0.17770.429789
12-0.034713-0.26890.39447
130.106140.82220.207121
14-0.039409-0.30530.380612
15-0.05163-0.39990.345316
160.057060.4420.330045
17-0.061993-0.48020.316418
18-0.099427-0.77020.222115
190.0784890.6080.27275
20-0.204255-1.58220.059436
210.1262820.97820.165958
22-0.034211-0.2650.39596
230.0189280.14660.441964
24-0.019796-0.15330.439324
25-0.005848-0.04530.48201
26-0.076856-0.59530.276932
27-0.055734-0.43170.333749
280.0268340.20790.418024
29-0.003642-0.02820.488794
30-0.06727-0.52110.302118
31-0.099396-0.76990.222184
320.0609520.47210.319272
33-0.023385-0.18110.428433
34-0.132108-1.02330.155136
350.0286420.22190.412588
360.0923890.71560.238494
37-0.146435-1.13430.130594
38-0.005468-0.04240.483178
390.020540.15910.437061
40-0.035526-0.27520.392061
41-0.193548-1.49920.069531
42-0.075681-0.58620.279963
430.0766330.59360.277506
44-0.068677-0.5320.298357
450.0157370.12190.451693
46-0.059139-0.45810.324271
470.0738130.57180.284813
48-0.008314-0.06440.474433
490.0178830.13850.445145
50-0.00983-0.07610.469779
510.0401950.31130.378308
520.0866230.6710.252405
530.0503480.390.34896
54-0.007963-0.06170.475511
550.0163080.12630.449951
560.0349880.2710.393654
57-0.109931-0.85150.198932
58-0.10802-0.83670.203036
59-0.095525-0.73990.231113
60NANANA

\begin{tabular}{lllllllll}
\hline
Partial Autocorrelation Function \tabularnewline
Time lag k & PACF(k) & T-STAT & P-value \tabularnewline
1 & 0.794099 & 6.1511 & 0 \tabularnewline
2 & 0.06464 & 0.5007 & 0.309209 \tabularnewline
3 & -0.073963 & -0.5729 & 0.28442 \tabularnewline
4 & -0.02767 & -0.2143 & 0.415507 \tabularnewline
5 & -0.040747 & -0.3156 & 0.376691 \tabularnewline
6 & 0.004286 & 0.0332 & 0.486813 \tabularnewline
7 & -0.033405 & -0.2588 & 0.398355 \tabularnewline
8 & 0.080581 & 0.6242 & 0.267438 \tabularnewline
9 & -0.097808 & -0.7576 & 0.225823 \tabularnewline
10 & -0.02585 & -0.2002 & 0.420987 \tabularnewline
11 & -0.022938 & -0.1777 & 0.429789 \tabularnewline
12 & -0.034713 & -0.2689 & 0.39447 \tabularnewline
13 & 0.10614 & 0.8222 & 0.207121 \tabularnewline
14 & -0.039409 & -0.3053 & 0.380612 \tabularnewline
15 & -0.05163 & -0.3999 & 0.345316 \tabularnewline
16 & 0.05706 & 0.442 & 0.330045 \tabularnewline
17 & -0.061993 & -0.4802 & 0.316418 \tabularnewline
18 & -0.099427 & -0.7702 & 0.222115 \tabularnewline
19 & 0.078489 & 0.608 & 0.27275 \tabularnewline
20 & -0.204255 & -1.5822 & 0.059436 \tabularnewline
21 & 0.126282 & 0.9782 & 0.165958 \tabularnewline
22 & -0.034211 & -0.265 & 0.39596 \tabularnewline
23 & 0.018928 & 0.1466 & 0.441964 \tabularnewline
24 & -0.019796 & -0.1533 & 0.439324 \tabularnewline
25 & -0.005848 & -0.0453 & 0.48201 \tabularnewline
26 & -0.076856 & -0.5953 & 0.276932 \tabularnewline
27 & -0.055734 & -0.4317 & 0.333749 \tabularnewline
28 & 0.026834 & 0.2079 & 0.418024 \tabularnewline
29 & -0.003642 & -0.0282 & 0.488794 \tabularnewline
30 & -0.06727 & -0.5211 & 0.302118 \tabularnewline
31 & -0.099396 & -0.7699 & 0.222184 \tabularnewline
32 & 0.060952 & 0.4721 & 0.319272 \tabularnewline
33 & -0.023385 & -0.1811 & 0.428433 \tabularnewline
34 & -0.132108 & -1.0233 & 0.155136 \tabularnewline
35 & 0.028642 & 0.2219 & 0.412588 \tabularnewline
36 & 0.092389 & 0.7156 & 0.238494 \tabularnewline
37 & -0.146435 & -1.1343 & 0.130594 \tabularnewline
38 & -0.005468 & -0.0424 & 0.483178 \tabularnewline
39 & 0.02054 & 0.1591 & 0.437061 \tabularnewline
40 & -0.035526 & -0.2752 & 0.392061 \tabularnewline
41 & -0.193548 & -1.4992 & 0.069531 \tabularnewline
42 & -0.075681 & -0.5862 & 0.279963 \tabularnewline
43 & 0.076633 & 0.5936 & 0.277506 \tabularnewline
44 & -0.068677 & -0.532 & 0.298357 \tabularnewline
45 & 0.015737 & 0.1219 & 0.451693 \tabularnewline
46 & -0.059139 & -0.4581 & 0.324271 \tabularnewline
47 & 0.073813 & 0.5718 & 0.284813 \tabularnewline
48 & -0.008314 & -0.0644 & 0.474433 \tabularnewline
49 & 0.017883 & 0.1385 & 0.445145 \tabularnewline
50 & -0.00983 & -0.0761 & 0.469779 \tabularnewline
51 & 0.040195 & 0.3113 & 0.378308 \tabularnewline
52 & 0.086623 & 0.671 & 0.252405 \tabularnewline
53 & 0.050348 & 0.39 & 0.34896 \tabularnewline
54 & -0.007963 & -0.0617 & 0.475511 \tabularnewline
55 & 0.016308 & 0.1263 & 0.449951 \tabularnewline
56 & 0.034988 & 0.271 & 0.393654 \tabularnewline
57 & -0.109931 & -0.8515 & 0.198932 \tabularnewline
58 & -0.10802 & -0.8367 & 0.203036 \tabularnewline
59 & -0.095525 & -0.7399 & 0.231113 \tabularnewline
60 & NA & NA & NA \tabularnewline
\hline
\end{tabular}
%Source: https://freestatistics.org/blog/index.php?pk=149535&T=2

[TABLE]
[ROW][C]Partial Autocorrelation Function[/C][/ROW]
[ROW][C]Time lag k[/C][C]PACF(k)[/C][C]T-STAT[/C][C]P-value[/C][/ROW]
[ROW][C]1[/C][C]0.794099[/C][C]6.1511[/C][C]0[/C][/ROW]
[ROW][C]2[/C][C]0.06464[/C][C]0.5007[/C][C]0.309209[/C][/ROW]
[ROW][C]3[/C][C]-0.073963[/C][C]-0.5729[/C][C]0.28442[/C][/ROW]
[ROW][C]4[/C][C]-0.02767[/C][C]-0.2143[/C][C]0.415507[/C][/ROW]
[ROW][C]5[/C][C]-0.040747[/C][C]-0.3156[/C][C]0.376691[/C][/ROW]
[ROW][C]6[/C][C]0.004286[/C][C]0.0332[/C][C]0.486813[/C][/ROW]
[ROW][C]7[/C][C]-0.033405[/C][C]-0.2588[/C][C]0.398355[/C][/ROW]
[ROW][C]8[/C][C]0.080581[/C][C]0.6242[/C][C]0.267438[/C][/ROW]
[ROW][C]9[/C][C]-0.097808[/C][C]-0.7576[/C][C]0.225823[/C][/ROW]
[ROW][C]10[/C][C]-0.02585[/C][C]-0.2002[/C][C]0.420987[/C][/ROW]
[ROW][C]11[/C][C]-0.022938[/C][C]-0.1777[/C][C]0.429789[/C][/ROW]
[ROW][C]12[/C][C]-0.034713[/C][C]-0.2689[/C][C]0.39447[/C][/ROW]
[ROW][C]13[/C][C]0.10614[/C][C]0.8222[/C][C]0.207121[/C][/ROW]
[ROW][C]14[/C][C]-0.039409[/C][C]-0.3053[/C][C]0.380612[/C][/ROW]
[ROW][C]15[/C][C]-0.05163[/C][C]-0.3999[/C][C]0.345316[/C][/ROW]
[ROW][C]16[/C][C]0.05706[/C][C]0.442[/C][C]0.330045[/C][/ROW]
[ROW][C]17[/C][C]-0.061993[/C][C]-0.4802[/C][C]0.316418[/C][/ROW]
[ROW][C]18[/C][C]-0.099427[/C][C]-0.7702[/C][C]0.222115[/C][/ROW]
[ROW][C]19[/C][C]0.078489[/C][C]0.608[/C][C]0.27275[/C][/ROW]
[ROW][C]20[/C][C]-0.204255[/C][C]-1.5822[/C][C]0.059436[/C][/ROW]
[ROW][C]21[/C][C]0.126282[/C][C]0.9782[/C][C]0.165958[/C][/ROW]
[ROW][C]22[/C][C]-0.034211[/C][C]-0.265[/C][C]0.39596[/C][/ROW]
[ROW][C]23[/C][C]0.018928[/C][C]0.1466[/C][C]0.441964[/C][/ROW]
[ROW][C]24[/C][C]-0.019796[/C][C]-0.1533[/C][C]0.439324[/C][/ROW]
[ROW][C]25[/C][C]-0.005848[/C][C]-0.0453[/C][C]0.48201[/C][/ROW]
[ROW][C]26[/C][C]-0.076856[/C][C]-0.5953[/C][C]0.276932[/C][/ROW]
[ROW][C]27[/C][C]-0.055734[/C][C]-0.4317[/C][C]0.333749[/C][/ROW]
[ROW][C]28[/C][C]0.026834[/C][C]0.2079[/C][C]0.418024[/C][/ROW]
[ROW][C]29[/C][C]-0.003642[/C][C]-0.0282[/C][C]0.488794[/C][/ROW]
[ROW][C]30[/C][C]-0.06727[/C][C]-0.5211[/C][C]0.302118[/C][/ROW]
[ROW][C]31[/C][C]-0.099396[/C][C]-0.7699[/C][C]0.222184[/C][/ROW]
[ROW][C]32[/C][C]0.060952[/C][C]0.4721[/C][C]0.319272[/C][/ROW]
[ROW][C]33[/C][C]-0.023385[/C][C]-0.1811[/C][C]0.428433[/C][/ROW]
[ROW][C]34[/C][C]-0.132108[/C][C]-1.0233[/C][C]0.155136[/C][/ROW]
[ROW][C]35[/C][C]0.028642[/C][C]0.2219[/C][C]0.412588[/C][/ROW]
[ROW][C]36[/C][C]0.092389[/C][C]0.7156[/C][C]0.238494[/C][/ROW]
[ROW][C]37[/C][C]-0.146435[/C][C]-1.1343[/C][C]0.130594[/C][/ROW]
[ROW][C]38[/C][C]-0.005468[/C][C]-0.0424[/C][C]0.483178[/C][/ROW]
[ROW][C]39[/C][C]0.02054[/C][C]0.1591[/C][C]0.437061[/C][/ROW]
[ROW][C]40[/C][C]-0.035526[/C][C]-0.2752[/C][C]0.392061[/C][/ROW]
[ROW][C]41[/C][C]-0.193548[/C][C]-1.4992[/C][C]0.069531[/C][/ROW]
[ROW][C]42[/C][C]-0.075681[/C][C]-0.5862[/C][C]0.279963[/C][/ROW]
[ROW][C]43[/C][C]0.076633[/C][C]0.5936[/C][C]0.277506[/C][/ROW]
[ROW][C]44[/C][C]-0.068677[/C][C]-0.532[/C][C]0.298357[/C][/ROW]
[ROW][C]45[/C][C]0.015737[/C][C]0.1219[/C][C]0.451693[/C][/ROW]
[ROW][C]46[/C][C]-0.059139[/C][C]-0.4581[/C][C]0.324271[/C][/ROW]
[ROW][C]47[/C][C]0.073813[/C][C]0.5718[/C][C]0.284813[/C][/ROW]
[ROW][C]48[/C][C]-0.008314[/C][C]-0.0644[/C][C]0.474433[/C][/ROW]
[ROW][C]49[/C][C]0.017883[/C][C]0.1385[/C][C]0.445145[/C][/ROW]
[ROW][C]50[/C][C]-0.00983[/C][C]-0.0761[/C][C]0.469779[/C][/ROW]
[ROW][C]51[/C][C]0.040195[/C][C]0.3113[/C][C]0.378308[/C][/ROW]
[ROW][C]52[/C][C]0.086623[/C][C]0.671[/C][C]0.252405[/C][/ROW]
[ROW][C]53[/C][C]0.050348[/C][C]0.39[/C][C]0.34896[/C][/ROW]
[ROW][C]54[/C][C]-0.007963[/C][C]-0.0617[/C][C]0.475511[/C][/ROW]
[ROW][C]55[/C][C]0.016308[/C][C]0.1263[/C][C]0.449951[/C][/ROW]
[ROW][C]56[/C][C]0.034988[/C][C]0.271[/C][C]0.393654[/C][/ROW]
[ROW][C]57[/C][C]-0.109931[/C][C]-0.8515[/C][C]0.198932[/C][/ROW]
[ROW][C]58[/C][C]-0.10802[/C][C]-0.8367[/C][C]0.203036[/C][/ROW]
[ROW][C]59[/C][C]-0.095525[/C][C]-0.7399[/C][C]0.231113[/C][/ROW]
[ROW][C]60[/C][C]NA[/C][C]NA[/C][C]NA[/C][/ROW]
[/TABLE]
Source: https://freestatistics.org/blog/index.php?pk=149535&T=2

Globally Unique Identifier (entire table): ba.freestatistics.org/blog/index.php?pk=149535&T=2

As an alternative you can also use a QR Code:  

The GUIDs for individual cells are displayed in the table below:

Partial Autocorrelation Function
Time lag kPACF(k)T-STATP-value
10.7940996.15110
20.064640.50070.309209
3-0.073963-0.57290.28442
4-0.02767-0.21430.415507
5-0.040747-0.31560.376691
60.0042860.03320.486813
7-0.033405-0.25880.398355
80.0805810.62420.267438
9-0.097808-0.75760.225823
10-0.02585-0.20020.420987
11-0.022938-0.17770.429789
12-0.034713-0.26890.39447
130.106140.82220.207121
14-0.039409-0.30530.380612
15-0.05163-0.39990.345316
160.057060.4420.330045
17-0.061993-0.48020.316418
18-0.099427-0.77020.222115
190.0784890.6080.27275
20-0.204255-1.58220.059436
210.1262820.97820.165958
22-0.034211-0.2650.39596
230.0189280.14660.441964
24-0.019796-0.15330.439324
25-0.005848-0.04530.48201
26-0.076856-0.59530.276932
27-0.055734-0.43170.333749
280.0268340.20790.418024
29-0.003642-0.02820.488794
30-0.06727-0.52110.302118
31-0.099396-0.76990.222184
320.0609520.47210.319272
33-0.023385-0.18110.428433
34-0.132108-1.02330.155136
350.0286420.22190.412588
360.0923890.71560.238494
37-0.146435-1.13430.130594
38-0.005468-0.04240.483178
390.020540.15910.437061
40-0.035526-0.27520.392061
41-0.193548-1.49920.069531
42-0.075681-0.58620.279963
430.0766330.59360.277506
44-0.068677-0.5320.298357
450.0157370.12190.451693
46-0.059139-0.45810.324271
470.0738130.57180.284813
48-0.008314-0.06440.474433
490.0178830.13850.445145
50-0.00983-0.07610.469779
510.0401950.31130.378308
520.0866230.6710.252405
530.0503480.390.34896
54-0.007963-0.06170.475511
550.0163080.12630.449951
560.0349880.2710.393654
57-0.109931-0.85150.198932
58-0.10802-0.83670.203036
59-0.095525-0.73990.231113
60NANANA


Parameters (Session):
par1 = 60 ; par2 = 1 ; par3 = 0 ; par4 = 1 ; par5 = 12 ; par6 = White Noise ; par7 = 0.95 ;
Parameters (R input):
par1 = 60 ; par2 = 1 ; par3 = 0 ; par4 = 1 ; par5 = 12 ; par6 = White Noise ; par7 = 0.95 ; par8 = ;
R code (references can be found in the software module):
if (par1 == 'Default') {
par1 = 10*log10(length(x))
} else {
par1 <- as.numeric(par1)
}
par2 <- as.numeric(par2)
par3 <- as.numeric(par3)
par4 <- as.numeric(par4)
par5 <- as.numeric(par5)
if (par6 == 'White Noise') par6 <- 'white' else par6 <- 'ma'
par7 <- as.numeric(par7)
if (par8 != '') par8 <- as.numeric(par8)
ox <- x
if (par8 == '') {
if (par2 == 0) {
x <- log(x)
} else {
x <- (x ^ par2 - 1) / par2
}
} else {
x <- log(x,base=par8)
}
if (par3 > 0) x <- diff(x,lag=1,difference=par3)
if (par4 > 0) x <- diff(x,lag=par5,difference=par4)
bitmap(file='picts.png')
op <- par(mfrow=c(2,1))
plot(ox,type='l',main='Original Time Series',xlab='time',ylab='value')
if (par8=='') {
mytitle <- paste('Working Time Series (lambda=',par2,', d=',par3,', D=',par4,')',sep='')
mysub <- paste('(lambda=',par2,', d=',par3,', D=',par4,', CI=', par7, ', CI type=',par6,')',sep='')
} else {
mytitle <- paste('Working Time Series (base=',par8,', d=',par3,', D=',par4,')',sep='')
mysub <- paste('(base=',par8,', d=',par3,', D=',par4,', CI=', par7, ', CI type=',par6,')',sep='')
}
plot(x,type='l', main=mytitle,xlab='time',ylab='value')
par(op)
dev.off()
bitmap(file='pic1.png')
racf <- acf(x, par1, main='Autocorrelation', xlab='time lag', ylab='ACF', ci.type=par6, ci=par7, sub=mysub)
dev.off()
bitmap(file='pic2.png')
rpacf <- pacf(x,par1,main='Partial Autocorrelation',xlab='lags',ylab='PACF',sub=mysub)
dev.off()
(myacf <- c(racf$acf))
(mypacf <- c(rpacf$acf))
lengthx <- length(x)
sqrtn <- sqrt(lengthx)
load(file='createtable')
a<-table.start()
a<-table.row.start(a)
a<-table.element(a,'Autocorrelation Function',4,TRUE)
a<-table.row.end(a)
a<-table.row.start(a)
a<-table.element(a,'Time lag k',header=TRUE)
a<-table.element(a,hyperlink('basics.htm','ACF(k)','click here for more information about the Autocorrelation Function'),header=TRUE)
a<-table.element(a,'T-STAT',header=TRUE)
a<-table.element(a,'P-value',header=TRUE)
a<-table.row.end(a)
for (i in 2:(par1+1)) {
a<-table.row.start(a)
a<-table.element(a,i-1,header=TRUE)
a<-table.element(a,round(myacf[i],6))
mytstat <- myacf[i]*sqrtn
a<-table.element(a,round(mytstat,4))
a<-table.element(a,round(1-pt(abs(mytstat),lengthx),6))
a<-table.row.end(a)
}
a<-table.end(a)
table.save(a,file='mytable.tab')
a<-table.start()
a<-table.row.start(a)
a<-table.element(a,'Partial Autocorrelation Function',4,TRUE)
a<-table.row.end(a)
a<-table.row.start(a)
a<-table.element(a,'Time lag k',header=TRUE)
a<-table.element(a,hyperlink('basics.htm','PACF(k)','click here for more information about the Partial Autocorrelation Function'),header=TRUE)
a<-table.element(a,'T-STAT',header=TRUE)
a<-table.element(a,'P-value',header=TRUE)
a<-table.row.end(a)
for (i in 1:par1) {
a<-table.row.start(a)
a<-table.element(a,i,header=TRUE)
a<-table.element(a,round(mypacf[i],6))
mytstat <- mypacf[i]*sqrtn
a<-table.element(a,round(mytstat,4))
a<-table.element(a,round(1-pt(abs(mytstat),lengthx),6))
a<-table.row.end(a)
}
a<-table.end(a)
table.save(a,file='mytable1.tab')