Free Statistics
of Irreproducible Research!
Description of Statistical Computation | ||||||||||||||||||||||||||||||
|---|---|---|---|---|---|---|---|---|---|---|---|---|---|---|---|---|---|---|---|---|---|---|---|---|---|---|---|---|---|---|
| Author's title | ||||||||||||||||||||||||||||||
| Author | *Unverified author* | |||||||||||||||||||||||||||||
| R Software Module | -- | |||||||||||||||||||||||||||||
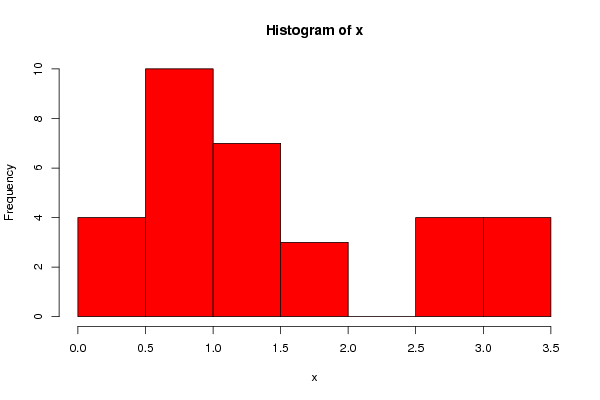
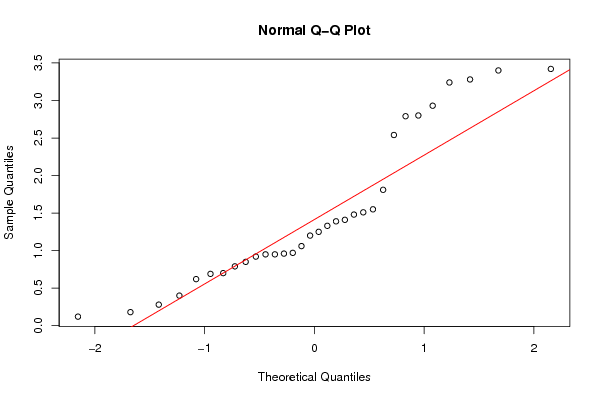
| Title produced by software | Histogram and QQPlot (Reddy-Moores Data) | |||||||||||||||||||||||||||||
| Date of computation | Thu, 01 Dec 2011 08:07:18 -0500 | |||||||||||||||||||||||||||||
| Cite this page as follows | Statistical Computations at FreeStatistics.org, Office for Research Development and Education, URL https://freestatistics.org/blog/index.php?v=date/2011/Dec/01/t1322744901k8t05dfuecbgeaa.htm/, Retrieved Fri, 19 Apr 2024 19:26:58 +0000 | |||||||||||||||||||||||||||||
| Statistical Computations at FreeStatistics.org, Office for Research Development and Education, URL https://freestatistics.org/blog/index.php?pk=149463, Retrieved Fri, 19 Apr 2024 19:26:58 +0000 | ||||||||||||||||||||||||||||||
| QR Codes: | ||||||||||||||||||||||||||||||
|
| ||||||||||||||||||||||||||||||
| Original text written by user: | ||||||||||||||||||||||||||||||
| IsPrivate? | No (this computation is public) | |||||||||||||||||||||||||||||
| User-defined keywords | ||||||||||||||||||||||||||||||
| Estimated Impact | 81 | |||||||||||||||||||||||||||||
Tree of Dependent Computations | ||||||||||||||||||||||||||||||
| Family? (F = Feedback message, R = changed R code, M = changed R Module, P = changed Parameters, D = changed Data) | ||||||||||||||||||||||||||||||
| - [Histogram and QQplot] [PY2224 Aston Work...] [2009-10-06 09:57:09] [98fd0e87c3eb04e0cc2efde01dbafab6] - P [Histogram and QQplot] [olivia friday] [2009-10-09 12:41:21] [3fdd735c61ad38cbc9b3393dc997cdb7] - RMPD [Histogram and QQplot] [Reddy Moores Hist...] [2009-10-09 13:23:16] [98fd0e87c3eb04e0cc2efde01dbafab6] - D [Histogram and QQPlot] [Histogram and QQ ...] [2009-12-16 15:50:52] [3fdd735c61ad38cbc9b3393dc997cdb7] - RM [Histogram and QQPlot (Reddy-Moores Data)] [histogram and qqp...] [2011-12-01 13:07:18] [d41d8cd98f00b204e9800998ecf8427e] [Current] | ||||||||||||||||||||||||||||||
| Feedback Forum | ||||||||||||||||||||||||||||||
Post a new message | ||||||||||||||||||||||||||||||
Dataset | ||||||||||||||||||||||||||||||
| Dataseries X: | ||||||||||||||||||||||||||||||
0.28 0.95 0.96 0.97 0.4 0.18 0.12 0.62 1.81 1.51 1.41 1.39 1.2 1.55 1.48 1.25 0.95 1.33 0.92 0.85 1.06 0.69 0.7 0.79 2.93 3.24 3.42 2.79 2.54 3.28 2.8 3.4 | ||||||||||||||||||||||||||||||
Tables (Output of Computation) | ||||||||||||||||||||||||||||||
| ||||||||||||||||||||||||||||||
Figures (Output of Computation) | ||||||||||||||||||||||||||||||
Input Parameters & R Code | ||||||||||||||||||||||||||||||
| Parameters (Session): | ||||||||||||||||||||||||||||||
| par1 = 10 ; | ||||||||||||||||||||||||||||||
| Parameters (R input): | ||||||||||||||||||||||||||||||
| par1 = 10 ; par2 = ; par3 = ; par4 = ; par5 = ; par6 = ; par7 = ; par8 = ; par9 = ; par10 = ; par11 = ; par12 = ; par13 = ; par14 = ; par15 = ; par16 = ; par17 = ; par18 = ; par19 = ; par20 = ; | ||||||||||||||||||||||||||||||
| R code (references can be found in the software module): | ||||||||||||||||||||||||||||||
bitmap(file='test1.png') | ||||||||||||||||||||||||||||||