Free Statistics
of Irreproducible Research!
Description of Statistical Computation | |||||||||||||||||||||||||||||||||||||||||
|---|---|---|---|---|---|---|---|---|---|---|---|---|---|---|---|---|---|---|---|---|---|---|---|---|---|---|---|---|---|---|---|---|---|---|---|---|---|---|---|---|---|
| Author's title | |||||||||||||||||||||||||||||||||||||||||
| Author | *The author of this computation has been verified* | ||||||||||||||||||||||||||||||||||||||||
| R Software Module | rwasp_univariatedataseries.wasp | ||||||||||||||||||||||||||||||||||||||||
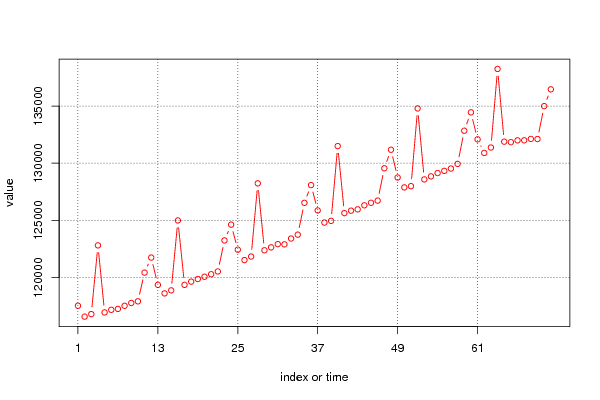
| Title produced by software | Univariate Data Series | ||||||||||||||||||||||||||||||||||||||||
| Date of computation | Thu, 01 Dec 2011 07:52:40 -0500 | ||||||||||||||||||||||||||||||||||||||||
| Cite this page as follows | Statistical Computations at FreeStatistics.org, Office for Research Development and Education, URL https://freestatistics.org/blog/index.php?v=date/2011/Dec/01/t1322743973ikimjohdpnmg9h0.htm/, Retrieved Sat, 20 Apr 2024 08:58:32 +0000 | ||||||||||||||||||||||||||||||||||||||||
| Statistical Computations at FreeStatistics.org, Office for Research Development and Education, URL https://freestatistics.org/blog/index.php?pk=149408, Retrieved Sat, 20 Apr 2024 08:58:32 +0000 | |||||||||||||||||||||||||||||||||||||||||
| QR Codes: | |||||||||||||||||||||||||||||||||||||||||
|
| |||||||||||||||||||||||||||||||||||||||||
| Original text written by user: | |||||||||||||||||||||||||||||||||||||||||
| IsPrivate? | No (this computation is public) | ||||||||||||||||||||||||||||||||||||||||
| User-defined keywords | |||||||||||||||||||||||||||||||||||||||||
| Estimated Impact | 177 | ||||||||||||||||||||||||||||||||||||||||
Tree of Dependent Computations | |||||||||||||||||||||||||||||||||||||||||
| Family? (F = Feedback message, R = changed R code, M = changed R Module, P = changed Parameters, D = changed Data) | |||||||||||||||||||||||||||||||||||||||||
| - [Univariate Data Series] [Grafiek geg ws9] [2011-12-01 12:52:40] [76a85a4cc6ea7903d92a0f5b9d2872d3] [Current] - R D [Univariate Data Series] [WS 9.1] [2011-12-02 10:37:00] [74be16979710d4c4e7c6647856088456] - [Univariate Data Series] [Paper Mathias Van...] [2011-12-17 13:22:22] [380049693c521f4999989215fb37aeca] - PD [Univariate Data Series] [Paper Mathias Van...] [2011-12-17 14:22:48] [380049693c521f4999989215fb37aeca] - RMP [Histogram] [Paper Mathias Van...] [2011-12-17 14:35:22] [380049693c521f4999989215fb37aeca] - R D [Histogram] [Paper Mathias Van...] [2011-12-19 12:12:21] [380049693c521f4999989215fb37aeca] - P [Histogram] [Paper Mathias Van...] [2011-12-19 18:48:56] [380049693c521f4999989215fb37aeca] - RMP [Notched Boxplots] [Paper Mathias Van...] [2011-12-19 19:00:04] [380049693c521f4999989215fb37aeca] - RMPD [Percentiles] [Paper Mathias Van...] [2011-12-19 12:23:29] [380049693c521f4999989215fb37aeca] - RMPD [Central Tendency] [Paper Mathias Van...] [2011-12-19 12:37:21] [380049693c521f4999989215fb37aeca] - RMPD [Mean Plot] [Paper Mathias Van...] [2011-12-19 12:50:51] [380049693c521f4999989215fb37aeca] - RMP [Central Tendency] [Paper Mathias Van...] [2011-12-17 14:45:47] [380049693c521f4999989215fb37aeca] - R D [Univariate Data Series] [WS 9 Gegevens Graf] [2011-12-02 20:30:06] [4f1f864fb932bb9c9d0c6cb0c11f4a44] - [Univariate Data Series] [Graph gegevens] [2011-12-02 20:30:48] [4f1f864fb932bb9c9d0c6cb0c11f4a44] - RMPD [ARIMA Forecasting] [] [2011-12-05 17:09:58] [09e53a95f5780167f20e6b4304200573] - RMPD [Notched Boxplots] [Paper: Boxplot en...] [2011-12-05 17:41:38] [09e53a95f5780167f20e6b4304200573] - RM [Univariate Data Series] [WS9-1] [2011-12-06 18:46:22] [74be16979710d4c4e7c6647856088456] | |||||||||||||||||||||||||||||||||||||||||
| Feedback Forum | |||||||||||||||||||||||||||||||||||||||||
Post a new message | |||||||||||||||||||||||||||||||||||||||||
Dataset | |||||||||||||||||||||||||||||||||||||||||
| Dataseries X: | |||||||||||||||||||||||||||||||||||||||||
117541,78 116587 116809 122819,55 116955 117186 117265 117536 117781 117928 120437,52 121753,21 119369,88 118622 118885 124998,3 119369 119647 119879 120075 120295 120538 123250,68 124631,03 122443,31 121532 121844 128241,75 122391 122644 122927 122909 123417 123756 126540,18 128088,74 125874,28 124817 124961 131499,9 125639 125851 125970 126322 126540 126733 129557,34 131179,77 128754,8 127890 127996 134790,6 128585 128851 129142 129334 129536 129944 132842,76 134447,96 132088,81 130902 131374 138243 131885 131839 132002 132005 132127 132116 134993,94 136459,55 | |||||||||||||||||||||||||||||||||||||||||
Tables (Output of Computation) | |||||||||||||||||||||||||||||||||||||||||
| |||||||||||||||||||||||||||||||||||||||||
Figures (Output of Computation) | |||||||||||||||||||||||||||||||||||||||||
Input Parameters & R Code | |||||||||||||||||||||||||||||||||||||||||
| Parameters (Session): | |||||||||||||||||||||||||||||||||||||||||
| par4 = 12 ; | |||||||||||||||||||||||||||||||||||||||||
| Parameters (R input): | |||||||||||||||||||||||||||||||||||||||||
| par1 = ; par2 = ; par3 = ; par4 = 12 ; | |||||||||||||||||||||||||||||||||||||||||
| R code (references can be found in the software module): | |||||||||||||||||||||||||||||||||||||||||
if (par4 != 'No season') { | |||||||||||||||||||||||||||||||||||||||||