Free Statistics

of Irreproducible Research!

Author's title

Author*Unverified author*
R Software Modulerwasp_smp.wasp
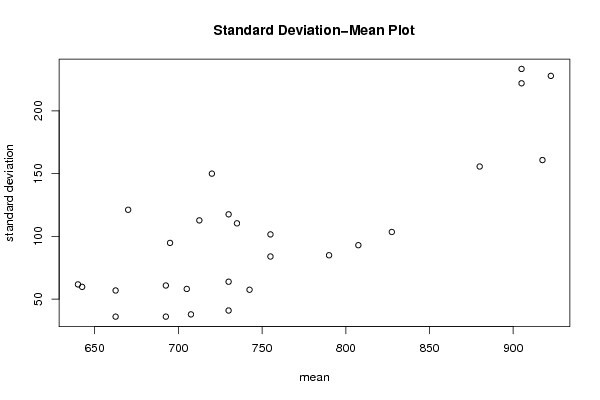
Title produced by softwareStandard Deviation-Mean Plot
Date of computationSun, 21 Aug 2011 08:41:36 -0400
Cite this page as followsStatistical Computations at FreeStatistics.org, Office for Research Development and Education, URL https://freestatistics.org/blog/index.php?v=date/2011/Aug/21/t1313930514x01bxvmymm8mlie.htm/, Retrieved Wed, 15 May 2024 09:41:05 +0000
Statistical Computations at FreeStatistics.org, Office for Research Development and Education, URL https://freestatistics.org/blog/index.php?pk=124234, Retrieved Wed, 15 May 2024 09:41:05 +0000
QR Codes:

Original text written by user:
IsPrivate?No (this computation is public)
User-defined keywordsBlij Arnaud
Estimated Impact195
Family? (F = Feedback message, R = changed R code, M = changed R Module, P = changed Parameters, D = changed Data)
-       [Standard Deviation-Mean Plot] [Tijdreeks 2 - Sta...] [2011-08-21 12:41:36] [084e0343a0486ff05530df6c705c8bb4] [Current]
Feedback Forum

Post a new message
Dataseries X:
600
700
720
630
660
740
700
670
720
630
700
770
570
640
720
630
700
700
670
760
870
670
810
810
610
600
730
630
750
770
660
790
890
680
800
860
670
610
690
680
740
760
670
750
890
730
750
940
740
640
640
750
770
780
640
730
970
780
720
1050
790
610
530
750
730
870
670
750
1090
830
740
1010
780
640
590
770
650
880
700
790
1140
860
630
1060
840
720
570
790
570
800
790
780
1120
850
600
1050
810
750
550
740
500
750
820
810
1090
820
630
1080


Summary of computational transaction
Raw Inputview raw input (R code)
Raw Outputview raw output of R engine
Computing time1 seconds
R Server'Gwilym Jenkins' @ jenkins.wessa.net

\begin{tabular}{lllllllll}
\hline
Summary of computational transaction \tabularnewline
Raw Input & view raw input (R code)  \tabularnewline
Raw Output & view raw output of R engine  \tabularnewline
Computing time & 1 seconds \tabularnewline
R Server & 'Gwilym Jenkins' @ jenkins.wessa.net \tabularnewline
\hline
\end{tabular}
%Source: https://freestatistics.org/blog/index.php?pk=124234&T=0

[TABLE]
[ROW][C]Summary of computational transaction[/C][/ROW]
[ROW][C]Raw Input[/C][C]view raw input (R code) [/C][/ROW]
[ROW][C]Raw Output[/C][C]view raw output of R engine [/C][/ROW]
[ROW][C]Computing time[/C][C]1 seconds[/C][/ROW]
[ROW][C]R Server[/C][C]'Gwilym Jenkins' @ jenkins.wessa.net[/C][/ROW]
[/TABLE]
Source: https://freestatistics.org/blog/index.php?pk=124234&T=0

Globally Unique Identifier (entire table): ba.freestatistics.org/blog/index.php?pk=124234&T=0

As an alternative you can also use a QR Code:  

The GUIDs for individual cells are displayed in the table below:

Summary of computational transaction
Raw Inputview raw input (R code)
Raw Outputview raw output of R engine
Computing time1 seconds
R Server'Gwilym Jenkins' @ jenkins.wessa.net


Standard Deviation-Mean Plot
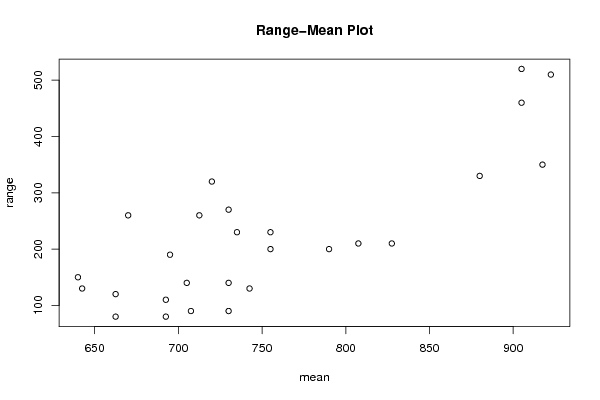
SectionMeanStandard DeviationRange
1662.556.7890834580027120
2692.535.93976442141380
370558.022983951764140
464061.6441400296898150
5707.537.749172176353790
679084.8528137423857200
7642.559.6517672272443130
8742.557.373048260195130
9807.592.8708781050336210
10662.535.93976442141380
1173040.824829046386390
12827.5103.400515794974210
13692.560.7590871118606110
1473063.7704215656966140
15880155.56349186104330
16670121.1060141639260
1775583.8649708360608200
18917.5160.701586799882350
1969594.6924847422786190
20755101.488915650922230
21922.5227.797424626941510
22730117.473401244707270
23735110.302614051829230
24905233.309522594628520
25712.5112.657297440808260
26720149.888847706114320
27905221.885856541902460

\begin{tabular}{lllllllll}
\hline
Standard Deviation-Mean Plot \tabularnewline
Section & Mean & Standard Deviation & Range \tabularnewline
1 & 662.5 & 56.7890834580027 & 120 \tabularnewline
2 & 692.5 & 35.939764421413 & 80 \tabularnewline
3 & 705 & 58.022983951764 & 140 \tabularnewline
4 & 640 & 61.6441400296898 & 150 \tabularnewline
5 & 707.5 & 37.7491721763537 & 90 \tabularnewline
6 & 790 & 84.8528137423857 & 200 \tabularnewline
7 & 642.5 & 59.6517672272443 & 130 \tabularnewline
8 & 742.5 & 57.373048260195 & 130 \tabularnewline
9 & 807.5 & 92.8708781050336 & 210 \tabularnewline
10 & 662.5 & 35.939764421413 & 80 \tabularnewline
11 & 730 & 40.8248290463863 & 90 \tabularnewline
12 & 827.5 & 103.400515794974 & 210 \tabularnewline
13 & 692.5 & 60.7590871118606 & 110 \tabularnewline
14 & 730 & 63.7704215656966 & 140 \tabularnewline
15 & 880 & 155.56349186104 & 330 \tabularnewline
16 & 670 & 121.1060141639 & 260 \tabularnewline
17 & 755 & 83.8649708360608 & 200 \tabularnewline
18 & 917.5 & 160.701586799882 & 350 \tabularnewline
19 & 695 & 94.6924847422786 & 190 \tabularnewline
20 & 755 & 101.488915650922 & 230 \tabularnewline
21 & 922.5 & 227.797424626941 & 510 \tabularnewline
22 & 730 & 117.473401244707 & 270 \tabularnewline
23 & 735 & 110.302614051829 & 230 \tabularnewline
24 & 905 & 233.309522594628 & 520 \tabularnewline
25 & 712.5 & 112.657297440808 & 260 \tabularnewline
26 & 720 & 149.888847706114 & 320 \tabularnewline
27 & 905 & 221.885856541902 & 460 \tabularnewline
\hline
\end{tabular}
%Source: https://freestatistics.org/blog/index.php?pk=124234&T=1

[TABLE]
[ROW][C]Standard Deviation-Mean Plot[/C][/ROW]
[ROW][C]Section[/C][C]Mean[/C][C]Standard Deviation[/C][C]Range[/C][/ROW]
[ROW][C]1[/C][C]662.5[/C][C]56.7890834580027[/C][C]120[/C][/ROW]
[ROW][C]2[/C][C]692.5[/C][C]35.939764421413[/C][C]80[/C][/ROW]
[ROW][C]3[/C][C]705[/C][C]58.022983951764[/C][C]140[/C][/ROW]
[ROW][C]4[/C][C]640[/C][C]61.6441400296898[/C][C]150[/C][/ROW]
[ROW][C]5[/C][C]707.5[/C][C]37.7491721763537[/C][C]90[/C][/ROW]
[ROW][C]6[/C][C]790[/C][C]84.8528137423857[/C][C]200[/C][/ROW]
[ROW][C]7[/C][C]642.5[/C][C]59.6517672272443[/C][C]130[/C][/ROW]
[ROW][C]8[/C][C]742.5[/C][C]57.373048260195[/C][C]130[/C][/ROW]
[ROW][C]9[/C][C]807.5[/C][C]92.8708781050336[/C][C]210[/C][/ROW]
[ROW][C]10[/C][C]662.5[/C][C]35.939764421413[/C][C]80[/C][/ROW]
[ROW][C]11[/C][C]730[/C][C]40.8248290463863[/C][C]90[/C][/ROW]
[ROW][C]12[/C][C]827.5[/C][C]103.400515794974[/C][C]210[/C][/ROW]
[ROW][C]13[/C][C]692.5[/C][C]60.7590871118606[/C][C]110[/C][/ROW]
[ROW][C]14[/C][C]730[/C][C]63.7704215656966[/C][C]140[/C][/ROW]
[ROW][C]15[/C][C]880[/C][C]155.56349186104[/C][C]330[/C][/ROW]
[ROW][C]16[/C][C]670[/C][C]121.1060141639[/C][C]260[/C][/ROW]
[ROW][C]17[/C][C]755[/C][C]83.8649708360608[/C][C]200[/C][/ROW]
[ROW][C]18[/C][C]917.5[/C][C]160.701586799882[/C][C]350[/C][/ROW]
[ROW][C]19[/C][C]695[/C][C]94.6924847422786[/C][C]190[/C][/ROW]
[ROW][C]20[/C][C]755[/C][C]101.488915650922[/C][C]230[/C][/ROW]
[ROW][C]21[/C][C]922.5[/C][C]227.797424626941[/C][C]510[/C][/ROW]
[ROW][C]22[/C][C]730[/C][C]117.473401244707[/C][C]270[/C][/ROW]
[ROW][C]23[/C][C]735[/C][C]110.302614051829[/C][C]230[/C][/ROW]
[ROW][C]24[/C][C]905[/C][C]233.309522594628[/C][C]520[/C][/ROW]
[ROW][C]25[/C][C]712.5[/C][C]112.657297440808[/C][C]260[/C][/ROW]
[ROW][C]26[/C][C]720[/C][C]149.888847706114[/C][C]320[/C][/ROW]
[ROW][C]27[/C][C]905[/C][C]221.885856541902[/C][C]460[/C][/ROW]
[/TABLE]
Source: https://freestatistics.org/blog/index.php?pk=124234&T=1

Globally Unique Identifier (entire table): ba.freestatistics.org/blog/index.php?pk=124234&T=1

As an alternative you can also use a QR Code:  

The GUIDs for individual cells are displayed in the table below:

Standard Deviation-Mean Plot
SectionMeanStandard DeviationRange
1662.556.7890834580027120
2692.535.93976442141380
370558.022983951764140
464061.6441400296898150
5707.537.749172176353790
679084.8528137423857200
7642.559.6517672272443130
8742.557.373048260195130
9807.592.8708781050336210
10662.535.93976442141380
1173040.824829046386390
12827.5103.400515794974210
13692.560.7590871118606110
1473063.7704215656966140
15880155.56349186104330
16670121.1060141639260
1775583.8649708360608200
18917.5160.701586799882350
1969594.6924847422786190
20755101.488915650922230
21922.5227.797424626941510
22730117.473401244707270
23735110.302614051829230
24905233.309522594628520
25712.5112.657297440808260
26720149.888847706114320
27905221.885856541902460


Regression: S.E.(k) = alpha + beta * Mean(k)
alpha-301.08652604745
beta0.534529476314462
S.D.0.0791593504929152
T-STAT6.75257531783693
p-value4.4618375957398e-07

\begin{tabular}{lllllllll}
\hline
Regression: S.E.(k) = alpha + beta * Mean(k) \tabularnewline
alpha & -301.08652604745 \tabularnewline
beta & 0.534529476314462 \tabularnewline
S.D. & 0.0791593504929152 \tabularnewline
T-STAT & 6.75257531783693 \tabularnewline
p-value & 4.4618375957398e-07 \tabularnewline
\hline
\end{tabular}
%Source: https://freestatistics.org/blog/index.php?pk=124234&T=2

[TABLE]
[ROW][C]Regression: S.E.(k) = alpha + beta * Mean(k)[/C][/ROW]
[ROW][C]alpha[/C][C]-301.08652604745[/C][/ROW]
[ROW][C]beta[/C][C]0.534529476314462[/C][/ROW]
[ROW][C]S.D.[/C][C]0.0791593504929152[/C][/ROW]
[ROW][C]T-STAT[/C][C]6.75257531783693[/C][/ROW]
[ROW][C]p-value[/C][C]4.4618375957398e-07[/C][/ROW]
[/TABLE]
Source: https://freestatistics.org/blog/index.php?pk=124234&T=2

Globally Unique Identifier (entire table): ba.freestatistics.org/blog/index.php?pk=124234&T=2

As an alternative you can also use a QR Code:  

The GUIDs for individual cells are displayed in the table below:

Regression: S.E.(k) = alpha + beta * Mean(k)
alpha-301.08652604745
beta0.534529476314462
S.D.0.0791593504929152
T-STAT6.75257531783693
p-value4.4618375957398e-07


Regression: ln S.E.(k) = alpha + beta * ln Mean(k)
alpha-19.8878117148916
beta3.68077168028318
S.D.0.67166438670444
T-STAT5.48007569426615
p-value1.08201272340809e-05
Lambda-2.68077168028318

\begin{tabular}{lllllllll}
\hline
Regression: ln S.E.(k) = alpha + beta * ln Mean(k) \tabularnewline
alpha & -19.8878117148916 \tabularnewline
beta & 3.68077168028318 \tabularnewline
S.D. & 0.67166438670444 \tabularnewline
T-STAT & 5.48007569426615 \tabularnewline
p-value & 1.08201272340809e-05 \tabularnewline
Lambda & -2.68077168028318 \tabularnewline
\hline
\end{tabular}
%Source: https://freestatistics.org/blog/index.php?pk=124234&T=3

[TABLE]
[ROW][C]Regression: ln S.E.(k) = alpha + beta * ln Mean(k)[/C][/ROW]
[ROW][C]alpha[/C][C]-19.8878117148916[/C][/ROW]
[ROW][C]beta[/C][C]3.68077168028318[/C][/ROW]
[ROW][C]S.D.[/C][C]0.67166438670444[/C][/ROW]
[ROW][C]T-STAT[/C][C]5.48007569426615[/C][/ROW]
[ROW][C]p-value[/C][C]1.08201272340809e-05[/C][/ROW]
[ROW][C]Lambda[/C][C]-2.68077168028318[/C][/ROW]
[/TABLE]
Source: https://freestatistics.org/blog/index.php?pk=124234&T=3

Globally Unique Identifier (entire table): ba.freestatistics.org/blog/index.php?pk=124234&T=3

As an alternative you can also use a QR Code:  

The GUIDs for individual cells are displayed in the table below:

Regression: ln S.E.(k) = alpha + beta * ln Mean(k)
alpha-19.8878117148916
beta3.68077168028318
S.D.0.67166438670444
T-STAT5.48007569426615
p-value1.08201272340809e-05
Lambda-2.68077168028318


Parameters (Session):
par1 = 4 ;
Parameters (R input):
par1 = 4 ;
R code (references can be found in the software module):
par1 <- as.numeric(par1)
(n <- length(x))
(np <- floor(n / par1))
arr <- array(NA,dim=c(par1,np))
j <- 0
k <- 1
for (i in 1:(np*par1))
{
j = j + 1
arr[j,k] <- x[i]
if (j == par1) {
j = 0
k=k+1
}
}
arr
arr.mean <- array(NA,dim=np)
arr.sd <- array(NA,dim=np)
arr.range <- array(NA,dim=np)
for (j in 1:np)
{
arr.mean[j] <- mean(arr[,j],na.rm=TRUE)
arr.sd[j] <- sd(arr[,j],na.rm=TRUE)
arr.range[j] <- max(arr[,j],na.rm=TRUE) - min(arr[,j],na.rm=TRUE)
}
arr.mean
arr.sd
arr.range
(lm1 <- lm(arr.sd~arr.mean))
(lnlm1 <- lm(log(arr.sd)~log(arr.mean)))
(lm2 <- lm(arr.range~arr.mean))
bitmap(file='test1.png')
plot(arr.mean,arr.sd,main='Standard Deviation-Mean Plot',xlab='mean',ylab='standard deviation')
dev.off()
bitmap(file='test2.png')
plot(arr.mean,arr.range,main='Range-Mean Plot',xlab='mean',ylab='range')
dev.off()
load(file='createtable')
a<-table.start()
a<-table.row.start(a)
a<-table.element(a,'Standard Deviation-Mean Plot',4,TRUE)
a<-table.row.end(a)
a<-table.row.start(a)
a<-table.element(a,'Section',header=TRUE)
a<-table.element(a,'Mean',header=TRUE)
a<-table.element(a,'Standard Deviation',header=TRUE)
a<-table.element(a,'Range',header=TRUE)
a<-table.row.end(a)
for (j in 1:np) {
a<-table.row.start(a)
a<-table.element(a,j,header=TRUE)
a<-table.element(a,arr.mean[j])
a<-table.element(a,arr.sd[j] )
a<-table.element(a,arr.range[j] )
a<-table.row.end(a)
}
a<-table.end(a)
table.save(a,file='mytable.tab')
a<-table.start()
a<-table.row.start(a)
a<-table.element(a,'Regression: S.E.(k) = alpha + beta * Mean(k)',2,TRUE)
a<-table.row.end(a)
a<-table.row.start(a)
a<-table.element(a,'alpha',header=TRUE)
a<-table.element(a,lm1$coefficients[[1]])
a<-table.row.end(a)
a<-table.row.start(a)
a<-table.element(a,'beta',header=TRUE)
a<-table.element(a,lm1$coefficients[[2]])
a<-table.row.end(a)
a<-table.row.start(a)
a<-table.element(a,'S.D.',header=TRUE)
a<-table.element(a,summary(lm1)$coefficients[2,2])
a<-table.row.end(a)
a<-table.row.start(a)
a<-table.element(a,'T-STAT',header=TRUE)
a<-table.element(a,summary(lm1)$coefficients[2,3])
a<-table.row.end(a)
a<-table.row.start(a)
a<-table.element(a,'p-value',header=TRUE)
a<-table.element(a,summary(lm1)$coefficients[2,4])
a<-table.row.end(a)
a<-table.end(a)
table.save(a,file='mytable1.tab')
a<-table.start()
a<-table.row.start(a)
a<-table.element(a,'Regression: ln S.E.(k) = alpha + beta * ln Mean(k)',2,TRUE)
a<-table.row.end(a)
a<-table.row.start(a)
a<-table.element(a,'alpha',header=TRUE)
a<-table.element(a,lnlm1$coefficients[[1]])
a<-table.row.end(a)
a<-table.row.start(a)
a<-table.element(a,'beta',header=TRUE)
a<-table.element(a,lnlm1$coefficients[[2]])
a<-table.row.end(a)
a<-table.row.start(a)
a<-table.element(a,'S.D.',header=TRUE)
a<-table.element(a,summary(lnlm1)$coefficients[2,2])
a<-table.row.end(a)
a<-table.row.start(a)
a<-table.element(a,'T-STAT',header=TRUE)
a<-table.element(a,summary(lnlm1)$coefficients[2,3])
a<-table.row.end(a)
a<-table.row.start(a)
a<-table.element(a,'p-value',header=TRUE)
a<-table.element(a,summary(lnlm1)$coefficients[2,4])
a<-table.row.end(a)
a<-table.row.start(a)
a<-table.element(a,'Lambda',header=TRUE)
a<-table.element(a,1-lnlm1$coefficients[[2]])
a<-table.row.end(a)
a<-table.end(a)
table.save(a,file='mytable2.tab')