Free Statistics

of Irreproducible Research!

Author's title

Author*Unverified author*
R Software Modulerwasp_autocorrelation.wasp
Title produced by software(Partial) Autocorrelation Function
Date of computationSun, 21 Aug 2011 08:36:15 -0400
Cite this page as followsStatistical Computations at FreeStatistics.org, Office for Research Development and Education, URL https://freestatistics.org/blog/index.php?v=date/2011/Aug/21/t1313930197f3v36api87pm8o4.htm/, Retrieved Wed, 15 May 2024 11:49:45 +0000
Statistical Computations at FreeStatistics.org, Office for Research Development and Education, URL https://freestatistics.org/blog/index.php?pk=124232, Retrieved Wed, 15 May 2024 11:49:45 +0000
QR Codes:

Original text written by user:
IsPrivate?No (this computation is public)
User-defined keywordsBlij Arnaud
Estimated Impact181
Family? (F = Feedback message, R = changed R code, M = changed R Module, P = changed Parameters, D = changed Data)
-       [(Partial) Autocorrelation Function] [Tijdreeks - Stap 17] [2011-08-21 12:36:15] [084e0343a0486ff05530df6c705c8bb4] [Current]
Feedback Forum

Post a new message
Dataseries X:
600
700
720
630
660
740
700
670
720
630
700
770
570
640
720
630
700
700
670
760
870
670
810
810
610
600
730
630
750
770
660
790
890
680
800
860
670
610
690
680
740
760
670
750
890
730
750
940
740
640
640
750
770
780
640
730
970
780
720
1050
790
610
530
750
730
870
670
750
1090
830
740
1010
780
640
590
770
650
880
700
790
1140
860
630
1060
840
720
570
790
570
800
790
780
1120
850
600
1050
810
750
550
740
500
750
820
810
1090
820
630
1080


Summary of computational transaction
Raw Inputview raw input (R code)
Raw Outputview raw output of R engine
Computing time1 seconds
R Server'Herman Ole Andreas Wold' @ wold.wessa.net

\begin{tabular}{lllllllll}
\hline
Summary of computational transaction \tabularnewline
Raw Input & view raw input (R code)  \tabularnewline
Raw Output & view raw output of R engine  \tabularnewline
Computing time & 1 seconds \tabularnewline
R Server & 'Herman Ole Andreas Wold' @ wold.wessa.net \tabularnewline
\hline
\end{tabular}
%Source: https://freestatistics.org/blog/index.php?pk=124232&T=0

[TABLE]
[ROW][C]Summary of computational transaction[/C][/ROW]
[ROW][C]Raw Input[/C][C]view raw input (R code) [/C][/ROW]
[ROW][C]Raw Output[/C][C]view raw output of R engine [/C][/ROW]
[ROW][C]Computing time[/C][C]1 seconds[/C][/ROW]
[ROW][C]R Server[/C][C]'Herman Ole Andreas Wold' @ wold.wessa.net[/C][/ROW]
[/TABLE]
Source: https://freestatistics.org/blog/index.php?pk=124232&T=0

Globally Unique Identifier (entire table): ba.freestatistics.org/blog/index.php?pk=124232&T=0

As an alternative you can also use a QR Code:  

The GUIDs for individual cells are displayed in the table below:

Summary of computational transaction
Raw Inputview raw input (R code)
Raw Outputview raw output of R engine
Computing time1 seconds
R Server'Herman Ole Andreas Wold' @ wold.wessa.net


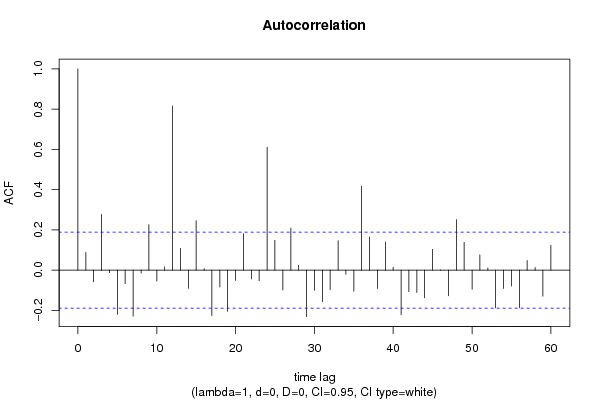
Autocorrelation Function
Time lag kACF(k)T-STATP-value
10.0872230.90650.183358
2-0.057883-0.60150.27437
30.2761452.86980.002471
4-0.012592-0.13090.448064
5-0.219202-2.2780.012347
6-0.067158-0.69790.243361
7-0.228669-2.37640.009622
8-0.015116-0.15710.437734
90.2254812.34330.010473
10-0.053996-0.56110.287931
110.0160610.16690.433875
120.8155288.47520
130.108141.12380.131789
14-0.090445-0.93990.174674
150.2458692.55510.006003
160.0068910.07160.471523
17-0.225515-2.34360.010464
18-0.083275-0.86540.194364
19-0.204303-2.12320.018011
20-0.051528-0.53550.296706
210.1811551.88260.031222
22-0.043563-0.45270.32583
23-0.052672-0.54740.292623
240.6111436.35120
250.1480741.53880.063385
26-0.098481-1.02340.154192
270.2089672.17160.016035
280.0237230.24650.402866
29-0.231307-2.40380.008964
30-0.099852-1.03770.150867
31-0.157269-1.63440.052544
32-0.096543-1.00330.158979
330.1464121.52160.065522
34-0.020191-0.20980.417099
35-0.105026-1.09150.13875
360.4172564.33631.6e-05
370.1649091.71380.044719
38-0.091292-0.94870.172438
390.1397731.45260.074623
400.0139780.14530.442389
41-0.221551-2.30240.011614
42-0.107087-1.11290.134115
43-0.111602-1.15980.124343
44-0.137613-1.43010.077785
450.1032321.07280.142873
46-0.000639-0.00660.497358
47-0.127759-1.32770.093536
480.2510812.60930.005179
490.1379861.4340.077232
50-0.094993-0.98720.162877
510.0756570.78620.216722
520.0102910.10690.457514
53-0.187752-1.95120.026813
54-0.091134-0.94710.172852
55-0.079086-0.82190.206476
56-0.187398-1.94750.027036
570.0481530.50040.308899
580.0131530.13670.445764
59-0.129242-1.34310.091024
600.1239361.2880.100253

\begin{tabular}{lllllllll}
\hline
Autocorrelation Function \tabularnewline
Time lag k & ACF(k) & T-STAT & P-value \tabularnewline
1 & 0.087223 & 0.9065 & 0.183358 \tabularnewline
2 & -0.057883 & -0.6015 & 0.27437 \tabularnewline
3 & 0.276145 & 2.8698 & 0.002471 \tabularnewline
4 & -0.012592 & -0.1309 & 0.448064 \tabularnewline
5 & -0.219202 & -2.278 & 0.012347 \tabularnewline
6 & -0.067158 & -0.6979 & 0.243361 \tabularnewline
7 & -0.228669 & -2.3764 & 0.009622 \tabularnewline
8 & -0.015116 & -0.1571 & 0.437734 \tabularnewline
9 & 0.225481 & 2.3433 & 0.010473 \tabularnewline
10 & -0.053996 & -0.5611 & 0.287931 \tabularnewline
11 & 0.016061 & 0.1669 & 0.433875 \tabularnewline
12 & 0.815528 & 8.4752 & 0 \tabularnewline
13 & 0.10814 & 1.1238 & 0.131789 \tabularnewline
14 & -0.090445 & -0.9399 & 0.174674 \tabularnewline
15 & 0.245869 & 2.5551 & 0.006003 \tabularnewline
16 & 0.006891 & 0.0716 & 0.471523 \tabularnewline
17 & -0.225515 & -2.3436 & 0.010464 \tabularnewline
18 & -0.083275 & -0.8654 & 0.194364 \tabularnewline
19 & -0.204303 & -2.1232 & 0.018011 \tabularnewline
20 & -0.051528 & -0.5355 & 0.296706 \tabularnewline
21 & 0.181155 & 1.8826 & 0.031222 \tabularnewline
22 & -0.043563 & -0.4527 & 0.32583 \tabularnewline
23 & -0.052672 & -0.5474 & 0.292623 \tabularnewline
24 & 0.611143 & 6.3512 & 0 \tabularnewline
25 & 0.148074 & 1.5388 & 0.063385 \tabularnewline
26 & -0.098481 & -1.0234 & 0.154192 \tabularnewline
27 & 0.208967 & 2.1716 & 0.016035 \tabularnewline
28 & 0.023723 & 0.2465 & 0.402866 \tabularnewline
29 & -0.231307 & -2.4038 & 0.008964 \tabularnewline
30 & -0.099852 & -1.0377 & 0.150867 \tabularnewline
31 & -0.157269 & -1.6344 & 0.052544 \tabularnewline
32 & -0.096543 & -1.0033 & 0.158979 \tabularnewline
33 & 0.146412 & 1.5216 & 0.065522 \tabularnewline
34 & -0.020191 & -0.2098 & 0.417099 \tabularnewline
35 & -0.105026 & -1.0915 & 0.13875 \tabularnewline
36 & 0.417256 & 4.3363 & 1.6e-05 \tabularnewline
37 & 0.164909 & 1.7138 & 0.044719 \tabularnewline
38 & -0.091292 & -0.9487 & 0.172438 \tabularnewline
39 & 0.139773 & 1.4526 & 0.074623 \tabularnewline
40 & 0.013978 & 0.1453 & 0.442389 \tabularnewline
41 & -0.221551 & -2.3024 & 0.011614 \tabularnewline
42 & -0.107087 & -1.1129 & 0.134115 \tabularnewline
43 & -0.111602 & -1.1598 & 0.124343 \tabularnewline
44 & -0.137613 & -1.4301 & 0.077785 \tabularnewline
45 & 0.103232 & 1.0728 & 0.142873 \tabularnewline
46 & -0.000639 & -0.0066 & 0.497358 \tabularnewline
47 & -0.127759 & -1.3277 & 0.093536 \tabularnewline
48 & 0.251081 & 2.6093 & 0.005179 \tabularnewline
49 & 0.137986 & 1.434 & 0.077232 \tabularnewline
50 & -0.094993 & -0.9872 & 0.162877 \tabularnewline
51 & 0.075657 & 0.7862 & 0.216722 \tabularnewline
52 & 0.010291 & 0.1069 & 0.457514 \tabularnewline
53 & -0.187752 & -1.9512 & 0.026813 \tabularnewline
54 & -0.091134 & -0.9471 & 0.172852 \tabularnewline
55 & -0.079086 & -0.8219 & 0.206476 \tabularnewline
56 & -0.187398 & -1.9475 & 0.027036 \tabularnewline
57 & 0.048153 & 0.5004 & 0.308899 \tabularnewline
58 & 0.013153 & 0.1367 & 0.445764 \tabularnewline
59 & -0.129242 & -1.3431 & 0.091024 \tabularnewline
60 & 0.123936 & 1.288 & 0.100253 \tabularnewline
\hline
\end{tabular}
%Source: https://freestatistics.org/blog/index.php?pk=124232&T=1

[TABLE]
[ROW][C]Autocorrelation Function[/C][/ROW]
[ROW][C]Time lag k[/C][C]ACF(k)[/C][C]T-STAT[/C][C]P-value[/C][/ROW]
[ROW][C]1[/C][C]0.087223[/C][C]0.9065[/C][C]0.183358[/C][/ROW]
[ROW][C]2[/C][C]-0.057883[/C][C]-0.6015[/C][C]0.27437[/C][/ROW]
[ROW][C]3[/C][C]0.276145[/C][C]2.8698[/C][C]0.002471[/C][/ROW]
[ROW][C]4[/C][C]-0.012592[/C][C]-0.1309[/C][C]0.448064[/C][/ROW]
[ROW][C]5[/C][C]-0.219202[/C][C]-2.278[/C][C]0.012347[/C][/ROW]
[ROW][C]6[/C][C]-0.067158[/C][C]-0.6979[/C][C]0.243361[/C][/ROW]
[ROW][C]7[/C][C]-0.228669[/C][C]-2.3764[/C][C]0.009622[/C][/ROW]
[ROW][C]8[/C][C]-0.015116[/C][C]-0.1571[/C][C]0.437734[/C][/ROW]
[ROW][C]9[/C][C]0.225481[/C][C]2.3433[/C][C]0.010473[/C][/ROW]
[ROW][C]10[/C][C]-0.053996[/C][C]-0.5611[/C][C]0.287931[/C][/ROW]
[ROW][C]11[/C][C]0.016061[/C][C]0.1669[/C][C]0.433875[/C][/ROW]
[ROW][C]12[/C][C]0.815528[/C][C]8.4752[/C][C]0[/C][/ROW]
[ROW][C]13[/C][C]0.10814[/C][C]1.1238[/C][C]0.131789[/C][/ROW]
[ROW][C]14[/C][C]-0.090445[/C][C]-0.9399[/C][C]0.174674[/C][/ROW]
[ROW][C]15[/C][C]0.245869[/C][C]2.5551[/C][C]0.006003[/C][/ROW]
[ROW][C]16[/C][C]0.006891[/C][C]0.0716[/C][C]0.471523[/C][/ROW]
[ROW][C]17[/C][C]-0.225515[/C][C]-2.3436[/C][C]0.010464[/C][/ROW]
[ROW][C]18[/C][C]-0.083275[/C][C]-0.8654[/C][C]0.194364[/C][/ROW]
[ROW][C]19[/C][C]-0.204303[/C][C]-2.1232[/C][C]0.018011[/C][/ROW]
[ROW][C]20[/C][C]-0.051528[/C][C]-0.5355[/C][C]0.296706[/C][/ROW]
[ROW][C]21[/C][C]0.181155[/C][C]1.8826[/C][C]0.031222[/C][/ROW]
[ROW][C]22[/C][C]-0.043563[/C][C]-0.4527[/C][C]0.32583[/C][/ROW]
[ROW][C]23[/C][C]-0.052672[/C][C]-0.5474[/C][C]0.292623[/C][/ROW]
[ROW][C]24[/C][C]0.611143[/C][C]6.3512[/C][C]0[/C][/ROW]
[ROW][C]25[/C][C]0.148074[/C][C]1.5388[/C][C]0.063385[/C][/ROW]
[ROW][C]26[/C][C]-0.098481[/C][C]-1.0234[/C][C]0.154192[/C][/ROW]
[ROW][C]27[/C][C]0.208967[/C][C]2.1716[/C][C]0.016035[/C][/ROW]
[ROW][C]28[/C][C]0.023723[/C][C]0.2465[/C][C]0.402866[/C][/ROW]
[ROW][C]29[/C][C]-0.231307[/C][C]-2.4038[/C][C]0.008964[/C][/ROW]
[ROW][C]30[/C][C]-0.099852[/C][C]-1.0377[/C][C]0.150867[/C][/ROW]
[ROW][C]31[/C][C]-0.157269[/C][C]-1.6344[/C][C]0.052544[/C][/ROW]
[ROW][C]32[/C][C]-0.096543[/C][C]-1.0033[/C][C]0.158979[/C][/ROW]
[ROW][C]33[/C][C]0.146412[/C][C]1.5216[/C][C]0.065522[/C][/ROW]
[ROW][C]34[/C][C]-0.020191[/C][C]-0.2098[/C][C]0.417099[/C][/ROW]
[ROW][C]35[/C][C]-0.105026[/C][C]-1.0915[/C][C]0.13875[/C][/ROW]
[ROW][C]36[/C][C]0.417256[/C][C]4.3363[/C][C]1.6e-05[/C][/ROW]
[ROW][C]37[/C][C]0.164909[/C][C]1.7138[/C][C]0.044719[/C][/ROW]
[ROW][C]38[/C][C]-0.091292[/C][C]-0.9487[/C][C]0.172438[/C][/ROW]
[ROW][C]39[/C][C]0.139773[/C][C]1.4526[/C][C]0.074623[/C][/ROW]
[ROW][C]40[/C][C]0.013978[/C][C]0.1453[/C][C]0.442389[/C][/ROW]
[ROW][C]41[/C][C]-0.221551[/C][C]-2.3024[/C][C]0.011614[/C][/ROW]
[ROW][C]42[/C][C]-0.107087[/C][C]-1.1129[/C][C]0.134115[/C][/ROW]
[ROW][C]43[/C][C]-0.111602[/C][C]-1.1598[/C][C]0.124343[/C][/ROW]
[ROW][C]44[/C][C]-0.137613[/C][C]-1.4301[/C][C]0.077785[/C][/ROW]
[ROW][C]45[/C][C]0.103232[/C][C]1.0728[/C][C]0.142873[/C][/ROW]
[ROW][C]46[/C][C]-0.000639[/C][C]-0.0066[/C][C]0.497358[/C][/ROW]
[ROW][C]47[/C][C]-0.127759[/C][C]-1.3277[/C][C]0.093536[/C][/ROW]
[ROW][C]48[/C][C]0.251081[/C][C]2.6093[/C][C]0.005179[/C][/ROW]
[ROW][C]49[/C][C]0.137986[/C][C]1.434[/C][C]0.077232[/C][/ROW]
[ROW][C]50[/C][C]-0.094993[/C][C]-0.9872[/C][C]0.162877[/C][/ROW]
[ROW][C]51[/C][C]0.075657[/C][C]0.7862[/C][C]0.216722[/C][/ROW]
[ROW][C]52[/C][C]0.010291[/C][C]0.1069[/C][C]0.457514[/C][/ROW]
[ROW][C]53[/C][C]-0.187752[/C][C]-1.9512[/C][C]0.026813[/C][/ROW]
[ROW][C]54[/C][C]-0.091134[/C][C]-0.9471[/C][C]0.172852[/C][/ROW]
[ROW][C]55[/C][C]-0.079086[/C][C]-0.8219[/C][C]0.206476[/C][/ROW]
[ROW][C]56[/C][C]-0.187398[/C][C]-1.9475[/C][C]0.027036[/C][/ROW]
[ROW][C]57[/C][C]0.048153[/C][C]0.5004[/C][C]0.308899[/C][/ROW]
[ROW][C]58[/C][C]0.013153[/C][C]0.1367[/C][C]0.445764[/C][/ROW]
[ROW][C]59[/C][C]-0.129242[/C][C]-1.3431[/C][C]0.091024[/C][/ROW]
[ROW][C]60[/C][C]0.123936[/C][C]1.288[/C][C]0.100253[/C][/ROW]
[/TABLE]
Source: https://freestatistics.org/blog/index.php?pk=124232&T=1

Globally Unique Identifier (entire table): ba.freestatistics.org/blog/index.php?pk=124232&T=1

As an alternative you can also use a QR Code:  

The GUIDs for individual cells are displayed in the table below:

Autocorrelation Function
Time lag kACF(k)T-STATP-value
10.0872230.90650.183358
2-0.057883-0.60150.27437
30.2761452.86980.002471
4-0.012592-0.13090.448064
5-0.219202-2.2780.012347
6-0.067158-0.69790.243361
7-0.228669-2.37640.009622
8-0.015116-0.15710.437734
90.2254812.34330.010473
10-0.053996-0.56110.287931
110.0160610.16690.433875
120.8155288.47520
130.108141.12380.131789
14-0.090445-0.93990.174674
150.2458692.55510.006003
160.0068910.07160.471523
17-0.225515-2.34360.010464
18-0.083275-0.86540.194364
19-0.204303-2.12320.018011
20-0.051528-0.53550.296706
210.1811551.88260.031222
22-0.043563-0.45270.32583
23-0.052672-0.54740.292623
240.6111436.35120
250.1480741.53880.063385
26-0.098481-1.02340.154192
270.2089672.17160.016035
280.0237230.24650.402866
29-0.231307-2.40380.008964
30-0.099852-1.03770.150867
31-0.157269-1.63440.052544
32-0.096543-1.00330.158979
330.1464121.52160.065522
34-0.020191-0.20980.417099
35-0.105026-1.09150.13875
360.4172564.33631.6e-05
370.1649091.71380.044719
38-0.091292-0.94870.172438
390.1397731.45260.074623
400.0139780.14530.442389
41-0.221551-2.30240.011614
42-0.107087-1.11290.134115
43-0.111602-1.15980.124343
44-0.137613-1.43010.077785
450.1032321.07280.142873
46-0.000639-0.00660.497358
47-0.127759-1.32770.093536
480.2510812.60930.005179
490.1379861.4340.077232
50-0.094993-0.98720.162877
510.0756570.78620.216722
520.0102910.10690.457514
53-0.187752-1.95120.026813
54-0.091134-0.94710.172852
55-0.079086-0.82190.206476
56-0.187398-1.94750.027036
570.0481530.50040.308899
580.0131530.13670.445764
59-0.129242-1.34310.091024
600.1239361.2880.100253


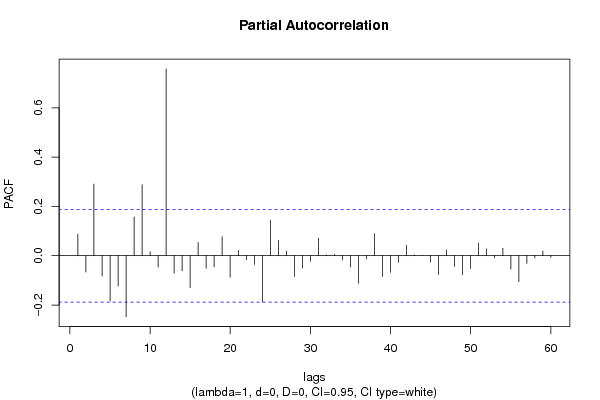
Partial Autocorrelation Function
Time lag kPACF(k)T-STATP-value
10.0872230.90650.183358
2-0.065993-0.68580.247147
30.2907523.02160.00157
4-0.082154-0.85380.197561
5-0.18383-1.91040.029365
6-0.122358-1.27160.103126
7-0.24721-2.56910.005781
80.157371.63540.052434
90.2879222.99220.001716
100.0165320.17180.431954
11-0.045594-0.47380.318291
120.7579487.87680
13-0.070682-0.73450.232104
14-0.061314-0.63720.262672
15-0.12864-1.33690.092037
160.053560.55660.28947
17-0.050921-0.52920.298883
18-0.044965-0.46730.320617
190.0769340.79950.212871
20-0.087286-0.90710.183187
210.0221410.23010.409224
22-0.015917-0.16540.434465
23-0.035565-0.36960.356201
24-0.187543-1.9490.026945
250.1438121.49450.068975
260.0622530.6470.259517
270.0182160.18930.425103
28-0.084139-0.87440.191922
29-0.050135-0.5210.301712
30-0.02268-0.23570.407057
310.0705310.7330.23258
320.0030150.03130.48753
330.0053890.0560.477722
34-0.016811-0.17470.430821
35-0.046042-0.47850.316636
36-0.111481-1.15850.124599
37-0.01289-0.1340.446841
380.088950.92440.178669
39-0.083795-0.87080.192892
40-0.066935-0.69560.244084
41-0.02655-0.27590.39157
420.0427550.44430.32885
430.0033340.03460.486212
440.0001990.00210.499177
45-0.025057-0.26040.397524
46-0.076087-0.79070.215421
470.0228280.23720.40646
48-0.043183-0.44880.327247
49-0.077539-0.80580.211061
50-0.051665-0.53690.296213
510.0520430.54080.294863
520.0280160.29120.385745
53-0.007923-0.08230.467264
540.0298410.31010.378534
55-0.054024-0.56140.287832
56-0.105595-1.09740.13746
57-0.030382-0.31570.376406
58-0.008766-0.09110.463791
590.019520.20290.419814
60-0.006591-0.06850.47276

\begin{tabular}{lllllllll}
\hline
Partial Autocorrelation Function \tabularnewline
Time lag k & PACF(k) & T-STAT & P-value \tabularnewline
1 & 0.087223 & 0.9065 & 0.183358 \tabularnewline
2 & -0.065993 & -0.6858 & 0.247147 \tabularnewline
3 & 0.290752 & 3.0216 & 0.00157 \tabularnewline
4 & -0.082154 & -0.8538 & 0.197561 \tabularnewline
5 & -0.18383 & -1.9104 & 0.029365 \tabularnewline
6 & -0.122358 & -1.2716 & 0.103126 \tabularnewline
7 & -0.24721 & -2.5691 & 0.005781 \tabularnewline
8 & 0.15737 & 1.6354 & 0.052434 \tabularnewline
9 & 0.287922 & 2.9922 & 0.001716 \tabularnewline
10 & 0.016532 & 0.1718 & 0.431954 \tabularnewline
11 & -0.045594 & -0.4738 & 0.318291 \tabularnewline
12 & 0.757948 & 7.8768 & 0 \tabularnewline
13 & -0.070682 & -0.7345 & 0.232104 \tabularnewline
14 & -0.061314 & -0.6372 & 0.262672 \tabularnewline
15 & -0.12864 & -1.3369 & 0.092037 \tabularnewline
16 & 0.05356 & 0.5566 & 0.28947 \tabularnewline
17 & -0.050921 & -0.5292 & 0.298883 \tabularnewline
18 & -0.044965 & -0.4673 & 0.320617 \tabularnewline
19 & 0.076934 & 0.7995 & 0.212871 \tabularnewline
20 & -0.087286 & -0.9071 & 0.183187 \tabularnewline
21 & 0.022141 & 0.2301 & 0.409224 \tabularnewline
22 & -0.015917 & -0.1654 & 0.434465 \tabularnewline
23 & -0.035565 & -0.3696 & 0.356201 \tabularnewline
24 & -0.187543 & -1.949 & 0.026945 \tabularnewline
25 & 0.143812 & 1.4945 & 0.068975 \tabularnewline
26 & 0.062253 & 0.647 & 0.259517 \tabularnewline
27 & 0.018216 & 0.1893 & 0.425103 \tabularnewline
28 & -0.084139 & -0.8744 & 0.191922 \tabularnewline
29 & -0.050135 & -0.521 & 0.301712 \tabularnewline
30 & -0.02268 & -0.2357 & 0.407057 \tabularnewline
31 & 0.070531 & 0.733 & 0.23258 \tabularnewline
32 & 0.003015 & 0.0313 & 0.48753 \tabularnewline
33 & 0.005389 & 0.056 & 0.477722 \tabularnewline
34 & -0.016811 & -0.1747 & 0.430821 \tabularnewline
35 & -0.046042 & -0.4785 & 0.316636 \tabularnewline
36 & -0.111481 & -1.1585 & 0.124599 \tabularnewline
37 & -0.01289 & -0.134 & 0.446841 \tabularnewline
38 & 0.08895 & 0.9244 & 0.178669 \tabularnewline
39 & -0.083795 & -0.8708 & 0.192892 \tabularnewline
40 & -0.066935 & -0.6956 & 0.244084 \tabularnewline
41 & -0.02655 & -0.2759 & 0.39157 \tabularnewline
42 & 0.042755 & 0.4443 & 0.32885 \tabularnewline
43 & 0.003334 & 0.0346 & 0.486212 \tabularnewline
44 & 0.000199 & 0.0021 & 0.499177 \tabularnewline
45 & -0.025057 & -0.2604 & 0.397524 \tabularnewline
46 & -0.076087 & -0.7907 & 0.215421 \tabularnewline
47 & 0.022828 & 0.2372 & 0.40646 \tabularnewline
48 & -0.043183 & -0.4488 & 0.327247 \tabularnewline
49 & -0.077539 & -0.8058 & 0.211061 \tabularnewline
50 & -0.051665 & -0.5369 & 0.296213 \tabularnewline
51 & 0.052043 & 0.5408 & 0.294863 \tabularnewline
52 & 0.028016 & 0.2912 & 0.385745 \tabularnewline
53 & -0.007923 & -0.0823 & 0.467264 \tabularnewline
54 & 0.029841 & 0.3101 & 0.378534 \tabularnewline
55 & -0.054024 & -0.5614 & 0.287832 \tabularnewline
56 & -0.105595 & -1.0974 & 0.13746 \tabularnewline
57 & -0.030382 & -0.3157 & 0.376406 \tabularnewline
58 & -0.008766 & -0.0911 & 0.463791 \tabularnewline
59 & 0.01952 & 0.2029 & 0.419814 \tabularnewline
60 & -0.006591 & -0.0685 & 0.47276 \tabularnewline
\hline
\end{tabular}
%Source: https://freestatistics.org/blog/index.php?pk=124232&T=2

[TABLE]
[ROW][C]Partial Autocorrelation Function[/C][/ROW]
[ROW][C]Time lag k[/C][C]PACF(k)[/C][C]T-STAT[/C][C]P-value[/C][/ROW]
[ROW][C]1[/C][C]0.087223[/C][C]0.9065[/C][C]0.183358[/C][/ROW]
[ROW][C]2[/C][C]-0.065993[/C][C]-0.6858[/C][C]0.247147[/C][/ROW]
[ROW][C]3[/C][C]0.290752[/C][C]3.0216[/C][C]0.00157[/C][/ROW]
[ROW][C]4[/C][C]-0.082154[/C][C]-0.8538[/C][C]0.197561[/C][/ROW]
[ROW][C]5[/C][C]-0.18383[/C][C]-1.9104[/C][C]0.029365[/C][/ROW]
[ROW][C]6[/C][C]-0.122358[/C][C]-1.2716[/C][C]0.103126[/C][/ROW]
[ROW][C]7[/C][C]-0.24721[/C][C]-2.5691[/C][C]0.005781[/C][/ROW]
[ROW][C]8[/C][C]0.15737[/C][C]1.6354[/C][C]0.052434[/C][/ROW]
[ROW][C]9[/C][C]0.287922[/C][C]2.9922[/C][C]0.001716[/C][/ROW]
[ROW][C]10[/C][C]0.016532[/C][C]0.1718[/C][C]0.431954[/C][/ROW]
[ROW][C]11[/C][C]-0.045594[/C][C]-0.4738[/C][C]0.318291[/C][/ROW]
[ROW][C]12[/C][C]0.757948[/C][C]7.8768[/C][C]0[/C][/ROW]
[ROW][C]13[/C][C]-0.070682[/C][C]-0.7345[/C][C]0.232104[/C][/ROW]
[ROW][C]14[/C][C]-0.061314[/C][C]-0.6372[/C][C]0.262672[/C][/ROW]
[ROW][C]15[/C][C]-0.12864[/C][C]-1.3369[/C][C]0.092037[/C][/ROW]
[ROW][C]16[/C][C]0.05356[/C][C]0.5566[/C][C]0.28947[/C][/ROW]
[ROW][C]17[/C][C]-0.050921[/C][C]-0.5292[/C][C]0.298883[/C][/ROW]
[ROW][C]18[/C][C]-0.044965[/C][C]-0.4673[/C][C]0.320617[/C][/ROW]
[ROW][C]19[/C][C]0.076934[/C][C]0.7995[/C][C]0.212871[/C][/ROW]
[ROW][C]20[/C][C]-0.087286[/C][C]-0.9071[/C][C]0.183187[/C][/ROW]
[ROW][C]21[/C][C]0.022141[/C][C]0.2301[/C][C]0.409224[/C][/ROW]
[ROW][C]22[/C][C]-0.015917[/C][C]-0.1654[/C][C]0.434465[/C][/ROW]
[ROW][C]23[/C][C]-0.035565[/C][C]-0.3696[/C][C]0.356201[/C][/ROW]
[ROW][C]24[/C][C]-0.187543[/C][C]-1.949[/C][C]0.026945[/C][/ROW]
[ROW][C]25[/C][C]0.143812[/C][C]1.4945[/C][C]0.068975[/C][/ROW]
[ROW][C]26[/C][C]0.062253[/C][C]0.647[/C][C]0.259517[/C][/ROW]
[ROW][C]27[/C][C]0.018216[/C][C]0.1893[/C][C]0.425103[/C][/ROW]
[ROW][C]28[/C][C]-0.084139[/C][C]-0.8744[/C][C]0.191922[/C][/ROW]
[ROW][C]29[/C][C]-0.050135[/C][C]-0.521[/C][C]0.301712[/C][/ROW]
[ROW][C]30[/C][C]-0.02268[/C][C]-0.2357[/C][C]0.407057[/C][/ROW]
[ROW][C]31[/C][C]0.070531[/C][C]0.733[/C][C]0.23258[/C][/ROW]
[ROW][C]32[/C][C]0.003015[/C][C]0.0313[/C][C]0.48753[/C][/ROW]
[ROW][C]33[/C][C]0.005389[/C][C]0.056[/C][C]0.477722[/C][/ROW]
[ROW][C]34[/C][C]-0.016811[/C][C]-0.1747[/C][C]0.430821[/C][/ROW]
[ROW][C]35[/C][C]-0.046042[/C][C]-0.4785[/C][C]0.316636[/C][/ROW]
[ROW][C]36[/C][C]-0.111481[/C][C]-1.1585[/C][C]0.124599[/C][/ROW]
[ROW][C]37[/C][C]-0.01289[/C][C]-0.134[/C][C]0.446841[/C][/ROW]
[ROW][C]38[/C][C]0.08895[/C][C]0.9244[/C][C]0.178669[/C][/ROW]
[ROW][C]39[/C][C]-0.083795[/C][C]-0.8708[/C][C]0.192892[/C][/ROW]
[ROW][C]40[/C][C]-0.066935[/C][C]-0.6956[/C][C]0.244084[/C][/ROW]
[ROW][C]41[/C][C]-0.02655[/C][C]-0.2759[/C][C]0.39157[/C][/ROW]
[ROW][C]42[/C][C]0.042755[/C][C]0.4443[/C][C]0.32885[/C][/ROW]
[ROW][C]43[/C][C]0.003334[/C][C]0.0346[/C][C]0.486212[/C][/ROW]
[ROW][C]44[/C][C]0.000199[/C][C]0.0021[/C][C]0.499177[/C][/ROW]
[ROW][C]45[/C][C]-0.025057[/C][C]-0.2604[/C][C]0.397524[/C][/ROW]
[ROW][C]46[/C][C]-0.076087[/C][C]-0.7907[/C][C]0.215421[/C][/ROW]
[ROW][C]47[/C][C]0.022828[/C][C]0.2372[/C][C]0.40646[/C][/ROW]
[ROW][C]48[/C][C]-0.043183[/C][C]-0.4488[/C][C]0.327247[/C][/ROW]
[ROW][C]49[/C][C]-0.077539[/C][C]-0.8058[/C][C]0.211061[/C][/ROW]
[ROW][C]50[/C][C]-0.051665[/C][C]-0.5369[/C][C]0.296213[/C][/ROW]
[ROW][C]51[/C][C]0.052043[/C][C]0.5408[/C][C]0.294863[/C][/ROW]
[ROW][C]52[/C][C]0.028016[/C][C]0.2912[/C][C]0.385745[/C][/ROW]
[ROW][C]53[/C][C]-0.007923[/C][C]-0.0823[/C][C]0.467264[/C][/ROW]
[ROW][C]54[/C][C]0.029841[/C][C]0.3101[/C][C]0.378534[/C][/ROW]
[ROW][C]55[/C][C]-0.054024[/C][C]-0.5614[/C][C]0.287832[/C][/ROW]
[ROW][C]56[/C][C]-0.105595[/C][C]-1.0974[/C][C]0.13746[/C][/ROW]
[ROW][C]57[/C][C]-0.030382[/C][C]-0.3157[/C][C]0.376406[/C][/ROW]
[ROW][C]58[/C][C]-0.008766[/C][C]-0.0911[/C][C]0.463791[/C][/ROW]
[ROW][C]59[/C][C]0.01952[/C][C]0.2029[/C][C]0.419814[/C][/ROW]
[ROW][C]60[/C][C]-0.006591[/C][C]-0.0685[/C][C]0.47276[/C][/ROW]
[/TABLE]
Source: https://freestatistics.org/blog/index.php?pk=124232&T=2

Globally Unique Identifier (entire table): ba.freestatistics.org/blog/index.php?pk=124232&T=2

As an alternative you can also use a QR Code:  

The GUIDs for individual cells are displayed in the table below:

Partial Autocorrelation Function
Time lag kPACF(k)T-STATP-value
10.0872230.90650.183358
2-0.065993-0.68580.247147
30.2907523.02160.00157
4-0.082154-0.85380.197561
5-0.18383-1.91040.029365
6-0.122358-1.27160.103126
7-0.24721-2.56910.005781
80.157371.63540.052434
90.2879222.99220.001716
100.0165320.17180.431954
11-0.045594-0.47380.318291
120.7579487.87680
13-0.070682-0.73450.232104
14-0.061314-0.63720.262672
15-0.12864-1.33690.092037
160.053560.55660.28947
17-0.050921-0.52920.298883
18-0.044965-0.46730.320617
190.0769340.79950.212871
20-0.087286-0.90710.183187
210.0221410.23010.409224
22-0.015917-0.16540.434465
23-0.035565-0.36960.356201
24-0.187543-1.9490.026945
250.1438121.49450.068975
260.0622530.6470.259517
270.0182160.18930.425103
28-0.084139-0.87440.191922
29-0.050135-0.5210.301712
30-0.02268-0.23570.407057
310.0705310.7330.23258
320.0030150.03130.48753
330.0053890.0560.477722
34-0.016811-0.17470.430821
35-0.046042-0.47850.316636
36-0.111481-1.15850.124599
37-0.01289-0.1340.446841
380.088950.92440.178669
39-0.083795-0.87080.192892
40-0.066935-0.69560.244084
41-0.02655-0.27590.39157
420.0427550.44430.32885
430.0033340.03460.486212
440.0001990.00210.499177
45-0.025057-0.26040.397524
46-0.076087-0.79070.215421
470.0228280.23720.40646
48-0.043183-0.44880.327247
49-0.077539-0.80580.211061
50-0.051665-0.53690.296213
510.0520430.54080.294863
520.0280160.29120.385745
53-0.007923-0.08230.467264
540.0298410.31010.378534
55-0.054024-0.56140.287832
56-0.105595-1.09740.13746
57-0.030382-0.31570.376406
58-0.008766-0.09110.463791
590.019520.20290.419814
60-0.006591-0.06850.47276


Parameters (Session):
par1 = 60 ; par2 = 1 ; par3 = 0 ; par4 = 0 ; par5 = 12 ; par6 = White Noise ; par7 = 0.95 ;
Parameters (R input):
par1 = 60 ; par2 = 1 ; par3 = 0 ; par4 = 0 ; par5 = 12 ; par6 = White Noise ; par7 = 0.95 ; par8 = ;
R code (references can be found in the software module):
if (par1 == 'Default') {
par1 = 10*log10(length(x))
} else {
par1 <- as.numeric(par1)
}
par2 <- as.numeric(par2)
par3 <- as.numeric(par3)
par4 <- as.numeric(par4)
par5 <- as.numeric(par5)
if (par6 == 'White Noise') par6 <- 'white' else par6 <- 'ma'
par7 <- as.numeric(par7)
if (par8 != '') par8 <- as.numeric(par8)
ox <- x
if (par8 == '') {
if (par2 == 0) {
x <- log(x)
} else {
x <- (x ^ par2 - 1) / par2
}
} else {
x <- log(x,base=par8)
}
if (par3 > 0) x <- diff(x,lag=1,difference=par3)
if (par4 > 0) x <- diff(x,lag=par5,difference=par4)
bitmap(file='picts.png')
op <- par(mfrow=c(2,1))
plot(ox,type='l',main='Original Time Series',xlab='time',ylab='value')
if (par8=='') {
mytitle <- paste('Working Time Series (lambda=',par2,', d=',par3,', D=',par4,')',sep='')
mysub <- paste('(lambda=',par2,', d=',par3,', D=',par4,', CI=', par7, ', CI type=',par6,')',sep='')
} else {
mytitle <- paste('Working Time Series (base=',par8,', d=',par3,', D=',par4,')',sep='')
mysub <- paste('(base=',par8,', d=',par3,', D=',par4,', CI=', par7, ', CI type=',par6,')',sep='')
}
plot(x,type='l', main=mytitle,xlab='time',ylab='value')
par(op)
dev.off()
bitmap(file='pic1.png')
racf <- acf(x, par1, main='Autocorrelation', xlab='time lag', ylab='ACF', ci.type=par6, ci=par7, sub=mysub)
dev.off()
bitmap(file='pic2.png')
rpacf <- pacf(x,par1,main='Partial Autocorrelation',xlab='lags',ylab='PACF',sub=mysub)
dev.off()
(myacf <- c(racf$acf))
(mypacf <- c(rpacf$acf))
lengthx <- length(x)
sqrtn <- sqrt(lengthx)
load(file='createtable')
a<-table.start()
a<-table.row.start(a)
a<-table.element(a,'Autocorrelation Function',4,TRUE)
a<-table.row.end(a)
a<-table.row.start(a)
a<-table.element(a,'Time lag k',header=TRUE)
a<-table.element(a,hyperlink('basics.htm','ACF(k)','click here for more information about the Autocorrelation Function'),header=TRUE)
a<-table.element(a,'T-STAT',header=TRUE)
a<-table.element(a,'P-value',header=TRUE)
a<-table.row.end(a)
for (i in 2:(par1+1)) {
a<-table.row.start(a)
a<-table.element(a,i-1,header=TRUE)
a<-table.element(a,round(myacf[i],6))
mytstat <- myacf[i]*sqrtn
a<-table.element(a,round(mytstat,4))
a<-table.element(a,round(1-pt(abs(mytstat),lengthx),6))
a<-table.row.end(a)
}
a<-table.end(a)
table.save(a,file='mytable.tab')
a<-table.start()
a<-table.row.start(a)
a<-table.element(a,'Partial Autocorrelation Function',4,TRUE)
a<-table.row.end(a)
a<-table.row.start(a)
a<-table.element(a,'Time lag k',header=TRUE)
a<-table.element(a,hyperlink('basics.htm','PACF(k)','click here for more information about the Partial Autocorrelation Function'),header=TRUE)
a<-table.element(a,'T-STAT',header=TRUE)
a<-table.element(a,'P-value',header=TRUE)
a<-table.row.end(a)
for (i in 1:par1) {
a<-table.row.start(a)
a<-table.element(a,i,header=TRUE)
a<-table.element(a,round(mypacf[i],6))
mytstat <- mypacf[i]*sqrtn
a<-table.element(a,round(mytstat,4))
a<-table.element(a,round(1-pt(abs(mytstat),lengthx),6))
a<-table.row.end(a)
}
a<-table.end(a)
table.save(a,file='mytable1.tab')