Free Statistics

of Irreproducible Research!

Author's title

Author*Unverified author*
R Software Modulerwasp_smp.wasp
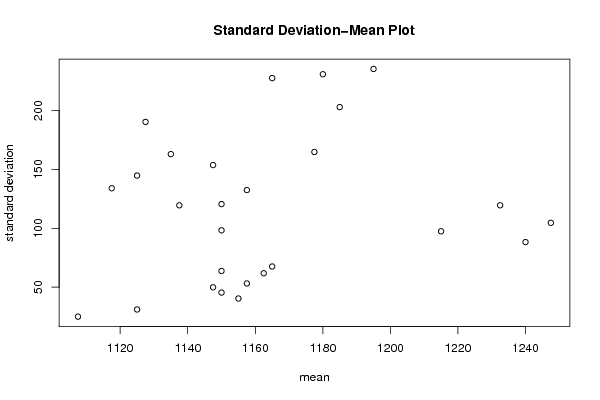
Title produced by softwareStandard Deviation-Mean Plot
Date of computationSat, 20 Aug 2011 15:00:54 -0400
Cite this page as followsStatistical Computations at FreeStatistics.org, Office for Research Development and Education, URL https://freestatistics.org/blog/index.php?v=date/2011/Aug/20/t1313866891yn63i2nkga0r6yg.htm/, Retrieved Wed, 15 May 2024 23:10:09 +0000
Statistical Computations at FreeStatistics.org, Office for Research Development and Education, URL https://freestatistics.org/blog/index.php?pk=124214, Retrieved Wed, 15 May 2024 23:10:09 +0000
QR Codes:

Original text written by user:
IsPrivate?No (this computation is public)
User-defined keywordsSergeyssels Ivan
Estimated Impact208
Family? (F = Feedback message, R = changed R code, M = changed R Module, P = changed Parameters, D = changed Data)
-       [Standard Deviation-Mean Plot] [Tijdreeks B - Sta...] [2011-08-20 19:00:54] [bc909d11ab9ae813672fa3903785080c] [Current]
Feedback Forum

Post a new message
Dataseries X:
1120
1120
1190
1190
1190
1190
1070
1200
1090
1130
1140
1240
1180
1080
1190
1140
1160
1200
980
1260
1100
1210
1150
1140
1110
1120
1100
1170
1120
1250
910
1260
1090
1240
1130
1200
1120
1120
1120
1070
1100
1230
930
1240
980
1270
1140
1160
1160
1220
1160
1090
1060
1230
1070
1240
1050
1350
1100
1130
1170
1360
1150
1180
1010
1190
1000
1270
990
1470
1130
1150
1150
1410
1190
1180
990
1170
1080
1350
960
1490
1120
1090
1220
1370
1180
1190
1000
1250
1090
1370
980
1530
1150
1120
1290
1370
1130
1200
910
1220
1040
1340
950
1500
1120
1150


Summary of computational transaction
Raw Inputview raw input (R code)
Raw Outputview raw output of R engine
Computing time1 seconds
R Server'Gwilym Jenkins' @ jenkins.wessa.net

\begin{tabular}{lllllllll}
\hline
Summary of computational transaction \tabularnewline
Raw Input & view raw input (R code)  \tabularnewline
Raw Output & view raw output of R engine  \tabularnewline
Computing time & 1 seconds \tabularnewline
R Server & 'Gwilym Jenkins' @ jenkins.wessa.net \tabularnewline
\hline
\end{tabular}
%Source: https://freestatistics.org/blog/index.php?pk=124214&T=0

[TABLE]
[ROW][C]Summary of computational transaction[/C][/ROW]
[ROW][C]Raw Input[/C][C]view raw input (R code) [/C][/ROW]
[ROW][C]Raw Output[/C][C]view raw output of R engine [/C][/ROW]
[ROW][C]Computing time[/C][C]1 seconds[/C][/ROW]
[ROW][C]R Server[/C][C]'Gwilym Jenkins' @ jenkins.wessa.net[/C][/ROW]
[/TABLE]
Source: https://freestatistics.org/blog/index.php?pk=124214&T=0

Globally Unique Identifier (entire table): ba.freestatistics.org/blog/index.php?pk=124214&T=0

As an alternative you can also use a QR Code:  

The GUIDs for individual cells are displayed in the table below:

Summary of computational transaction
Raw Inputview raw input (R code)
Raw Outputview raw output of R engine
Computing time1 seconds
R Server'Gwilym Jenkins' @ jenkins.wessa.net


Standard Deviation-Mean Plot
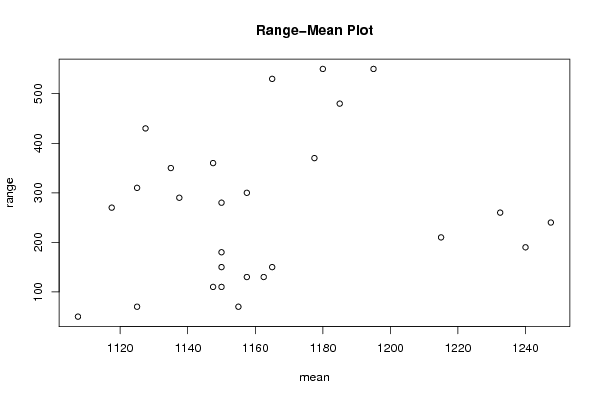
SectionMeanStandard DeviationRange
1115540.414518843273870
21162.561.8465843842649130
3115063.7704215656966150
41147.549.9165971062398110
51150120.554275466834280
6115045.4606056566195110
7112531.09126351029670
81135162.992842378635350
9116567.5771164423776150
101107.52550
111125144.798710859823310
121137.5119.547758936195290
131157.553.1507290636732130
14115098.3192080250175180
151157.5132.507861402006300
16121597.4679434480896210
171117.5134.008706184835270
181185202.895703913776480
191232.5119.547758936195260
201147.5153.704261489394360
211165227.522892621087530
22124088.3176086632785190
231177.5164.797855973108370
241195235.301225382841550
251247.5104.682058316281240
261127.5190.328663106743430
271180230.79572497485550

\begin{tabular}{lllllllll}
\hline
Standard Deviation-Mean Plot \tabularnewline
Section & Mean & Standard Deviation & Range \tabularnewline
1 & 1155 & 40.4145188432738 & 70 \tabularnewline
2 & 1162.5 & 61.8465843842649 & 130 \tabularnewline
3 & 1150 & 63.7704215656966 & 150 \tabularnewline
4 & 1147.5 & 49.9165971062398 & 110 \tabularnewline
5 & 1150 & 120.554275466834 & 280 \tabularnewline
6 & 1150 & 45.4606056566195 & 110 \tabularnewline
7 & 1125 & 31.091263510296 & 70 \tabularnewline
8 & 1135 & 162.992842378635 & 350 \tabularnewline
9 & 1165 & 67.5771164423776 & 150 \tabularnewline
10 & 1107.5 & 25 & 50 \tabularnewline
11 & 1125 & 144.798710859823 & 310 \tabularnewline
12 & 1137.5 & 119.547758936195 & 290 \tabularnewline
13 & 1157.5 & 53.1507290636732 & 130 \tabularnewline
14 & 1150 & 98.3192080250175 & 180 \tabularnewline
15 & 1157.5 & 132.507861402006 & 300 \tabularnewline
16 & 1215 & 97.4679434480896 & 210 \tabularnewline
17 & 1117.5 & 134.008706184835 & 270 \tabularnewline
18 & 1185 & 202.895703913776 & 480 \tabularnewline
19 & 1232.5 & 119.547758936195 & 260 \tabularnewline
20 & 1147.5 & 153.704261489394 & 360 \tabularnewline
21 & 1165 & 227.522892621087 & 530 \tabularnewline
22 & 1240 & 88.3176086632785 & 190 \tabularnewline
23 & 1177.5 & 164.797855973108 & 370 \tabularnewline
24 & 1195 & 235.301225382841 & 550 \tabularnewline
25 & 1247.5 & 104.682058316281 & 240 \tabularnewline
26 & 1127.5 & 190.328663106743 & 430 \tabularnewline
27 & 1180 & 230.79572497485 & 550 \tabularnewline
\hline
\end{tabular}
%Source: https://freestatistics.org/blog/index.php?pk=124214&T=1

[TABLE]
[ROW][C]Standard Deviation-Mean Plot[/C][/ROW]
[ROW][C]Section[/C][C]Mean[/C][C]Standard Deviation[/C][C]Range[/C][/ROW]
[ROW][C]1[/C][C]1155[/C][C]40.4145188432738[/C][C]70[/C][/ROW]
[ROW][C]2[/C][C]1162.5[/C][C]61.8465843842649[/C][C]130[/C][/ROW]
[ROW][C]3[/C][C]1150[/C][C]63.7704215656966[/C][C]150[/C][/ROW]
[ROW][C]4[/C][C]1147.5[/C][C]49.9165971062398[/C][C]110[/C][/ROW]
[ROW][C]5[/C][C]1150[/C][C]120.554275466834[/C][C]280[/C][/ROW]
[ROW][C]6[/C][C]1150[/C][C]45.4606056566195[/C][C]110[/C][/ROW]
[ROW][C]7[/C][C]1125[/C][C]31.091263510296[/C][C]70[/C][/ROW]
[ROW][C]8[/C][C]1135[/C][C]162.992842378635[/C][C]350[/C][/ROW]
[ROW][C]9[/C][C]1165[/C][C]67.5771164423776[/C][C]150[/C][/ROW]
[ROW][C]10[/C][C]1107.5[/C][C]25[/C][C]50[/C][/ROW]
[ROW][C]11[/C][C]1125[/C][C]144.798710859823[/C][C]310[/C][/ROW]
[ROW][C]12[/C][C]1137.5[/C][C]119.547758936195[/C][C]290[/C][/ROW]
[ROW][C]13[/C][C]1157.5[/C][C]53.1507290636732[/C][C]130[/C][/ROW]
[ROW][C]14[/C][C]1150[/C][C]98.3192080250175[/C][C]180[/C][/ROW]
[ROW][C]15[/C][C]1157.5[/C][C]132.507861402006[/C][C]300[/C][/ROW]
[ROW][C]16[/C][C]1215[/C][C]97.4679434480896[/C][C]210[/C][/ROW]
[ROW][C]17[/C][C]1117.5[/C][C]134.008706184835[/C][C]270[/C][/ROW]
[ROW][C]18[/C][C]1185[/C][C]202.895703913776[/C][C]480[/C][/ROW]
[ROW][C]19[/C][C]1232.5[/C][C]119.547758936195[/C][C]260[/C][/ROW]
[ROW][C]20[/C][C]1147.5[/C][C]153.704261489394[/C][C]360[/C][/ROW]
[ROW][C]21[/C][C]1165[/C][C]227.522892621087[/C][C]530[/C][/ROW]
[ROW][C]22[/C][C]1240[/C][C]88.3176086632785[/C][C]190[/C][/ROW]
[ROW][C]23[/C][C]1177.5[/C][C]164.797855973108[/C][C]370[/C][/ROW]
[ROW][C]24[/C][C]1195[/C][C]235.301225382841[/C][C]550[/C][/ROW]
[ROW][C]25[/C][C]1247.5[/C][C]104.682058316281[/C][C]240[/C][/ROW]
[ROW][C]26[/C][C]1127.5[/C][C]190.328663106743[/C][C]430[/C][/ROW]
[ROW][C]27[/C][C]1180[/C][C]230.79572497485[/C][C]550[/C][/ROW]
[/TABLE]
Source: https://freestatistics.org/blog/index.php?pk=124214&T=1

Globally Unique Identifier (entire table): ba.freestatistics.org/blog/index.php?pk=124214&T=1

As an alternative you can also use a QR Code:  

The GUIDs for individual cells are displayed in the table below:

Standard Deviation-Mean Plot
SectionMeanStandard DeviationRange
1115540.414518843273870
21162.561.8465843842649130
3115063.7704215656966150
41147.549.9165971062398110
51150120.554275466834280
6115045.4606056566195110
7112531.09126351029670
81135162.992842378635350
9116567.5771164423776150
101107.52550
111125144.798710859823310
121137.5119.547758936195290
131157.553.1507290636732130
14115098.3192080250175180
151157.5132.507861402006300
16121597.4679434480896210
171117.5134.008706184835270
181185202.895703913776480
191232.5119.547758936195260
201147.5153.704261489394360
211165227.522892621087530
22124088.3176086632785190
231177.5164.797855973108370
241195235.301225382841550
251247.5104.682058316281240
261127.5190.328663106743430
271180230.79572497485550


Regression: S.E.(k) = alpha + beta * Mean(k)
alpha-222.482112298193
beta0.292097943916658
S.D.0.342324435135056
T-STAT0.853278100937837
p-value0.401606844454787

\begin{tabular}{lllllllll}
\hline
Regression: S.E.(k) = alpha + beta * Mean(k) \tabularnewline
alpha & -222.482112298193 \tabularnewline
beta & 0.292097943916658 \tabularnewline
S.D. & 0.342324435135056 \tabularnewline
T-STAT & 0.853278100937837 \tabularnewline
p-value & 0.401606844454787 \tabularnewline
\hline
\end{tabular}
%Source: https://freestatistics.org/blog/index.php?pk=124214&T=2

[TABLE]
[ROW][C]Regression: S.E.(k) = alpha + beta * Mean(k)[/C][/ROW]
[ROW][C]alpha[/C][C]-222.482112298193[/C][/ROW]
[ROW][C]beta[/C][C]0.292097943916658[/C][/ROW]
[ROW][C]S.D.[/C][C]0.342324435135056[/C][/ROW]
[ROW][C]T-STAT[/C][C]0.853278100937837[/C][/ROW]
[ROW][C]p-value[/C][C]0.401606844454787[/C][/ROW]
[/TABLE]
Source: https://freestatistics.org/blog/index.php?pk=124214&T=2

Globally Unique Identifier (entire table): ba.freestatistics.org/blog/index.php?pk=124214&T=2

As an alternative you can also use a QR Code:  

The GUIDs for individual cells are displayed in the table below:

Regression: S.E.(k) = alpha + beta * Mean(k)
alpha-222.482112298193
beta0.292097943916658
S.D.0.342324435135056
T-STAT0.853278100937837
p-value0.401606844454787


Regression: ln S.E.(k) = alpha + beta * ln Mean(k)
alpha-32.2880412460375
beta5.22553898369273
S.D.3.92800421203447
T-STAT1.33032927197046
p-value0.195418666814882
Lambda-4.22553898369273

\begin{tabular}{lllllllll}
\hline
Regression: ln S.E.(k) = alpha + beta * ln Mean(k) \tabularnewline
alpha & -32.2880412460375 \tabularnewline
beta & 5.22553898369273 \tabularnewline
S.D. & 3.92800421203447 \tabularnewline
T-STAT & 1.33032927197046 \tabularnewline
p-value & 0.195418666814882 \tabularnewline
Lambda & -4.22553898369273 \tabularnewline
\hline
\end{tabular}
%Source: https://freestatistics.org/blog/index.php?pk=124214&T=3

[TABLE]
[ROW][C]Regression: ln S.E.(k) = alpha + beta * ln Mean(k)[/C][/ROW]
[ROW][C]alpha[/C][C]-32.2880412460375[/C][/ROW]
[ROW][C]beta[/C][C]5.22553898369273[/C][/ROW]
[ROW][C]S.D.[/C][C]3.92800421203447[/C][/ROW]
[ROW][C]T-STAT[/C][C]1.33032927197046[/C][/ROW]
[ROW][C]p-value[/C][C]0.195418666814882[/C][/ROW]
[ROW][C]Lambda[/C][C]-4.22553898369273[/C][/ROW]
[/TABLE]
Source: https://freestatistics.org/blog/index.php?pk=124214&T=3

Globally Unique Identifier (entire table): ba.freestatistics.org/blog/index.php?pk=124214&T=3

As an alternative you can also use a QR Code:  

The GUIDs for individual cells are displayed in the table below:

Regression: ln S.E.(k) = alpha + beta * ln Mean(k)
alpha-32.2880412460375
beta5.22553898369273
S.D.3.92800421203447
T-STAT1.33032927197046
p-value0.195418666814882
Lambda-4.22553898369273


Parameters (Session):
par1 = 4 ;
Parameters (R input):
par1 = 4 ;
R code (references can be found in the software module):
par1 <- as.numeric(par1)
(n <- length(x))
(np <- floor(n / par1))
arr <- array(NA,dim=c(par1,np))
j <- 0
k <- 1
for (i in 1:(np*par1))
{
j = j + 1
arr[j,k] <- x[i]
if (j == par1) {
j = 0
k=k+1
}
}
arr
arr.mean <- array(NA,dim=np)
arr.sd <- array(NA,dim=np)
arr.range <- array(NA,dim=np)
for (j in 1:np)
{
arr.mean[j] <- mean(arr[,j],na.rm=TRUE)
arr.sd[j] <- sd(arr[,j],na.rm=TRUE)
arr.range[j] <- max(arr[,j],na.rm=TRUE) - min(arr[,j],na.rm=TRUE)
}
arr.mean
arr.sd
arr.range
(lm1 <- lm(arr.sd~arr.mean))
(lnlm1 <- lm(log(arr.sd)~log(arr.mean)))
(lm2 <- lm(arr.range~arr.mean))
bitmap(file='test1.png')
plot(arr.mean,arr.sd,main='Standard Deviation-Mean Plot',xlab='mean',ylab='standard deviation')
dev.off()
bitmap(file='test2.png')
plot(arr.mean,arr.range,main='Range-Mean Plot',xlab='mean',ylab='range')
dev.off()
load(file='createtable')
a<-table.start()
a<-table.row.start(a)
a<-table.element(a,'Standard Deviation-Mean Plot',4,TRUE)
a<-table.row.end(a)
a<-table.row.start(a)
a<-table.element(a,'Section',header=TRUE)
a<-table.element(a,'Mean',header=TRUE)
a<-table.element(a,'Standard Deviation',header=TRUE)
a<-table.element(a,'Range',header=TRUE)
a<-table.row.end(a)
for (j in 1:np) {
a<-table.row.start(a)
a<-table.element(a,j,header=TRUE)
a<-table.element(a,arr.mean[j])
a<-table.element(a,arr.sd[j] )
a<-table.element(a,arr.range[j] )
a<-table.row.end(a)
}
a<-table.end(a)
table.save(a,file='mytable.tab')
a<-table.start()
a<-table.row.start(a)
a<-table.element(a,'Regression: S.E.(k) = alpha + beta * Mean(k)',2,TRUE)
a<-table.row.end(a)
a<-table.row.start(a)
a<-table.element(a,'alpha',header=TRUE)
a<-table.element(a,lm1$coefficients[[1]])
a<-table.row.end(a)
a<-table.row.start(a)
a<-table.element(a,'beta',header=TRUE)
a<-table.element(a,lm1$coefficients[[2]])
a<-table.row.end(a)
a<-table.row.start(a)
a<-table.element(a,'S.D.',header=TRUE)
a<-table.element(a,summary(lm1)$coefficients[2,2])
a<-table.row.end(a)
a<-table.row.start(a)
a<-table.element(a,'T-STAT',header=TRUE)
a<-table.element(a,summary(lm1)$coefficients[2,3])
a<-table.row.end(a)
a<-table.row.start(a)
a<-table.element(a,'p-value',header=TRUE)
a<-table.element(a,summary(lm1)$coefficients[2,4])
a<-table.row.end(a)
a<-table.end(a)
table.save(a,file='mytable1.tab')
a<-table.start()
a<-table.row.start(a)
a<-table.element(a,'Regression: ln S.E.(k) = alpha + beta * ln Mean(k)',2,TRUE)
a<-table.row.end(a)
a<-table.row.start(a)
a<-table.element(a,'alpha',header=TRUE)
a<-table.element(a,lnlm1$coefficients[[1]])
a<-table.row.end(a)
a<-table.row.start(a)
a<-table.element(a,'beta',header=TRUE)
a<-table.element(a,lnlm1$coefficients[[2]])
a<-table.row.end(a)
a<-table.row.start(a)
a<-table.element(a,'S.D.',header=TRUE)
a<-table.element(a,summary(lnlm1)$coefficients[2,2])
a<-table.row.end(a)
a<-table.row.start(a)
a<-table.element(a,'T-STAT',header=TRUE)
a<-table.element(a,summary(lnlm1)$coefficients[2,3])
a<-table.row.end(a)
a<-table.row.start(a)
a<-table.element(a,'p-value',header=TRUE)
a<-table.element(a,summary(lnlm1)$coefficients[2,4])
a<-table.row.end(a)
a<-table.row.start(a)
a<-table.element(a,'Lambda',header=TRUE)
a<-table.element(a,1-lnlm1$coefficients[[2]])
a<-table.row.end(a)
a<-table.end(a)
table.save(a,file='mytable2.tab')