Free Statistics

of Irreproducible Research!

Author's title

Author*Unverified author*
R Software Modulerwasp_autocorrelation.wasp
Title produced by software(Partial) Autocorrelation Function
Date of computationFri, 19 Aug 2011 03:02:49 -0400
Cite this page as followsStatistical Computations at FreeStatistics.org, Office for Research Development and Education, URL https://freestatistics.org/blog/index.php?v=date/2011/Aug/19/t1313738072hf2vopn4tu2pg2n.htm/, Retrieved Tue, 14 May 2024 17:04:50 +0000
Statistical Computations at FreeStatistics.org, Office for Research Development and Education, URL https://freestatistics.org/blog/index.php?pk=124191, Retrieved Tue, 14 May 2024 17:04:50 +0000
QR Codes:

Original text written by user:
IsPrivate?No (this computation is public)
User-defined keywordsVan Tongelen Caroline
Estimated Impact176
Family? (F = Feedback message, R = changed R code, M = changed R Module, P = changed Parameters, D = changed Data)
-       [(Partial) Autocorrelation Function] [TIJDREEKS B - STA...] [2011-08-19 07:02:49] [7d6606cca1b3596736d7d387043cb02b] [Current]
Feedback Forum

Post a new message
Dataseries X:
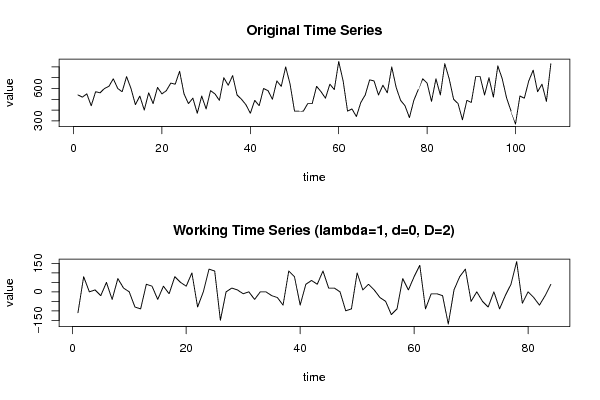
540
520
550
440
570
560
600
620
690
600
570
710
600
450
530
400
560
460
610
550
580
650
640
760
550
460
510
370
530
410
580
550
490
700
630
720
540
500
450
370
490
440
600
580
500
670
620
800
640
390
390
390
460
460
620
570
510
640
590
850
670
390
410
340
470
540
680
670
540
630
560
800
610
490
440
330
490
590
690
650
480
690
540
830
690
500
460
310
490
470
710
710
540
700
520
810
690
510
390
270
530
510
670
770
570
640
480
830


Summary of computational transaction
Raw Inputview raw input (R code)
Raw Outputview raw output of R engine
Computing time2 seconds
R Server'Herman Ole Andreas Wold' @ wold.wessa.net

\begin{tabular}{lllllllll}
\hline
Summary of computational transaction \tabularnewline
Raw Input & view raw input (R code)  \tabularnewline
Raw Output & view raw output of R engine  \tabularnewline
Computing time & 2 seconds \tabularnewline
R Server & 'Herman Ole Andreas Wold' @ wold.wessa.net \tabularnewline
\hline
\end{tabular}
%Source: https://freestatistics.org/blog/index.php?pk=124191&T=0

[TABLE]
[ROW][C]Summary of computational transaction[/C][/ROW]
[ROW][C]Raw Input[/C][C]view raw input (R code) [/C][/ROW]
[ROW][C]Raw Output[/C][C]view raw output of R engine [/C][/ROW]
[ROW][C]Computing time[/C][C]2 seconds[/C][/ROW]
[ROW][C]R Server[/C][C]'Herman Ole Andreas Wold' @ wold.wessa.net[/C][/ROW]
[/TABLE]
Source: https://freestatistics.org/blog/index.php?pk=124191&T=0

Globally Unique Identifier (entire table): ba.freestatistics.org/blog/index.php?pk=124191&T=0

As an alternative you can also use a QR Code:  

The GUIDs for individual cells are displayed in the table below:

Summary of computational transaction
Raw Inputview raw input (R code)
Raw Outputview raw output of R engine
Computing time2 seconds
R Server'Herman Ole Andreas Wold' @ wold.wessa.net


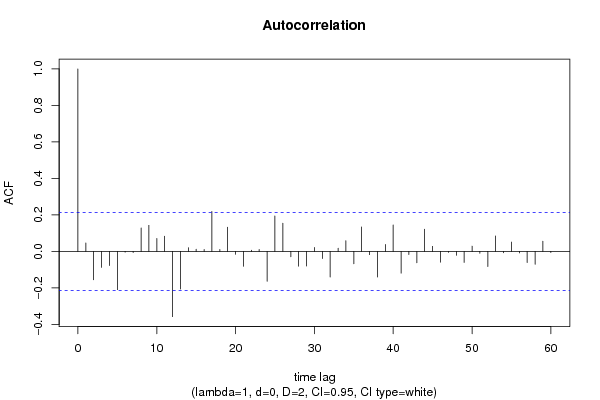
Autocorrelation Function
Time lag kACF(k)T-STATP-value
10.0462280.42370.336438
2-0.155225-1.42270.079269
3-0.087582-0.80270.212206
4-0.077097-0.70660.240885
5-0.20962-1.92120.029049
6-0.004009-0.03670.485387
7-0.00564-0.05170.47945
80.1285611.17830.121006
90.1425651.30660.097453
100.0708180.64910.259036
110.0834370.76470.223293
12-0.357657-3.2780.000761
13-0.206237-1.89020.03109
140.0196270.17990.428839
150.0121150.1110.455926
160.0108720.09960.460432
170.218662.00410.024143
180.0101920.09340.462899
190.1326141.21540.113805
20-0.015383-0.1410.444109
21-0.081106-0.74340.229671
220.0060160.05510.47808
230.01040.09530.462146
24-0.163273-1.49640.069146
250.193831.77650.039637
260.1546581.41750.080024
27-0.029044-0.26620.395372
28-0.080883-0.74130.230287
29-0.080547-0.73820.231219
300.0217660.19950.421181
31-0.038633-0.35410.362085
32-0.140798-1.29040.100221
330.0171720.15740.437662
340.0581790.53320.297645
35-0.067327-0.61710.269433
360.1341331.22930.111187
37-0.017772-0.16290.435501
38-0.140511-1.28780.100675
390.0375290.3440.365869
400.1451691.33050.093478
41-0.119358-1.09390.138556
42-0.016919-0.15510.438569
43-0.062776-0.57540.283295
440.1218121.11640.133711
450.027760.25440.399893
46-0.058805-0.5390.295671
47-0.005229-0.04790.480946
48-0.021262-0.19490.422981
49-0.060089-0.55070.291642
500.0287860.26380.396279
51-0.009773-0.08960.46442
52-0.082574-0.75680.225643
530.0848890.7780.219371
54-0.007759-0.07110.471738
550.0509370.46680.320909
56-0.008203-0.07520.470125
57-0.060571-0.55510.290137
58-0.070865-0.64950.258899
590.0559690.5130.304662
60-0.005645-0.05170.479432

\begin{tabular}{lllllllll}
\hline
Autocorrelation Function \tabularnewline
Time lag k & ACF(k) & T-STAT & P-value \tabularnewline
1 & 0.046228 & 0.4237 & 0.336438 \tabularnewline
2 & -0.155225 & -1.4227 & 0.079269 \tabularnewline
3 & -0.087582 & -0.8027 & 0.212206 \tabularnewline
4 & -0.077097 & -0.7066 & 0.240885 \tabularnewline
5 & -0.20962 & -1.9212 & 0.029049 \tabularnewline
6 & -0.004009 & -0.0367 & 0.485387 \tabularnewline
7 & -0.00564 & -0.0517 & 0.47945 \tabularnewline
8 & 0.128561 & 1.1783 & 0.121006 \tabularnewline
9 & 0.142565 & 1.3066 & 0.097453 \tabularnewline
10 & 0.070818 & 0.6491 & 0.259036 \tabularnewline
11 & 0.083437 & 0.7647 & 0.223293 \tabularnewline
12 & -0.357657 & -3.278 & 0.000761 \tabularnewline
13 & -0.206237 & -1.8902 & 0.03109 \tabularnewline
14 & 0.019627 & 0.1799 & 0.428839 \tabularnewline
15 & 0.012115 & 0.111 & 0.455926 \tabularnewline
16 & 0.010872 & 0.0996 & 0.460432 \tabularnewline
17 & 0.21866 & 2.0041 & 0.024143 \tabularnewline
18 & 0.010192 & 0.0934 & 0.462899 \tabularnewline
19 & 0.132614 & 1.2154 & 0.113805 \tabularnewline
20 & -0.015383 & -0.141 & 0.444109 \tabularnewline
21 & -0.081106 & -0.7434 & 0.229671 \tabularnewline
22 & 0.006016 & 0.0551 & 0.47808 \tabularnewline
23 & 0.0104 & 0.0953 & 0.462146 \tabularnewline
24 & -0.163273 & -1.4964 & 0.069146 \tabularnewline
25 & 0.19383 & 1.7765 & 0.039637 \tabularnewline
26 & 0.154658 & 1.4175 & 0.080024 \tabularnewline
27 & -0.029044 & -0.2662 & 0.395372 \tabularnewline
28 & -0.080883 & -0.7413 & 0.230287 \tabularnewline
29 & -0.080547 & -0.7382 & 0.231219 \tabularnewline
30 & 0.021766 & 0.1995 & 0.421181 \tabularnewline
31 & -0.038633 & -0.3541 & 0.362085 \tabularnewline
32 & -0.140798 & -1.2904 & 0.100221 \tabularnewline
33 & 0.017172 & 0.1574 & 0.437662 \tabularnewline
34 & 0.058179 & 0.5332 & 0.297645 \tabularnewline
35 & -0.067327 & -0.6171 & 0.269433 \tabularnewline
36 & 0.134133 & 1.2293 & 0.111187 \tabularnewline
37 & -0.017772 & -0.1629 & 0.435501 \tabularnewline
38 & -0.140511 & -1.2878 & 0.100675 \tabularnewline
39 & 0.037529 & 0.344 & 0.365869 \tabularnewline
40 & 0.145169 & 1.3305 & 0.093478 \tabularnewline
41 & -0.119358 & -1.0939 & 0.138556 \tabularnewline
42 & -0.016919 & -0.1551 & 0.438569 \tabularnewline
43 & -0.062776 & -0.5754 & 0.283295 \tabularnewline
44 & 0.121812 & 1.1164 & 0.133711 \tabularnewline
45 & 0.02776 & 0.2544 & 0.399893 \tabularnewline
46 & -0.058805 & -0.539 & 0.295671 \tabularnewline
47 & -0.005229 & -0.0479 & 0.480946 \tabularnewline
48 & -0.021262 & -0.1949 & 0.422981 \tabularnewline
49 & -0.060089 & -0.5507 & 0.291642 \tabularnewline
50 & 0.028786 & 0.2638 & 0.396279 \tabularnewline
51 & -0.009773 & -0.0896 & 0.46442 \tabularnewline
52 & -0.082574 & -0.7568 & 0.225643 \tabularnewline
53 & 0.084889 & 0.778 & 0.219371 \tabularnewline
54 & -0.007759 & -0.0711 & 0.471738 \tabularnewline
55 & 0.050937 & 0.4668 & 0.320909 \tabularnewline
56 & -0.008203 & -0.0752 & 0.470125 \tabularnewline
57 & -0.060571 & -0.5551 & 0.290137 \tabularnewline
58 & -0.070865 & -0.6495 & 0.258899 \tabularnewline
59 & 0.055969 & 0.513 & 0.304662 \tabularnewline
60 & -0.005645 & -0.0517 & 0.479432 \tabularnewline
\hline
\end{tabular}
%Source: https://freestatistics.org/blog/index.php?pk=124191&T=1

[TABLE]
[ROW][C]Autocorrelation Function[/C][/ROW]
[ROW][C]Time lag k[/C][C]ACF(k)[/C][C]T-STAT[/C][C]P-value[/C][/ROW]
[ROW][C]1[/C][C]0.046228[/C][C]0.4237[/C][C]0.336438[/C][/ROW]
[ROW][C]2[/C][C]-0.155225[/C][C]-1.4227[/C][C]0.079269[/C][/ROW]
[ROW][C]3[/C][C]-0.087582[/C][C]-0.8027[/C][C]0.212206[/C][/ROW]
[ROW][C]4[/C][C]-0.077097[/C][C]-0.7066[/C][C]0.240885[/C][/ROW]
[ROW][C]5[/C][C]-0.20962[/C][C]-1.9212[/C][C]0.029049[/C][/ROW]
[ROW][C]6[/C][C]-0.004009[/C][C]-0.0367[/C][C]0.485387[/C][/ROW]
[ROW][C]7[/C][C]-0.00564[/C][C]-0.0517[/C][C]0.47945[/C][/ROW]
[ROW][C]8[/C][C]0.128561[/C][C]1.1783[/C][C]0.121006[/C][/ROW]
[ROW][C]9[/C][C]0.142565[/C][C]1.3066[/C][C]0.097453[/C][/ROW]
[ROW][C]10[/C][C]0.070818[/C][C]0.6491[/C][C]0.259036[/C][/ROW]
[ROW][C]11[/C][C]0.083437[/C][C]0.7647[/C][C]0.223293[/C][/ROW]
[ROW][C]12[/C][C]-0.357657[/C][C]-3.278[/C][C]0.000761[/C][/ROW]
[ROW][C]13[/C][C]-0.206237[/C][C]-1.8902[/C][C]0.03109[/C][/ROW]
[ROW][C]14[/C][C]0.019627[/C][C]0.1799[/C][C]0.428839[/C][/ROW]
[ROW][C]15[/C][C]0.012115[/C][C]0.111[/C][C]0.455926[/C][/ROW]
[ROW][C]16[/C][C]0.010872[/C][C]0.0996[/C][C]0.460432[/C][/ROW]
[ROW][C]17[/C][C]0.21866[/C][C]2.0041[/C][C]0.024143[/C][/ROW]
[ROW][C]18[/C][C]0.010192[/C][C]0.0934[/C][C]0.462899[/C][/ROW]
[ROW][C]19[/C][C]0.132614[/C][C]1.2154[/C][C]0.113805[/C][/ROW]
[ROW][C]20[/C][C]-0.015383[/C][C]-0.141[/C][C]0.444109[/C][/ROW]
[ROW][C]21[/C][C]-0.081106[/C][C]-0.7434[/C][C]0.229671[/C][/ROW]
[ROW][C]22[/C][C]0.006016[/C][C]0.0551[/C][C]0.47808[/C][/ROW]
[ROW][C]23[/C][C]0.0104[/C][C]0.0953[/C][C]0.462146[/C][/ROW]
[ROW][C]24[/C][C]-0.163273[/C][C]-1.4964[/C][C]0.069146[/C][/ROW]
[ROW][C]25[/C][C]0.19383[/C][C]1.7765[/C][C]0.039637[/C][/ROW]
[ROW][C]26[/C][C]0.154658[/C][C]1.4175[/C][C]0.080024[/C][/ROW]
[ROW][C]27[/C][C]-0.029044[/C][C]-0.2662[/C][C]0.395372[/C][/ROW]
[ROW][C]28[/C][C]-0.080883[/C][C]-0.7413[/C][C]0.230287[/C][/ROW]
[ROW][C]29[/C][C]-0.080547[/C][C]-0.7382[/C][C]0.231219[/C][/ROW]
[ROW][C]30[/C][C]0.021766[/C][C]0.1995[/C][C]0.421181[/C][/ROW]
[ROW][C]31[/C][C]-0.038633[/C][C]-0.3541[/C][C]0.362085[/C][/ROW]
[ROW][C]32[/C][C]-0.140798[/C][C]-1.2904[/C][C]0.100221[/C][/ROW]
[ROW][C]33[/C][C]0.017172[/C][C]0.1574[/C][C]0.437662[/C][/ROW]
[ROW][C]34[/C][C]0.058179[/C][C]0.5332[/C][C]0.297645[/C][/ROW]
[ROW][C]35[/C][C]-0.067327[/C][C]-0.6171[/C][C]0.269433[/C][/ROW]
[ROW][C]36[/C][C]0.134133[/C][C]1.2293[/C][C]0.111187[/C][/ROW]
[ROW][C]37[/C][C]-0.017772[/C][C]-0.1629[/C][C]0.435501[/C][/ROW]
[ROW][C]38[/C][C]-0.140511[/C][C]-1.2878[/C][C]0.100675[/C][/ROW]
[ROW][C]39[/C][C]0.037529[/C][C]0.344[/C][C]0.365869[/C][/ROW]
[ROW][C]40[/C][C]0.145169[/C][C]1.3305[/C][C]0.093478[/C][/ROW]
[ROW][C]41[/C][C]-0.119358[/C][C]-1.0939[/C][C]0.138556[/C][/ROW]
[ROW][C]42[/C][C]-0.016919[/C][C]-0.1551[/C][C]0.438569[/C][/ROW]
[ROW][C]43[/C][C]-0.062776[/C][C]-0.5754[/C][C]0.283295[/C][/ROW]
[ROW][C]44[/C][C]0.121812[/C][C]1.1164[/C][C]0.133711[/C][/ROW]
[ROW][C]45[/C][C]0.02776[/C][C]0.2544[/C][C]0.399893[/C][/ROW]
[ROW][C]46[/C][C]-0.058805[/C][C]-0.539[/C][C]0.295671[/C][/ROW]
[ROW][C]47[/C][C]-0.005229[/C][C]-0.0479[/C][C]0.480946[/C][/ROW]
[ROW][C]48[/C][C]-0.021262[/C][C]-0.1949[/C][C]0.422981[/C][/ROW]
[ROW][C]49[/C][C]-0.060089[/C][C]-0.5507[/C][C]0.291642[/C][/ROW]
[ROW][C]50[/C][C]0.028786[/C][C]0.2638[/C][C]0.396279[/C][/ROW]
[ROW][C]51[/C][C]-0.009773[/C][C]-0.0896[/C][C]0.46442[/C][/ROW]
[ROW][C]52[/C][C]-0.082574[/C][C]-0.7568[/C][C]0.225643[/C][/ROW]
[ROW][C]53[/C][C]0.084889[/C][C]0.778[/C][C]0.219371[/C][/ROW]
[ROW][C]54[/C][C]-0.007759[/C][C]-0.0711[/C][C]0.471738[/C][/ROW]
[ROW][C]55[/C][C]0.050937[/C][C]0.4668[/C][C]0.320909[/C][/ROW]
[ROW][C]56[/C][C]-0.008203[/C][C]-0.0752[/C][C]0.470125[/C][/ROW]
[ROW][C]57[/C][C]-0.060571[/C][C]-0.5551[/C][C]0.290137[/C][/ROW]
[ROW][C]58[/C][C]-0.070865[/C][C]-0.6495[/C][C]0.258899[/C][/ROW]
[ROW][C]59[/C][C]0.055969[/C][C]0.513[/C][C]0.304662[/C][/ROW]
[ROW][C]60[/C][C]-0.005645[/C][C]-0.0517[/C][C]0.479432[/C][/ROW]
[/TABLE]
Source: https://freestatistics.org/blog/index.php?pk=124191&T=1

Globally Unique Identifier (entire table): ba.freestatistics.org/blog/index.php?pk=124191&T=1

As an alternative you can also use a QR Code:  

The GUIDs for individual cells are displayed in the table below:

Autocorrelation Function
Time lag kACF(k)T-STATP-value
10.0462280.42370.336438
2-0.155225-1.42270.079269
3-0.087582-0.80270.212206
4-0.077097-0.70660.240885
5-0.20962-1.92120.029049
6-0.004009-0.03670.485387
7-0.00564-0.05170.47945
80.1285611.17830.121006
90.1425651.30660.097453
100.0708180.64910.259036
110.0834370.76470.223293
12-0.357657-3.2780.000761
13-0.206237-1.89020.03109
140.0196270.17990.428839
150.0121150.1110.455926
160.0108720.09960.460432
170.218662.00410.024143
180.0101920.09340.462899
190.1326141.21540.113805
20-0.015383-0.1410.444109
21-0.081106-0.74340.229671
220.0060160.05510.47808
230.01040.09530.462146
24-0.163273-1.49640.069146
250.193831.77650.039637
260.1546581.41750.080024
27-0.029044-0.26620.395372
28-0.080883-0.74130.230287
29-0.080547-0.73820.231219
300.0217660.19950.421181
31-0.038633-0.35410.362085
32-0.140798-1.29040.100221
330.0171720.15740.437662
340.0581790.53320.297645
35-0.067327-0.61710.269433
360.1341331.22930.111187
37-0.017772-0.16290.435501
38-0.140511-1.28780.100675
390.0375290.3440.365869
400.1451691.33050.093478
41-0.119358-1.09390.138556
42-0.016919-0.15510.438569
43-0.062776-0.57540.283295
440.1218121.11640.133711
450.027760.25440.399893
46-0.058805-0.5390.295671
47-0.005229-0.04790.480946
48-0.021262-0.19490.422981
49-0.060089-0.55070.291642
500.0287860.26380.396279
51-0.009773-0.08960.46442
52-0.082574-0.75680.225643
530.0848890.7780.219371
54-0.007759-0.07110.471738
550.0509370.46680.320909
56-0.008203-0.07520.470125
57-0.060571-0.55510.290137
58-0.070865-0.64950.258899
590.0559690.5130.304662
60-0.005645-0.05170.479432


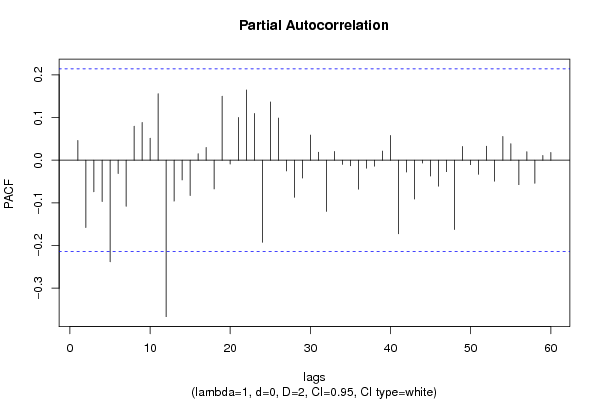
Partial Autocorrelation Function
Time lag kPACF(k)T-STATP-value
10.0462280.42370.336438
2-0.157699-1.44530.076042
3-0.073978-0.6780.24981
4-0.097007-0.88910.188249
5-0.237933-2.18070.016001
6-0.031271-0.28660.387559
7-0.107926-0.98920.162714
80.0796990.73050.233573
90.0883340.80960.210231
100.0515050.47210.319056
110.1555711.42580.078812
12-0.366669-3.36060.000586
13-0.095862-0.87860.191065
14-0.046154-0.4230.336686
15-0.082775-0.75860.225094
160.0151870.13920.444817
170.029870.27380.392468
18-0.067271-0.61650.2696
190.1497451.37240.08679
20-0.009-0.08250.467227
210.1000580.9170.180873
220.1646891.50940.067475
230.1096231.00470.158962
24-0.192489-1.76420.040668
250.1364961.2510.107202
260.098590.90360.184398
27-0.02514-0.23040.409164
28-0.086996-0.79730.213754
29-0.041606-0.38130.351961
300.0588510.53940.295527
310.0187590.17190.431955
32-0.120035-1.10010.137207
330.020260.18570.42657
34-0.009751-0.08940.4645
35-0.012996-0.11910.452738
36-0.067858-0.62190.267836
37-0.018635-0.17080.4324
38-0.013902-0.12740.449457
390.0213390.19560.422706
400.0577680.52940.298945
41-0.172239-1.57860.059094
42-0.027723-0.25410.400024
43-0.091094-0.83490.203073
44-0.006567-0.06020.476075
45-0.037099-0.340.367346
46-0.060738-0.55670.289616
47-0.026845-0.2460.403127
48-0.162542-1.48970.070021
490.0321230.29440.384585
50-0.010468-0.09590.461899
51-0.03302-0.30260.381458
520.0328670.30120.381992
53-0.049136-0.45030.326814
540.0554080.50780.306455
550.0385570.35340.362344
56-0.057316-0.52530.300377
570.0196930.18050.428602
58-0.054014-0.4950.310931
590.0110040.10090.459955
600.0180250.16520.43459

\begin{tabular}{lllllllll}
\hline
Partial Autocorrelation Function \tabularnewline
Time lag k & PACF(k) & T-STAT & P-value \tabularnewline
1 & 0.046228 & 0.4237 & 0.336438 \tabularnewline
2 & -0.157699 & -1.4453 & 0.076042 \tabularnewline
3 & -0.073978 & -0.678 & 0.24981 \tabularnewline
4 & -0.097007 & -0.8891 & 0.188249 \tabularnewline
5 & -0.237933 & -2.1807 & 0.016001 \tabularnewline
6 & -0.031271 & -0.2866 & 0.387559 \tabularnewline
7 & -0.107926 & -0.9892 & 0.162714 \tabularnewline
8 & 0.079699 & 0.7305 & 0.233573 \tabularnewline
9 & 0.088334 & 0.8096 & 0.210231 \tabularnewline
10 & 0.051505 & 0.4721 & 0.319056 \tabularnewline
11 & 0.155571 & 1.4258 & 0.078812 \tabularnewline
12 & -0.366669 & -3.3606 & 0.000586 \tabularnewline
13 & -0.095862 & -0.8786 & 0.191065 \tabularnewline
14 & -0.046154 & -0.423 & 0.336686 \tabularnewline
15 & -0.082775 & -0.7586 & 0.225094 \tabularnewline
16 & 0.015187 & 0.1392 & 0.444817 \tabularnewline
17 & 0.02987 & 0.2738 & 0.392468 \tabularnewline
18 & -0.067271 & -0.6165 & 0.2696 \tabularnewline
19 & 0.149745 & 1.3724 & 0.08679 \tabularnewline
20 & -0.009 & -0.0825 & 0.467227 \tabularnewline
21 & 0.100058 & 0.917 & 0.180873 \tabularnewline
22 & 0.164689 & 1.5094 & 0.067475 \tabularnewline
23 & 0.109623 & 1.0047 & 0.158962 \tabularnewline
24 & -0.192489 & -1.7642 & 0.040668 \tabularnewline
25 & 0.136496 & 1.251 & 0.107202 \tabularnewline
26 & 0.09859 & 0.9036 & 0.184398 \tabularnewline
27 & -0.02514 & -0.2304 & 0.409164 \tabularnewline
28 & -0.086996 & -0.7973 & 0.213754 \tabularnewline
29 & -0.041606 & -0.3813 & 0.351961 \tabularnewline
30 & 0.058851 & 0.5394 & 0.295527 \tabularnewline
31 & 0.018759 & 0.1719 & 0.431955 \tabularnewline
32 & -0.120035 & -1.1001 & 0.137207 \tabularnewline
33 & 0.02026 & 0.1857 & 0.42657 \tabularnewline
34 & -0.009751 & -0.0894 & 0.4645 \tabularnewline
35 & -0.012996 & -0.1191 & 0.452738 \tabularnewline
36 & -0.067858 & -0.6219 & 0.267836 \tabularnewline
37 & -0.018635 & -0.1708 & 0.4324 \tabularnewline
38 & -0.013902 & -0.1274 & 0.449457 \tabularnewline
39 & 0.021339 & 0.1956 & 0.422706 \tabularnewline
40 & 0.057768 & 0.5294 & 0.298945 \tabularnewline
41 & -0.172239 & -1.5786 & 0.059094 \tabularnewline
42 & -0.027723 & -0.2541 & 0.400024 \tabularnewline
43 & -0.091094 & -0.8349 & 0.203073 \tabularnewline
44 & -0.006567 & -0.0602 & 0.476075 \tabularnewline
45 & -0.037099 & -0.34 & 0.367346 \tabularnewline
46 & -0.060738 & -0.5567 & 0.289616 \tabularnewline
47 & -0.026845 & -0.246 & 0.403127 \tabularnewline
48 & -0.162542 & -1.4897 & 0.070021 \tabularnewline
49 & 0.032123 & 0.2944 & 0.384585 \tabularnewline
50 & -0.010468 & -0.0959 & 0.461899 \tabularnewline
51 & -0.03302 & -0.3026 & 0.381458 \tabularnewline
52 & 0.032867 & 0.3012 & 0.381992 \tabularnewline
53 & -0.049136 & -0.4503 & 0.326814 \tabularnewline
54 & 0.055408 & 0.5078 & 0.306455 \tabularnewline
55 & 0.038557 & 0.3534 & 0.362344 \tabularnewline
56 & -0.057316 & -0.5253 & 0.300377 \tabularnewline
57 & 0.019693 & 0.1805 & 0.428602 \tabularnewline
58 & -0.054014 & -0.495 & 0.310931 \tabularnewline
59 & 0.011004 & 0.1009 & 0.459955 \tabularnewline
60 & 0.018025 & 0.1652 & 0.43459 \tabularnewline
\hline
\end{tabular}
%Source: https://freestatistics.org/blog/index.php?pk=124191&T=2

[TABLE]
[ROW][C]Partial Autocorrelation Function[/C][/ROW]
[ROW][C]Time lag k[/C][C]PACF(k)[/C][C]T-STAT[/C][C]P-value[/C][/ROW]
[ROW][C]1[/C][C]0.046228[/C][C]0.4237[/C][C]0.336438[/C][/ROW]
[ROW][C]2[/C][C]-0.157699[/C][C]-1.4453[/C][C]0.076042[/C][/ROW]
[ROW][C]3[/C][C]-0.073978[/C][C]-0.678[/C][C]0.24981[/C][/ROW]
[ROW][C]4[/C][C]-0.097007[/C][C]-0.8891[/C][C]0.188249[/C][/ROW]
[ROW][C]5[/C][C]-0.237933[/C][C]-2.1807[/C][C]0.016001[/C][/ROW]
[ROW][C]6[/C][C]-0.031271[/C][C]-0.2866[/C][C]0.387559[/C][/ROW]
[ROW][C]7[/C][C]-0.107926[/C][C]-0.9892[/C][C]0.162714[/C][/ROW]
[ROW][C]8[/C][C]0.079699[/C][C]0.7305[/C][C]0.233573[/C][/ROW]
[ROW][C]9[/C][C]0.088334[/C][C]0.8096[/C][C]0.210231[/C][/ROW]
[ROW][C]10[/C][C]0.051505[/C][C]0.4721[/C][C]0.319056[/C][/ROW]
[ROW][C]11[/C][C]0.155571[/C][C]1.4258[/C][C]0.078812[/C][/ROW]
[ROW][C]12[/C][C]-0.366669[/C][C]-3.3606[/C][C]0.000586[/C][/ROW]
[ROW][C]13[/C][C]-0.095862[/C][C]-0.8786[/C][C]0.191065[/C][/ROW]
[ROW][C]14[/C][C]-0.046154[/C][C]-0.423[/C][C]0.336686[/C][/ROW]
[ROW][C]15[/C][C]-0.082775[/C][C]-0.7586[/C][C]0.225094[/C][/ROW]
[ROW][C]16[/C][C]0.015187[/C][C]0.1392[/C][C]0.444817[/C][/ROW]
[ROW][C]17[/C][C]0.02987[/C][C]0.2738[/C][C]0.392468[/C][/ROW]
[ROW][C]18[/C][C]-0.067271[/C][C]-0.6165[/C][C]0.2696[/C][/ROW]
[ROW][C]19[/C][C]0.149745[/C][C]1.3724[/C][C]0.08679[/C][/ROW]
[ROW][C]20[/C][C]-0.009[/C][C]-0.0825[/C][C]0.467227[/C][/ROW]
[ROW][C]21[/C][C]0.100058[/C][C]0.917[/C][C]0.180873[/C][/ROW]
[ROW][C]22[/C][C]0.164689[/C][C]1.5094[/C][C]0.067475[/C][/ROW]
[ROW][C]23[/C][C]0.109623[/C][C]1.0047[/C][C]0.158962[/C][/ROW]
[ROW][C]24[/C][C]-0.192489[/C][C]-1.7642[/C][C]0.040668[/C][/ROW]
[ROW][C]25[/C][C]0.136496[/C][C]1.251[/C][C]0.107202[/C][/ROW]
[ROW][C]26[/C][C]0.09859[/C][C]0.9036[/C][C]0.184398[/C][/ROW]
[ROW][C]27[/C][C]-0.02514[/C][C]-0.2304[/C][C]0.409164[/C][/ROW]
[ROW][C]28[/C][C]-0.086996[/C][C]-0.7973[/C][C]0.213754[/C][/ROW]
[ROW][C]29[/C][C]-0.041606[/C][C]-0.3813[/C][C]0.351961[/C][/ROW]
[ROW][C]30[/C][C]0.058851[/C][C]0.5394[/C][C]0.295527[/C][/ROW]
[ROW][C]31[/C][C]0.018759[/C][C]0.1719[/C][C]0.431955[/C][/ROW]
[ROW][C]32[/C][C]-0.120035[/C][C]-1.1001[/C][C]0.137207[/C][/ROW]
[ROW][C]33[/C][C]0.02026[/C][C]0.1857[/C][C]0.42657[/C][/ROW]
[ROW][C]34[/C][C]-0.009751[/C][C]-0.0894[/C][C]0.4645[/C][/ROW]
[ROW][C]35[/C][C]-0.012996[/C][C]-0.1191[/C][C]0.452738[/C][/ROW]
[ROW][C]36[/C][C]-0.067858[/C][C]-0.6219[/C][C]0.267836[/C][/ROW]
[ROW][C]37[/C][C]-0.018635[/C][C]-0.1708[/C][C]0.4324[/C][/ROW]
[ROW][C]38[/C][C]-0.013902[/C][C]-0.1274[/C][C]0.449457[/C][/ROW]
[ROW][C]39[/C][C]0.021339[/C][C]0.1956[/C][C]0.422706[/C][/ROW]
[ROW][C]40[/C][C]0.057768[/C][C]0.5294[/C][C]0.298945[/C][/ROW]
[ROW][C]41[/C][C]-0.172239[/C][C]-1.5786[/C][C]0.059094[/C][/ROW]
[ROW][C]42[/C][C]-0.027723[/C][C]-0.2541[/C][C]0.400024[/C][/ROW]
[ROW][C]43[/C][C]-0.091094[/C][C]-0.8349[/C][C]0.203073[/C][/ROW]
[ROW][C]44[/C][C]-0.006567[/C][C]-0.0602[/C][C]0.476075[/C][/ROW]
[ROW][C]45[/C][C]-0.037099[/C][C]-0.34[/C][C]0.367346[/C][/ROW]
[ROW][C]46[/C][C]-0.060738[/C][C]-0.5567[/C][C]0.289616[/C][/ROW]
[ROW][C]47[/C][C]-0.026845[/C][C]-0.246[/C][C]0.403127[/C][/ROW]
[ROW][C]48[/C][C]-0.162542[/C][C]-1.4897[/C][C]0.070021[/C][/ROW]
[ROW][C]49[/C][C]0.032123[/C][C]0.2944[/C][C]0.384585[/C][/ROW]
[ROW][C]50[/C][C]-0.010468[/C][C]-0.0959[/C][C]0.461899[/C][/ROW]
[ROW][C]51[/C][C]-0.03302[/C][C]-0.3026[/C][C]0.381458[/C][/ROW]
[ROW][C]52[/C][C]0.032867[/C][C]0.3012[/C][C]0.381992[/C][/ROW]
[ROW][C]53[/C][C]-0.049136[/C][C]-0.4503[/C][C]0.326814[/C][/ROW]
[ROW][C]54[/C][C]0.055408[/C][C]0.5078[/C][C]0.306455[/C][/ROW]
[ROW][C]55[/C][C]0.038557[/C][C]0.3534[/C][C]0.362344[/C][/ROW]
[ROW][C]56[/C][C]-0.057316[/C][C]-0.5253[/C][C]0.300377[/C][/ROW]
[ROW][C]57[/C][C]0.019693[/C][C]0.1805[/C][C]0.428602[/C][/ROW]
[ROW][C]58[/C][C]-0.054014[/C][C]-0.495[/C][C]0.310931[/C][/ROW]
[ROW][C]59[/C][C]0.011004[/C][C]0.1009[/C][C]0.459955[/C][/ROW]
[ROW][C]60[/C][C]0.018025[/C][C]0.1652[/C][C]0.43459[/C][/ROW]
[/TABLE]
Source: https://freestatistics.org/blog/index.php?pk=124191&T=2

Globally Unique Identifier (entire table): ba.freestatistics.org/blog/index.php?pk=124191&T=2

As an alternative you can also use a QR Code:  

The GUIDs for individual cells are displayed in the table below:

Partial Autocorrelation Function
Time lag kPACF(k)T-STATP-value
10.0462280.42370.336438
2-0.157699-1.44530.076042
3-0.073978-0.6780.24981
4-0.097007-0.88910.188249
5-0.237933-2.18070.016001
6-0.031271-0.28660.387559
7-0.107926-0.98920.162714
80.0796990.73050.233573
90.0883340.80960.210231
100.0515050.47210.319056
110.1555711.42580.078812
12-0.366669-3.36060.000586
13-0.095862-0.87860.191065
14-0.046154-0.4230.336686
15-0.082775-0.75860.225094
160.0151870.13920.444817
170.029870.27380.392468
18-0.067271-0.61650.2696
190.1497451.37240.08679
20-0.009-0.08250.467227
210.1000580.9170.180873
220.1646891.50940.067475
230.1096231.00470.158962
24-0.192489-1.76420.040668
250.1364961.2510.107202
260.098590.90360.184398
27-0.02514-0.23040.409164
28-0.086996-0.79730.213754
29-0.041606-0.38130.351961
300.0588510.53940.295527
310.0187590.17190.431955
32-0.120035-1.10010.137207
330.020260.18570.42657
34-0.009751-0.08940.4645
35-0.012996-0.11910.452738
36-0.067858-0.62190.267836
37-0.018635-0.17080.4324
38-0.013902-0.12740.449457
390.0213390.19560.422706
400.0577680.52940.298945
41-0.172239-1.57860.059094
42-0.027723-0.25410.400024
43-0.091094-0.83490.203073
44-0.006567-0.06020.476075
45-0.037099-0.340.367346
46-0.060738-0.55670.289616
47-0.026845-0.2460.403127
48-0.162542-1.48970.070021
490.0321230.29440.384585
50-0.010468-0.09590.461899
51-0.03302-0.30260.381458
520.0328670.30120.381992
53-0.049136-0.45030.326814
540.0554080.50780.306455
550.0385570.35340.362344
56-0.057316-0.52530.300377
570.0196930.18050.428602
58-0.054014-0.4950.310931
590.0110040.10090.459955
600.0180250.16520.43459


Parameters (Session):
par1 = 60 ; par2 = 1 ; par3 = 0 ; par4 = 2 ; par5 = 12 ; par6 = White Noise ; par7 = 0.95 ;
Parameters (R input):
par1 = 60 ; par2 = 1 ; par3 = 0 ; par4 = 2 ; par5 = 12 ; par6 = White Noise ; par7 = 0.95 ; par8 = ;
R code (references can be found in the software module):
if (par1 == 'Default') {
par1 = 10*log10(length(x))
} else {
par1 <- as.numeric(par1)
}
par2 <- as.numeric(par2)
par3 <- as.numeric(par3)
par4 <- as.numeric(par4)
par5 <- as.numeric(par5)
if (par6 == 'White Noise') par6 <- 'white' else par6 <- 'ma'
par7 <- as.numeric(par7)
if (par8 != '') par8 <- as.numeric(par8)
ox <- x
if (par8 == '') {
if (par2 == 0) {
x <- log(x)
} else {
x <- (x ^ par2 - 1) / par2
}
} else {
x <- log(x,base=par8)
}
if (par3 > 0) x <- diff(x,lag=1,difference=par3)
if (par4 > 0) x <- diff(x,lag=par5,difference=par4)
bitmap(file='picts.png')
op <- par(mfrow=c(2,1))
plot(ox,type='l',main='Original Time Series',xlab='time',ylab='value')
if (par8=='') {
mytitle <- paste('Working Time Series (lambda=',par2,', d=',par3,', D=',par4,')',sep='')
mysub <- paste('(lambda=',par2,', d=',par3,', D=',par4,', CI=', par7, ', CI type=',par6,')',sep='')
} else {
mytitle <- paste('Working Time Series (base=',par8,', d=',par3,', D=',par4,')',sep='')
mysub <- paste('(base=',par8,', d=',par3,', D=',par4,', CI=', par7, ', CI type=',par6,')',sep='')
}
plot(x,type='l', main=mytitle,xlab='time',ylab='value')
par(op)
dev.off()
bitmap(file='pic1.png')
racf <- acf(x, par1, main='Autocorrelation', xlab='time lag', ylab='ACF', ci.type=par6, ci=par7, sub=mysub)
dev.off()
bitmap(file='pic2.png')
rpacf <- pacf(x,par1,main='Partial Autocorrelation',xlab='lags',ylab='PACF',sub=mysub)
dev.off()
(myacf <- c(racf$acf))
(mypacf <- c(rpacf$acf))
lengthx <- length(x)
sqrtn <- sqrt(lengthx)
load(file='createtable')
a<-table.start()
a<-table.row.start(a)
a<-table.element(a,'Autocorrelation Function',4,TRUE)
a<-table.row.end(a)
a<-table.row.start(a)
a<-table.element(a,'Time lag k',header=TRUE)
a<-table.element(a,hyperlink('basics.htm','ACF(k)','click here for more information about the Autocorrelation Function'),header=TRUE)
a<-table.element(a,'T-STAT',header=TRUE)
a<-table.element(a,'P-value',header=TRUE)
a<-table.row.end(a)
for (i in 2:(par1+1)) {
a<-table.row.start(a)
a<-table.element(a,i-1,header=TRUE)
a<-table.element(a,round(myacf[i],6))
mytstat <- myacf[i]*sqrtn
a<-table.element(a,round(mytstat,4))
a<-table.element(a,round(1-pt(abs(mytstat),lengthx),6))
a<-table.row.end(a)
}
a<-table.end(a)
table.save(a,file='mytable.tab')
a<-table.start()
a<-table.row.start(a)
a<-table.element(a,'Partial Autocorrelation Function',4,TRUE)
a<-table.row.end(a)
a<-table.row.start(a)
a<-table.element(a,'Time lag k',header=TRUE)
a<-table.element(a,hyperlink('basics.htm','PACF(k)','click here for more information about the Partial Autocorrelation Function'),header=TRUE)
a<-table.element(a,'T-STAT',header=TRUE)
a<-table.element(a,'P-value',header=TRUE)
a<-table.row.end(a)
for (i in 1:par1) {
a<-table.row.start(a)
a<-table.element(a,i,header=TRUE)
a<-table.element(a,round(mypacf[i],6))
mytstat <- mypacf[i]*sqrtn
a<-table.element(a,round(mytstat,4))
a<-table.element(a,round(1-pt(abs(mytstat),lengthx),6))
a<-table.row.end(a)
}
a<-table.end(a)
table.save(a,file='mytable1.tab')