Free Statistics

of Irreproducible Research!

Author's title

Author*Unverified author*
R Software Modulerwasp_autocorrelation.wasp
Title produced by software(Partial) Autocorrelation Function
Date of computationFri, 19 Aug 2011 02:40:34 -0400
Cite this page as followsStatistical Computations at FreeStatistics.org, Office for Research Development and Education, URL https://freestatistics.org/blog/index.php?v=date/2011/Aug/19/t1313736235budxndzf3y7qm17.htm/, Retrieved Tue, 14 May 2024 04:41:34 +0000
Statistical Computations at FreeStatistics.org, Office for Research Development and Education, URL https://freestatistics.org/blog/index.php?pk=124189, Retrieved Tue, 14 May 2024 04:41:34 +0000
QR Codes:

Original text written by user:
IsPrivate?No (this computation is public)
User-defined keywordsVan Tongelen Caroline
Estimated Impact167
Family? (F = Feedback message, R = changed R code, M = changed R Module, P = changed Parameters, D = changed Data)
-       [(Partial) Autocorrelation Function] [TIJDREEKS B - STA...] [2011-08-19 06:40:34] [7d6606cca1b3596736d7d387043cb02b] [Current]
Feedback Forum

Post a new message
Dataseries X:
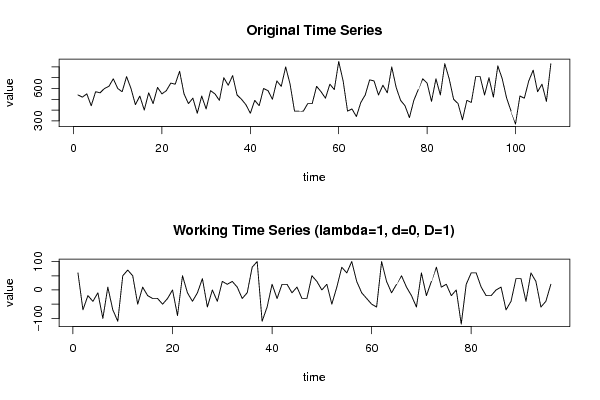
540
520
550
440
570
560
600
620
690
600
570
710
600
450
530
400
560
460
610
550
580
650
640
760
550
460
510
370
530
410
580
550
490
700
630
720
540
500
450
370
490
440
600
580
500
670
620
800
640
390
390
390
460
460
620
570
510
640
590
850
670
390
410
340
470
540
680
670
540
630
560
800
610
490
440
330
490
590
690
650
480
690
540
830
690
500
460
310
490
470
710
710
540
700
520
810
690
510
390
270
530
510
670
770
570
640
480
830


Summary of computational transaction
Raw Inputview raw input (R code)
Raw Outputview raw output of R engine
Computing time2 seconds
R Server'Gwilym Jenkins' @ jenkins.wessa.net

\begin{tabular}{lllllllll}
\hline
Summary of computational transaction \tabularnewline
Raw Input & view raw input (R code)  \tabularnewline
Raw Output & view raw output of R engine  \tabularnewline
Computing time & 2 seconds \tabularnewline
R Server & 'Gwilym Jenkins' @ jenkins.wessa.net \tabularnewline
\hline
\end{tabular}
%Source: https://freestatistics.org/blog/index.php?pk=124189&T=0

[TABLE]
[ROW][C]Summary of computational transaction[/C][/ROW]
[ROW][C]Raw Input[/C][C]view raw input (R code) [/C][/ROW]
[ROW][C]Raw Output[/C][C]view raw output of R engine [/C][/ROW]
[ROW][C]Computing time[/C][C]2 seconds[/C][/ROW]
[ROW][C]R Server[/C][C]'Gwilym Jenkins' @ jenkins.wessa.net[/C][/ROW]
[/TABLE]
Source: https://freestatistics.org/blog/index.php?pk=124189&T=0

Globally Unique Identifier (entire table): ba.freestatistics.org/blog/index.php?pk=124189&T=0

As an alternative you can also use a QR Code:  

The GUIDs for individual cells are displayed in the table below:

Summary of computational transaction
Raw Inputview raw input (R code)
Raw Outputview raw output of R engine
Computing time2 seconds
R Server'Gwilym Jenkins' @ jenkins.wessa.net


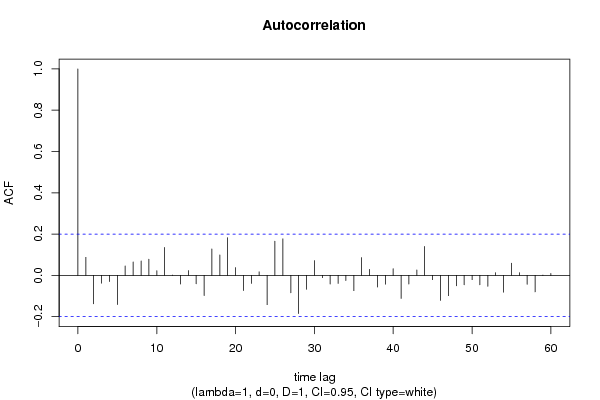
Autocorrelation Function
Time lag kACF(k)T-STATP-value
10.0872120.85450.197477
2-0.137412-1.34640.090679
3-0.037623-0.36860.356609
4-0.029519-0.28920.386516
5-0.141254-1.3840.084784
60.0452460.44330.329268
70.0646810.63370.263878
80.0693060.67910.249368
90.0781280.76550.222928
100.0227120.22250.412186
110.1351111.32380.094354
12-0.000798-0.00780.496889
13-0.041631-0.40790.342127
140.022880.22420.411548
15-0.041093-0.40260.344059
16-0.09766-0.95690.170518
170.1278111.25230.106755
180.0984120.96420.168676
190.1819961.78320.038858
200.037390.36630.357458
21-0.073077-0.7160.237864
22-0.03897-0.38180.351716
230.0169840.16640.434093
24-0.141706-1.38840.08411
250.1652941.61950.054305
260.1768251.73250.043196
27-0.084178-0.82480.205773
28-0.185052-1.81310.036468
29-0.067458-0.66090.255115
300.071560.70110.242456
31-0.011178-0.10950.456507
32-0.041883-0.41040.341226
33-0.038755-0.37970.352496
34-0.024883-0.24380.403953
35-0.074147-0.72650.234652
360.0860130.84280.20073
370.0288960.28310.388848
38-0.056347-0.55210.291088
39-0.042563-0.4170.338794
400.0319370.31290.37751
41-0.111685-1.09430.138283
42-0.042263-0.41410.339864
430.0257130.25190.400816
440.1398651.37040.08688
45-0.020653-0.20240.420034
46-0.121335-1.18880.118718
47-0.098355-0.96370.168813
48-0.049975-0.48960.31275
49-0.045466-0.44550.328489
50-0.020696-0.20280.419869
51-0.045273-0.44360.329171
52-0.052684-0.51620.303452
530.0131190.12850.448996
54-0.081413-0.79770.213513
550.0587420.57560.283131
560.0127140.12460.450561
57-0.043508-0.42630.335425
58-0.079865-0.78250.21792
590.0009820.00960.496171
600.0092260.09040.464081

\begin{tabular}{lllllllll}
\hline
Autocorrelation Function \tabularnewline
Time lag k & ACF(k) & T-STAT & P-value \tabularnewline
1 & 0.087212 & 0.8545 & 0.197477 \tabularnewline
2 & -0.137412 & -1.3464 & 0.090679 \tabularnewline
3 & -0.037623 & -0.3686 & 0.356609 \tabularnewline
4 & -0.029519 & -0.2892 & 0.386516 \tabularnewline
5 & -0.141254 & -1.384 & 0.084784 \tabularnewline
6 & 0.045246 & 0.4433 & 0.329268 \tabularnewline
7 & 0.064681 & 0.6337 & 0.263878 \tabularnewline
8 & 0.069306 & 0.6791 & 0.249368 \tabularnewline
9 & 0.078128 & 0.7655 & 0.222928 \tabularnewline
10 & 0.022712 & 0.2225 & 0.412186 \tabularnewline
11 & 0.135111 & 1.3238 & 0.094354 \tabularnewline
12 & -0.000798 & -0.0078 & 0.496889 \tabularnewline
13 & -0.041631 & -0.4079 & 0.342127 \tabularnewline
14 & 0.02288 & 0.2242 & 0.411548 \tabularnewline
15 & -0.041093 & -0.4026 & 0.344059 \tabularnewline
16 & -0.09766 & -0.9569 & 0.170518 \tabularnewline
17 & 0.127811 & 1.2523 & 0.106755 \tabularnewline
18 & 0.098412 & 0.9642 & 0.168676 \tabularnewline
19 & 0.181996 & 1.7832 & 0.038858 \tabularnewline
20 & 0.03739 & 0.3663 & 0.357458 \tabularnewline
21 & -0.073077 & -0.716 & 0.237864 \tabularnewline
22 & -0.03897 & -0.3818 & 0.351716 \tabularnewline
23 & 0.016984 & 0.1664 & 0.434093 \tabularnewline
24 & -0.141706 & -1.3884 & 0.08411 \tabularnewline
25 & 0.165294 & 1.6195 & 0.054305 \tabularnewline
26 & 0.176825 & 1.7325 & 0.043196 \tabularnewline
27 & -0.084178 & -0.8248 & 0.205773 \tabularnewline
28 & -0.185052 & -1.8131 & 0.036468 \tabularnewline
29 & -0.067458 & -0.6609 & 0.255115 \tabularnewline
30 & 0.07156 & 0.7011 & 0.242456 \tabularnewline
31 & -0.011178 & -0.1095 & 0.456507 \tabularnewline
32 & -0.041883 & -0.4104 & 0.341226 \tabularnewline
33 & -0.038755 & -0.3797 & 0.352496 \tabularnewline
34 & -0.024883 & -0.2438 & 0.403953 \tabularnewline
35 & -0.074147 & -0.7265 & 0.234652 \tabularnewline
36 & 0.086013 & 0.8428 & 0.20073 \tabularnewline
37 & 0.028896 & 0.2831 & 0.388848 \tabularnewline
38 & -0.056347 & -0.5521 & 0.291088 \tabularnewline
39 & -0.042563 & -0.417 & 0.338794 \tabularnewline
40 & 0.031937 & 0.3129 & 0.37751 \tabularnewline
41 & -0.111685 & -1.0943 & 0.138283 \tabularnewline
42 & -0.042263 & -0.4141 & 0.339864 \tabularnewline
43 & 0.025713 & 0.2519 & 0.400816 \tabularnewline
44 & 0.139865 & 1.3704 & 0.08688 \tabularnewline
45 & -0.020653 & -0.2024 & 0.420034 \tabularnewline
46 & -0.121335 & -1.1888 & 0.118718 \tabularnewline
47 & -0.098355 & -0.9637 & 0.168813 \tabularnewline
48 & -0.049975 & -0.4896 & 0.31275 \tabularnewline
49 & -0.045466 & -0.4455 & 0.328489 \tabularnewline
50 & -0.020696 & -0.2028 & 0.419869 \tabularnewline
51 & -0.045273 & -0.4436 & 0.329171 \tabularnewline
52 & -0.052684 & -0.5162 & 0.303452 \tabularnewline
53 & 0.013119 & 0.1285 & 0.448996 \tabularnewline
54 & -0.081413 & -0.7977 & 0.213513 \tabularnewline
55 & 0.058742 & 0.5756 & 0.283131 \tabularnewline
56 & 0.012714 & 0.1246 & 0.450561 \tabularnewline
57 & -0.043508 & -0.4263 & 0.335425 \tabularnewline
58 & -0.079865 & -0.7825 & 0.21792 \tabularnewline
59 & 0.000982 & 0.0096 & 0.496171 \tabularnewline
60 & 0.009226 & 0.0904 & 0.464081 \tabularnewline
\hline
\end{tabular}
%Source: https://freestatistics.org/blog/index.php?pk=124189&T=1

[TABLE]
[ROW][C]Autocorrelation Function[/C][/ROW]
[ROW][C]Time lag k[/C][C]ACF(k)[/C][C]T-STAT[/C][C]P-value[/C][/ROW]
[ROW][C]1[/C][C]0.087212[/C][C]0.8545[/C][C]0.197477[/C][/ROW]
[ROW][C]2[/C][C]-0.137412[/C][C]-1.3464[/C][C]0.090679[/C][/ROW]
[ROW][C]3[/C][C]-0.037623[/C][C]-0.3686[/C][C]0.356609[/C][/ROW]
[ROW][C]4[/C][C]-0.029519[/C][C]-0.2892[/C][C]0.386516[/C][/ROW]
[ROW][C]5[/C][C]-0.141254[/C][C]-1.384[/C][C]0.084784[/C][/ROW]
[ROW][C]6[/C][C]0.045246[/C][C]0.4433[/C][C]0.329268[/C][/ROW]
[ROW][C]7[/C][C]0.064681[/C][C]0.6337[/C][C]0.263878[/C][/ROW]
[ROW][C]8[/C][C]0.069306[/C][C]0.6791[/C][C]0.249368[/C][/ROW]
[ROW][C]9[/C][C]0.078128[/C][C]0.7655[/C][C]0.222928[/C][/ROW]
[ROW][C]10[/C][C]0.022712[/C][C]0.2225[/C][C]0.412186[/C][/ROW]
[ROW][C]11[/C][C]0.135111[/C][C]1.3238[/C][C]0.094354[/C][/ROW]
[ROW][C]12[/C][C]-0.000798[/C][C]-0.0078[/C][C]0.496889[/C][/ROW]
[ROW][C]13[/C][C]-0.041631[/C][C]-0.4079[/C][C]0.342127[/C][/ROW]
[ROW][C]14[/C][C]0.02288[/C][C]0.2242[/C][C]0.411548[/C][/ROW]
[ROW][C]15[/C][C]-0.041093[/C][C]-0.4026[/C][C]0.344059[/C][/ROW]
[ROW][C]16[/C][C]-0.09766[/C][C]-0.9569[/C][C]0.170518[/C][/ROW]
[ROW][C]17[/C][C]0.127811[/C][C]1.2523[/C][C]0.106755[/C][/ROW]
[ROW][C]18[/C][C]0.098412[/C][C]0.9642[/C][C]0.168676[/C][/ROW]
[ROW][C]19[/C][C]0.181996[/C][C]1.7832[/C][C]0.038858[/C][/ROW]
[ROW][C]20[/C][C]0.03739[/C][C]0.3663[/C][C]0.357458[/C][/ROW]
[ROW][C]21[/C][C]-0.073077[/C][C]-0.716[/C][C]0.237864[/C][/ROW]
[ROW][C]22[/C][C]-0.03897[/C][C]-0.3818[/C][C]0.351716[/C][/ROW]
[ROW][C]23[/C][C]0.016984[/C][C]0.1664[/C][C]0.434093[/C][/ROW]
[ROW][C]24[/C][C]-0.141706[/C][C]-1.3884[/C][C]0.08411[/C][/ROW]
[ROW][C]25[/C][C]0.165294[/C][C]1.6195[/C][C]0.054305[/C][/ROW]
[ROW][C]26[/C][C]0.176825[/C][C]1.7325[/C][C]0.043196[/C][/ROW]
[ROW][C]27[/C][C]-0.084178[/C][C]-0.8248[/C][C]0.205773[/C][/ROW]
[ROW][C]28[/C][C]-0.185052[/C][C]-1.8131[/C][C]0.036468[/C][/ROW]
[ROW][C]29[/C][C]-0.067458[/C][C]-0.6609[/C][C]0.255115[/C][/ROW]
[ROW][C]30[/C][C]0.07156[/C][C]0.7011[/C][C]0.242456[/C][/ROW]
[ROW][C]31[/C][C]-0.011178[/C][C]-0.1095[/C][C]0.456507[/C][/ROW]
[ROW][C]32[/C][C]-0.041883[/C][C]-0.4104[/C][C]0.341226[/C][/ROW]
[ROW][C]33[/C][C]-0.038755[/C][C]-0.3797[/C][C]0.352496[/C][/ROW]
[ROW][C]34[/C][C]-0.024883[/C][C]-0.2438[/C][C]0.403953[/C][/ROW]
[ROW][C]35[/C][C]-0.074147[/C][C]-0.7265[/C][C]0.234652[/C][/ROW]
[ROW][C]36[/C][C]0.086013[/C][C]0.8428[/C][C]0.20073[/C][/ROW]
[ROW][C]37[/C][C]0.028896[/C][C]0.2831[/C][C]0.388848[/C][/ROW]
[ROW][C]38[/C][C]-0.056347[/C][C]-0.5521[/C][C]0.291088[/C][/ROW]
[ROW][C]39[/C][C]-0.042563[/C][C]-0.417[/C][C]0.338794[/C][/ROW]
[ROW][C]40[/C][C]0.031937[/C][C]0.3129[/C][C]0.37751[/C][/ROW]
[ROW][C]41[/C][C]-0.111685[/C][C]-1.0943[/C][C]0.138283[/C][/ROW]
[ROW][C]42[/C][C]-0.042263[/C][C]-0.4141[/C][C]0.339864[/C][/ROW]
[ROW][C]43[/C][C]0.025713[/C][C]0.2519[/C][C]0.400816[/C][/ROW]
[ROW][C]44[/C][C]0.139865[/C][C]1.3704[/C][C]0.08688[/C][/ROW]
[ROW][C]45[/C][C]-0.020653[/C][C]-0.2024[/C][C]0.420034[/C][/ROW]
[ROW][C]46[/C][C]-0.121335[/C][C]-1.1888[/C][C]0.118718[/C][/ROW]
[ROW][C]47[/C][C]-0.098355[/C][C]-0.9637[/C][C]0.168813[/C][/ROW]
[ROW][C]48[/C][C]-0.049975[/C][C]-0.4896[/C][C]0.31275[/C][/ROW]
[ROW][C]49[/C][C]-0.045466[/C][C]-0.4455[/C][C]0.328489[/C][/ROW]
[ROW][C]50[/C][C]-0.020696[/C][C]-0.2028[/C][C]0.419869[/C][/ROW]
[ROW][C]51[/C][C]-0.045273[/C][C]-0.4436[/C][C]0.329171[/C][/ROW]
[ROW][C]52[/C][C]-0.052684[/C][C]-0.5162[/C][C]0.303452[/C][/ROW]
[ROW][C]53[/C][C]0.013119[/C][C]0.1285[/C][C]0.448996[/C][/ROW]
[ROW][C]54[/C][C]-0.081413[/C][C]-0.7977[/C][C]0.213513[/C][/ROW]
[ROW][C]55[/C][C]0.058742[/C][C]0.5756[/C][C]0.283131[/C][/ROW]
[ROW][C]56[/C][C]0.012714[/C][C]0.1246[/C][C]0.450561[/C][/ROW]
[ROW][C]57[/C][C]-0.043508[/C][C]-0.4263[/C][C]0.335425[/C][/ROW]
[ROW][C]58[/C][C]-0.079865[/C][C]-0.7825[/C][C]0.21792[/C][/ROW]
[ROW][C]59[/C][C]0.000982[/C][C]0.0096[/C][C]0.496171[/C][/ROW]
[ROW][C]60[/C][C]0.009226[/C][C]0.0904[/C][C]0.464081[/C][/ROW]
[/TABLE]
Source: https://freestatistics.org/blog/index.php?pk=124189&T=1

Globally Unique Identifier (entire table): ba.freestatistics.org/blog/index.php?pk=124189&T=1

As an alternative you can also use a QR Code:  

The GUIDs for individual cells are displayed in the table below:

Autocorrelation Function
Time lag kACF(k)T-STATP-value
10.0872120.85450.197477
2-0.137412-1.34640.090679
3-0.037623-0.36860.356609
4-0.029519-0.28920.386516
5-0.141254-1.3840.084784
60.0452460.44330.329268
70.0646810.63370.263878
80.0693060.67910.249368
90.0781280.76550.222928
100.0227120.22250.412186
110.1351111.32380.094354
12-0.000798-0.00780.496889
13-0.041631-0.40790.342127
140.022880.22420.411548
15-0.041093-0.40260.344059
16-0.09766-0.95690.170518
170.1278111.25230.106755
180.0984120.96420.168676
190.1819961.78320.038858
200.037390.36630.357458
21-0.073077-0.7160.237864
22-0.03897-0.38180.351716
230.0169840.16640.434093
24-0.141706-1.38840.08411
250.1652941.61950.054305
260.1768251.73250.043196
27-0.084178-0.82480.205773
28-0.185052-1.81310.036468
29-0.067458-0.66090.255115
300.071560.70110.242456
31-0.011178-0.10950.456507
32-0.041883-0.41040.341226
33-0.038755-0.37970.352496
34-0.024883-0.24380.403953
35-0.074147-0.72650.234652
360.0860130.84280.20073
370.0288960.28310.388848
38-0.056347-0.55210.291088
39-0.042563-0.4170.338794
400.0319370.31290.37751
41-0.111685-1.09430.138283
42-0.042263-0.41410.339864
430.0257130.25190.400816
440.1398651.37040.08688
45-0.020653-0.20240.420034
46-0.121335-1.18880.118718
47-0.098355-0.96370.168813
48-0.049975-0.48960.31275
49-0.045466-0.44550.328489
50-0.020696-0.20280.419869
51-0.045273-0.44360.329171
52-0.052684-0.51620.303452
530.0131190.12850.448996
54-0.081413-0.79770.213513
550.0587420.57560.283131
560.0127140.12460.450561
57-0.043508-0.42630.335425
58-0.079865-0.78250.21792
590.0009820.00960.496171
600.0092260.09040.464081


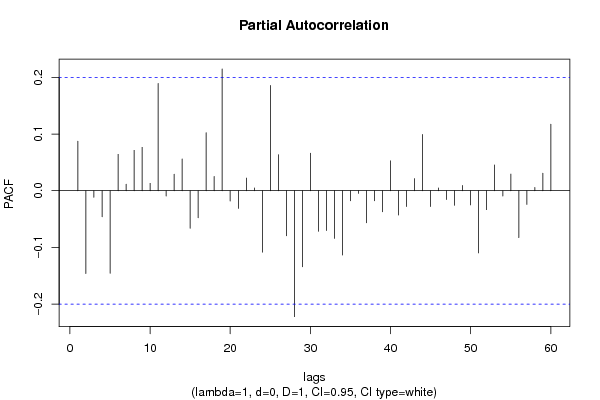
Partial Autocorrelation Function
Time lag kPACF(k)T-STATP-value
10.0872120.85450.197477
2-0.14613-1.43180.077728
3-0.011474-0.11240.455364
4-0.046076-0.45150.326341
5-0.145519-1.42580.078586
60.0641250.62830.265651
70.0114760.11240.455355
80.0711290.69690.243769
90.0765020.74960.227676
100.0129720.12710.449563
110.1891.85180.033563
12-0.009358-0.09170.463568
130.0289740.28390.388555
140.0559470.54820.292425
15-0.066069-0.64730.259477
16-0.047776-0.46810.320383
170.1023081.00240.159332
180.0250220.24520.403425
190.2147182.10380.019005
20-0.018043-0.17680.430024
21-0.031205-0.30570.380232
220.0222730.21820.413855
230.0049280.04830.480794
24-0.1083-1.06110.14565
250.1856481.8190.036017
260.0634170.62140.267918
27-0.079472-0.77870.219046
28-0.222078-2.17590.016008
29-0.134076-1.31370.096043
300.0662110.64870.259029
31-0.071468-0.70020.242735
32-0.070236-0.68820.246503
33-0.084014-0.82320.206228
34-0.113384-1.11090.134686
35-0.017589-0.17230.431769
36-0.00474-0.04640.481527
37-0.05664-0.5550.290109
38-0.017666-0.17310.431472
39-0.037043-0.36290.358721
400.0526520.51590.30356
41-0.042983-0.42110.337296
42-0.027833-0.27270.392833
430.0213410.20910.417409
440.0990880.97090.167028
45-0.027717-0.27160.393267
460.0048840.04780.480968
47-0.015459-0.15150.439962
48-0.025761-0.25240.400634
490.0092290.09040.464067
50-0.025022-0.24520.403424
51-0.109618-1.0740.14275
52-0.033424-0.32750.372005
530.0454390.44520.328585
54-0.009346-0.09160.463615
550.0292940.2870.387359
56-0.082675-0.810.209958
57-0.024102-0.23610.40691
580.0055410.05430.478408
590.0308540.30230.381536
600.1172461.14880.126753

\begin{tabular}{lllllllll}
\hline
Partial Autocorrelation Function \tabularnewline
Time lag k & PACF(k) & T-STAT & P-value \tabularnewline
1 & 0.087212 & 0.8545 & 0.197477 \tabularnewline
2 & -0.14613 & -1.4318 & 0.077728 \tabularnewline
3 & -0.011474 & -0.1124 & 0.455364 \tabularnewline
4 & -0.046076 & -0.4515 & 0.326341 \tabularnewline
5 & -0.145519 & -1.4258 & 0.078586 \tabularnewline
6 & 0.064125 & 0.6283 & 0.265651 \tabularnewline
7 & 0.011476 & 0.1124 & 0.455355 \tabularnewline
8 & 0.071129 & 0.6969 & 0.243769 \tabularnewline
9 & 0.076502 & 0.7496 & 0.227676 \tabularnewline
10 & 0.012972 & 0.1271 & 0.449563 \tabularnewline
11 & 0.189 & 1.8518 & 0.033563 \tabularnewline
12 & -0.009358 & -0.0917 & 0.463568 \tabularnewline
13 & 0.028974 & 0.2839 & 0.388555 \tabularnewline
14 & 0.055947 & 0.5482 & 0.292425 \tabularnewline
15 & -0.066069 & -0.6473 & 0.259477 \tabularnewline
16 & -0.047776 & -0.4681 & 0.320383 \tabularnewline
17 & 0.102308 & 1.0024 & 0.159332 \tabularnewline
18 & 0.025022 & 0.2452 & 0.403425 \tabularnewline
19 & 0.214718 & 2.1038 & 0.019005 \tabularnewline
20 & -0.018043 & -0.1768 & 0.430024 \tabularnewline
21 & -0.031205 & -0.3057 & 0.380232 \tabularnewline
22 & 0.022273 & 0.2182 & 0.413855 \tabularnewline
23 & 0.004928 & 0.0483 & 0.480794 \tabularnewline
24 & -0.1083 & -1.0611 & 0.14565 \tabularnewline
25 & 0.185648 & 1.819 & 0.036017 \tabularnewline
26 & 0.063417 & 0.6214 & 0.267918 \tabularnewline
27 & -0.079472 & -0.7787 & 0.219046 \tabularnewline
28 & -0.222078 & -2.1759 & 0.016008 \tabularnewline
29 & -0.134076 & -1.3137 & 0.096043 \tabularnewline
30 & 0.066211 & 0.6487 & 0.259029 \tabularnewline
31 & -0.071468 & -0.7002 & 0.242735 \tabularnewline
32 & -0.070236 & -0.6882 & 0.246503 \tabularnewline
33 & -0.084014 & -0.8232 & 0.206228 \tabularnewline
34 & -0.113384 & -1.1109 & 0.134686 \tabularnewline
35 & -0.017589 & -0.1723 & 0.431769 \tabularnewline
36 & -0.00474 & -0.0464 & 0.481527 \tabularnewline
37 & -0.05664 & -0.555 & 0.290109 \tabularnewline
38 & -0.017666 & -0.1731 & 0.431472 \tabularnewline
39 & -0.037043 & -0.3629 & 0.358721 \tabularnewline
40 & 0.052652 & 0.5159 & 0.30356 \tabularnewline
41 & -0.042983 & -0.4211 & 0.337296 \tabularnewline
42 & -0.027833 & -0.2727 & 0.392833 \tabularnewline
43 & 0.021341 & 0.2091 & 0.417409 \tabularnewline
44 & 0.099088 & 0.9709 & 0.167028 \tabularnewline
45 & -0.027717 & -0.2716 & 0.393267 \tabularnewline
46 & 0.004884 & 0.0478 & 0.480968 \tabularnewline
47 & -0.015459 & -0.1515 & 0.439962 \tabularnewline
48 & -0.025761 & -0.2524 & 0.400634 \tabularnewline
49 & 0.009229 & 0.0904 & 0.464067 \tabularnewline
50 & -0.025022 & -0.2452 & 0.403424 \tabularnewline
51 & -0.109618 & -1.074 & 0.14275 \tabularnewline
52 & -0.033424 & -0.3275 & 0.372005 \tabularnewline
53 & 0.045439 & 0.4452 & 0.328585 \tabularnewline
54 & -0.009346 & -0.0916 & 0.463615 \tabularnewline
55 & 0.029294 & 0.287 & 0.387359 \tabularnewline
56 & -0.082675 & -0.81 & 0.209958 \tabularnewline
57 & -0.024102 & -0.2361 & 0.40691 \tabularnewline
58 & 0.005541 & 0.0543 & 0.478408 \tabularnewline
59 & 0.030854 & 0.3023 & 0.381536 \tabularnewline
60 & 0.117246 & 1.1488 & 0.126753 \tabularnewline
\hline
\end{tabular}
%Source: https://freestatistics.org/blog/index.php?pk=124189&T=2

[TABLE]
[ROW][C]Partial Autocorrelation Function[/C][/ROW]
[ROW][C]Time lag k[/C][C]PACF(k)[/C][C]T-STAT[/C][C]P-value[/C][/ROW]
[ROW][C]1[/C][C]0.087212[/C][C]0.8545[/C][C]0.197477[/C][/ROW]
[ROW][C]2[/C][C]-0.14613[/C][C]-1.4318[/C][C]0.077728[/C][/ROW]
[ROW][C]3[/C][C]-0.011474[/C][C]-0.1124[/C][C]0.455364[/C][/ROW]
[ROW][C]4[/C][C]-0.046076[/C][C]-0.4515[/C][C]0.326341[/C][/ROW]
[ROW][C]5[/C][C]-0.145519[/C][C]-1.4258[/C][C]0.078586[/C][/ROW]
[ROW][C]6[/C][C]0.064125[/C][C]0.6283[/C][C]0.265651[/C][/ROW]
[ROW][C]7[/C][C]0.011476[/C][C]0.1124[/C][C]0.455355[/C][/ROW]
[ROW][C]8[/C][C]0.071129[/C][C]0.6969[/C][C]0.243769[/C][/ROW]
[ROW][C]9[/C][C]0.076502[/C][C]0.7496[/C][C]0.227676[/C][/ROW]
[ROW][C]10[/C][C]0.012972[/C][C]0.1271[/C][C]0.449563[/C][/ROW]
[ROW][C]11[/C][C]0.189[/C][C]1.8518[/C][C]0.033563[/C][/ROW]
[ROW][C]12[/C][C]-0.009358[/C][C]-0.0917[/C][C]0.463568[/C][/ROW]
[ROW][C]13[/C][C]0.028974[/C][C]0.2839[/C][C]0.388555[/C][/ROW]
[ROW][C]14[/C][C]0.055947[/C][C]0.5482[/C][C]0.292425[/C][/ROW]
[ROW][C]15[/C][C]-0.066069[/C][C]-0.6473[/C][C]0.259477[/C][/ROW]
[ROW][C]16[/C][C]-0.047776[/C][C]-0.4681[/C][C]0.320383[/C][/ROW]
[ROW][C]17[/C][C]0.102308[/C][C]1.0024[/C][C]0.159332[/C][/ROW]
[ROW][C]18[/C][C]0.025022[/C][C]0.2452[/C][C]0.403425[/C][/ROW]
[ROW][C]19[/C][C]0.214718[/C][C]2.1038[/C][C]0.019005[/C][/ROW]
[ROW][C]20[/C][C]-0.018043[/C][C]-0.1768[/C][C]0.430024[/C][/ROW]
[ROW][C]21[/C][C]-0.031205[/C][C]-0.3057[/C][C]0.380232[/C][/ROW]
[ROW][C]22[/C][C]0.022273[/C][C]0.2182[/C][C]0.413855[/C][/ROW]
[ROW][C]23[/C][C]0.004928[/C][C]0.0483[/C][C]0.480794[/C][/ROW]
[ROW][C]24[/C][C]-0.1083[/C][C]-1.0611[/C][C]0.14565[/C][/ROW]
[ROW][C]25[/C][C]0.185648[/C][C]1.819[/C][C]0.036017[/C][/ROW]
[ROW][C]26[/C][C]0.063417[/C][C]0.6214[/C][C]0.267918[/C][/ROW]
[ROW][C]27[/C][C]-0.079472[/C][C]-0.7787[/C][C]0.219046[/C][/ROW]
[ROW][C]28[/C][C]-0.222078[/C][C]-2.1759[/C][C]0.016008[/C][/ROW]
[ROW][C]29[/C][C]-0.134076[/C][C]-1.3137[/C][C]0.096043[/C][/ROW]
[ROW][C]30[/C][C]0.066211[/C][C]0.6487[/C][C]0.259029[/C][/ROW]
[ROW][C]31[/C][C]-0.071468[/C][C]-0.7002[/C][C]0.242735[/C][/ROW]
[ROW][C]32[/C][C]-0.070236[/C][C]-0.6882[/C][C]0.246503[/C][/ROW]
[ROW][C]33[/C][C]-0.084014[/C][C]-0.8232[/C][C]0.206228[/C][/ROW]
[ROW][C]34[/C][C]-0.113384[/C][C]-1.1109[/C][C]0.134686[/C][/ROW]
[ROW][C]35[/C][C]-0.017589[/C][C]-0.1723[/C][C]0.431769[/C][/ROW]
[ROW][C]36[/C][C]-0.00474[/C][C]-0.0464[/C][C]0.481527[/C][/ROW]
[ROW][C]37[/C][C]-0.05664[/C][C]-0.555[/C][C]0.290109[/C][/ROW]
[ROW][C]38[/C][C]-0.017666[/C][C]-0.1731[/C][C]0.431472[/C][/ROW]
[ROW][C]39[/C][C]-0.037043[/C][C]-0.3629[/C][C]0.358721[/C][/ROW]
[ROW][C]40[/C][C]0.052652[/C][C]0.5159[/C][C]0.30356[/C][/ROW]
[ROW][C]41[/C][C]-0.042983[/C][C]-0.4211[/C][C]0.337296[/C][/ROW]
[ROW][C]42[/C][C]-0.027833[/C][C]-0.2727[/C][C]0.392833[/C][/ROW]
[ROW][C]43[/C][C]0.021341[/C][C]0.2091[/C][C]0.417409[/C][/ROW]
[ROW][C]44[/C][C]0.099088[/C][C]0.9709[/C][C]0.167028[/C][/ROW]
[ROW][C]45[/C][C]-0.027717[/C][C]-0.2716[/C][C]0.393267[/C][/ROW]
[ROW][C]46[/C][C]0.004884[/C][C]0.0478[/C][C]0.480968[/C][/ROW]
[ROW][C]47[/C][C]-0.015459[/C][C]-0.1515[/C][C]0.439962[/C][/ROW]
[ROW][C]48[/C][C]-0.025761[/C][C]-0.2524[/C][C]0.400634[/C][/ROW]
[ROW][C]49[/C][C]0.009229[/C][C]0.0904[/C][C]0.464067[/C][/ROW]
[ROW][C]50[/C][C]-0.025022[/C][C]-0.2452[/C][C]0.403424[/C][/ROW]
[ROW][C]51[/C][C]-0.109618[/C][C]-1.074[/C][C]0.14275[/C][/ROW]
[ROW][C]52[/C][C]-0.033424[/C][C]-0.3275[/C][C]0.372005[/C][/ROW]
[ROW][C]53[/C][C]0.045439[/C][C]0.4452[/C][C]0.328585[/C][/ROW]
[ROW][C]54[/C][C]-0.009346[/C][C]-0.0916[/C][C]0.463615[/C][/ROW]
[ROW][C]55[/C][C]0.029294[/C][C]0.287[/C][C]0.387359[/C][/ROW]
[ROW][C]56[/C][C]-0.082675[/C][C]-0.81[/C][C]0.209958[/C][/ROW]
[ROW][C]57[/C][C]-0.024102[/C][C]-0.2361[/C][C]0.40691[/C][/ROW]
[ROW][C]58[/C][C]0.005541[/C][C]0.0543[/C][C]0.478408[/C][/ROW]
[ROW][C]59[/C][C]0.030854[/C][C]0.3023[/C][C]0.381536[/C][/ROW]
[ROW][C]60[/C][C]0.117246[/C][C]1.1488[/C][C]0.126753[/C][/ROW]
[/TABLE]
Source: https://freestatistics.org/blog/index.php?pk=124189&T=2

Globally Unique Identifier (entire table): ba.freestatistics.org/blog/index.php?pk=124189&T=2

As an alternative you can also use a QR Code:  

The GUIDs for individual cells are displayed in the table below:

Partial Autocorrelation Function
Time lag kPACF(k)T-STATP-value
10.0872120.85450.197477
2-0.14613-1.43180.077728
3-0.011474-0.11240.455364
4-0.046076-0.45150.326341
5-0.145519-1.42580.078586
60.0641250.62830.265651
70.0114760.11240.455355
80.0711290.69690.243769
90.0765020.74960.227676
100.0129720.12710.449563
110.1891.85180.033563
12-0.009358-0.09170.463568
130.0289740.28390.388555
140.0559470.54820.292425
15-0.066069-0.64730.259477
16-0.047776-0.46810.320383
170.1023081.00240.159332
180.0250220.24520.403425
190.2147182.10380.019005
20-0.018043-0.17680.430024
21-0.031205-0.30570.380232
220.0222730.21820.413855
230.0049280.04830.480794
24-0.1083-1.06110.14565
250.1856481.8190.036017
260.0634170.62140.267918
27-0.079472-0.77870.219046
28-0.222078-2.17590.016008
29-0.134076-1.31370.096043
300.0662110.64870.259029
31-0.071468-0.70020.242735
32-0.070236-0.68820.246503
33-0.084014-0.82320.206228
34-0.113384-1.11090.134686
35-0.017589-0.17230.431769
36-0.00474-0.04640.481527
37-0.05664-0.5550.290109
38-0.017666-0.17310.431472
39-0.037043-0.36290.358721
400.0526520.51590.30356
41-0.042983-0.42110.337296
42-0.027833-0.27270.392833
430.0213410.20910.417409
440.0990880.97090.167028
45-0.027717-0.27160.393267
460.0048840.04780.480968
47-0.015459-0.15150.439962
48-0.025761-0.25240.400634
490.0092290.09040.464067
50-0.025022-0.24520.403424
51-0.109618-1.0740.14275
52-0.033424-0.32750.372005
530.0454390.44520.328585
54-0.009346-0.09160.463615
550.0292940.2870.387359
56-0.082675-0.810.209958
57-0.024102-0.23610.40691
580.0055410.05430.478408
590.0308540.30230.381536
600.1172461.14880.126753


Parameters (Session):
par1 = 60 ; par2 = 1 ; par3 = 0 ; par4 = 1 ; par5 = 12 ; par6 = White Noise ; par7 = 0.95 ;
Parameters (R input):
par1 = 60 ; par2 = 1 ; par3 = 0 ; par4 = 1 ; par5 = 12 ; par6 = White Noise ; par7 = 0.95 ; par8 = ;
R code (references can be found in the software module):
if (par1 == 'Default') {
par1 = 10*log10(length(x))
} else {
par1 <- as.numeric(par1)
}
par2 <- as.numeric(par2)
par3 <- as.numeric(par3)
par4 <- as.numeric(par4)
par5 <- as.numeric(par5)
if (par6 == 'White Noise') par6 <- 'white' else par6 <- 'ma'
par7 <- as.numeric(par7)
if (par8 != '') par8 <- as.numeric(par8)
ox <- x
if (par8 == '') {
if (par2 == 0) {
x <- log(x)
} else {
x <- (x ^ par2 - 1) / par2
}
} else {
x <- log(x,base=par8)
}
if (par3 > 0) x <- diff(x,lag=1,difference=par3)
if (par4 > 0) x <- diff(x,lag=par5,difference=par4)
bitmap(file='picts.png')
op <- par(mfrow=c(2,1))
plot(ox,type='l',main='Original Time Series',xlab='time',ylab='value')
if (par8=='') {
mytitle <- paste('Working Time Series (lambda=',par2,', d=',par3,', D=',par4,')',sep='')
mysub <- paste('(lambda=',par2,', d=',par3,', D=',par4,', CI=', par7, ', CI type=',par6,')',sep='')
} else {
mytitle <- paste('Working Time Series (base=',par8,', d=',par3,', D=',par4,')',sep='')
mysub <- paste('(base=',par8,', d=',par3,', D=',par4,', CI=', par7, ', CI type=',par6,')',sep='')
}
plot(x,type='l', main=mytitle,xlab='time',ylab='value')
par(op)
dev.off()
bitmap(file='pic1.png')
racf <- acf(x, par1, main='Autocorrelation', xlab='time lag', ylab='ACF', ci.type=par6, ci=par7, sub=mysub)
dev.off()
bitmap(file='pic2.png')
rpacf <- pacf(x,par1,main='Partial Autocorrelation',xlab='lags',ylab='PACF',sub=mysub)
dev.off()
(myacf <- c(racf$acf))
(mypacf <- c(rpacf$acf))
lengthx <- length(x)
sqrtn <- sqrt(lengthx)
load(file='createtable')
a<-table.start()
a<-table.row.start(a)
a<-table.element(a,'Autocorrelation Function',4,TRUE)
a<-table.row.end(a)
a<-table.row.start(a)
a<-table.element(a,'Time lag k',header=TRUE)
a<-table.element(a,hyperlink('basics.htm','ACF(k)','click here for more information about the Autocorrelation Function'),header=TRUE)
a<-table.element(a,'T-STAT',header=TRUE)
a<-table.element(a,'P-value',header=TRUE)
a<-table.row.end(a)
for (i in 2:(par1+1)) {
a<-table.row.start(a)
a<-table.element(a,i-1,header=TRUE)
a<-table.element(a,round(myacf[i],6))
mytstat <- myacf[i]*sqrtn
a<-table.element(a,round(mytstat,4))
a<-table.element(a,round(1-pt(abs(mytstat),lengthx),6))
a<-table.row.end(a)
}
a<-table.end(a)
table.save(a,file='mytable.tab')
a<-table.start()
a<-table.row.start(a)
a<-table.element(a,'Partial Autocorrelation Function',4,TRUE)
a<-table.row.end(a)
a<-table.row.start(a)
a<-table.element(a,'Time lag k',header=TRUE)
a<-table.element(a,hyperlink('basics.htm','PACF(k)','click here for more information about the Partial Autocorrelation Function'),header=TRUE)
a<-table.element(a,'T-STAT',header=TRUE)
a<-table.element(a,'P-value',header=TRUE)
a<-table.row.end(a)
for (i in 1:par1) {
a<-table.row.start(a)
a<-table.element(a,i,header=TRUE)
a<-table.element(a,round(mypacf[i],6))
mytstat <- mypacf[i]*sqrtn
a<-table.element(a,round(mytstat,4))
a<-table.element(a,round(1-pt(abs(mytstat),lengthx),6))
a<-table.row.end(a)
}
a<-table.end(a)
table.save(a,file='mytable1.tab')