Free Statistics

of Irreproducible Research!

Author's title

Author*Unverified author*
R Software Modulerwasp_smp.wasp
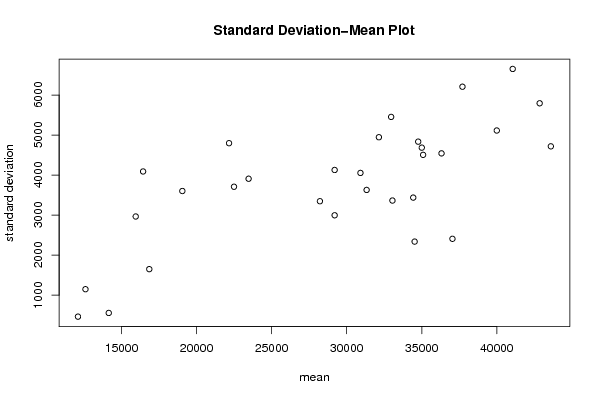
Title produced by softwareStandard Deviation-Mean Plot
Date of computationThu, 18 Aug 2011 17:18:30 -0400
Cite this page as followsStatistical Computations at FreeStatistics.org, Office for Research Development and Education, URL https://freestatistics.org/blog/index.php?v=date/2011/Aug/18/t131370244907vzufb24v2aek1.htm/, Retrieved Thu, 16 May 2024 00:17:30 +0000
Statistical Computations at FreeStatistics.org, Office for Research Development and Education, URL https://freestatistics.org/blog/index.php?pk=124164, Retrieved Thu, 16 May 2024 00:17:30 +0000
QR Codes:

Original text written by user:
IsPrivate?No (this computation is public)
User-defined keywordsVan Tongelen Caroline
Estimated Impact79
Family? (F = Feedback message, R = changed R code, M = changed R Module, P = changed Parameters, D = changed Data)
-       [Standard Deviation-Mean Plot] [TIJDREEKS A - STA...] [2011-08-18 21:18:30] [7d6606cca1b3596736d7d387043cb02b] [Current]
Feedback Forum

Post a new message
Dataseries X:
14724
14404
14058
13427
19946
19631
14724
11462
11778
11778
12093
12760
13742
13427
11462
11778
20929
22893
17666
14724
15387
15707
17351
18964
19315
16022
16369
12093
24222
27800
19631
17004
18649
20613
23555
27164
27164
24853
23871
17982
27800
32391
28462
24222
24853
27164
30426
34355
31724
30111
30111
24853
32391
37297
33373
29129
30426
35653
37964
41222
38595
34355
33373
25520
30742
36315
30111
26502
30111
33689
35653
40906
38280
31724
32391
26186
31409
36000
30742
27164
30426
34355
33689
41542
40244
35017
35333
28462
32706
39262
34355
31409
36315
39262
36982
47431
44835
38946
37297
29764
34035
37964
33053
33053
38595
41542
39924
51355
48413
42871
40560
32391
35333
40560
36631
35653
40244
44168
39924
50057


Summary of computational transaction
Raw Inputview raw input (R code)
Raw Outputview raw output of R engine
Computing time0 seconds
R Server'Gwilym Jenkins' @ jenkins.wessa.net

\begin{tabular}{lllllllll}
\hline
Summary of computational transaction \tabularnewline
Raw Input & view raw input (R code)  \tabularnewline
Raw Output & view raw output of R engine  \tabularnewline
Computing time & 0 seconds \tabularnewline
R Server & 'Gwilym Jenkins' @ jenkins.wessa.net \tabularnewline
\hline
\end{tabular}
%Source: https://freestatistics.org/blog/index.php?pk=124164&T=0

[TABLE]
[ROW][C]Summary of computational transaction[/C][/ROW]
[ROW][C]Raw Input[/C][C]view raw input (R code) [/C][/ROW]
[ROW][C]Raw Output[/C][C]view raw output of R engine [/C][/ROW]
[ROW][C]Computing time[/C][C]0 seconds[/C][/ROW]
[ROW][C]R Server[/C][C]'Gwilym Jenkins' @ jenkins.wessa.net[/C][/ROW]
[/TABLE]
Source: https://freestatistics.org/blog/index.php?pk=124164&T=0

Globally Unique Identifier (entire table): ba.freestatistics.org/blog/index.php?pk=124164&T=0

As an alternative you can also use a QR Code:  

The GUIDs for individual cells are displayed in the table below:

Summary of computational transaction
Raw Inputview raw input (R code)
Raw Outputview raw output of R engine
Computing time0 seconds
R Server'Gwilym Jenkins' @ jenkins.wessa.net


Standard Deviation-Mean Plot
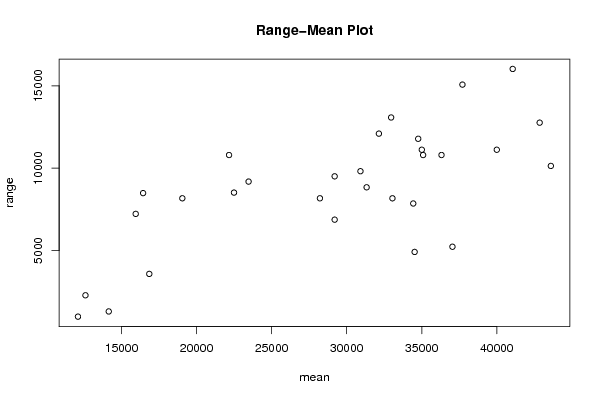
SectionMeanStandard DeviationRange
114153.25555.3205530742281297
216440.754090.625655080168484
312102.25462.960311473889982
412602.251148.738547276972280
5190533602.267156481698169
616852.251649.928761088393577
715949.752965.379051093927222
822164.254797.2752248889510796
922495.253708.404901931118515
1023467.53908.846590321339182
1128218.753347.446925145598169
1229199.54127.905239545449502
1329199.752995.932061423736871
1433047.53364.017191791198168
1536316.254542.9949280916710796
1632960.755453.5437026457113075
1730917.54054.252458838749813
1835089.754505.4066316667410795
1932145.254945.8960344242312094
2031328.753629.344970744268836
21350034685.2232248492411116
22347644835.0585656570211782
23344333437.655693443817853
2439997.55113.7699400735711116
2537710.56207.5976297866915071
2634526.252338.117672402314911
27428545794.029283092512760
2841058.756652.0143503052316022
2937044.252407.988562403625227
3043598.254718.4451093554110133

\begin{tabular}{lllllllll}
\hline
Standard Deviation-Mean Plot \tabularnewline
Section & Mean & Standard Deviation & Range \tabularnewline
1 & 14153.25 & 555.320553074228 & 1297 \tabularnewline
2 & 16440.75 & 4090.62565508016 & 8484 \tabularnewline
3 & 12102.25 & 462.960311473889 & 982 \tabularnewline
4 & 12602.25 & 1148.73854727697 & 2280 \tabularnewline
5 & 19053 & 3602.26715648169 & 8169 \tabularnewline
6 & 16852.25 & 1649.92876108839 & 3577 \tabularnewline
7 & 15949.75 & 2965.37905109392 & 7222 \tabularnewline
8 & 22164.25 & 4797.27522488895 & 10796 \tabularnewline
9 & 22495.25 & 3708.40490193111 & 8515 \tabularnewline
10 & 23467.5 & 3908.84659032133 & 9182 \tabularnewline
11 & 28218.75 & 3347.44692514559 & 8169 \tabularnewline
12 & 29199.5 & 4127.90523954544 & 9502 \tabularnewline
13 & 29199.75 & 2995.93206142373 & 6871 \tabularnewline
14 & 33047.5 & 3364.01719179119 & 8168 \tabularnewline
15 & 36316.25 & 4542.99492809167 & 10796 \tabularnewline
16 & 32960.75 & 5453.54370264571 & 13075 \tabularnewline
17 & 30917.5 & 4054.25245883874 & 9813 \tabularnewline
18 & 35089.75 & 4505.40663166674 & 10795 \tabularnewline
19 & 32145.25 & 4945.89603442423 & 12094 \tabularnewline
20 & 31328.75 & 3629.34497074426 & 8836 \tabularnewline
21 & 35003 & 4685.22322484924 & 11116 \tabularnewline
22 & 34764 & 4835.05856565702 & 11782 \tabularnewline
23 & 34433 & 3437.65569344381 & 7853 \tabularnewline
24 & 39997.5 & 5113.76994007357 & 11116 \tabularnewline
25 & 37710.5 & 6207.59762978669 & 15071 \tabularnewline
26 & 34526.25 & 2338.11767240231 & 4911 \tabularnewline
27 & 42854 & 5794.0292830925 & 12760 \tabularnewline
28 & 41058.75 & 6652.01435030523 & 16022 \tabularnewline
29 & 37044.25 & 2407.98856240362 & 5227 \tabularnewline
30 & 43598.25 & 4718.44510935541 & 10133 \tabularnewline
\hline
\end{tabular}
%Source: https://freestatistics.org/blog/index.php?pk=124164&T=1

[TABLE]
[ROW][C]Standard Deviation-Mean Plot[/C][/ROW]
[ROW][C]Section[/C][C]Mean[/C][C]Standard Deviation[/C][C]Range[/C][/ROW]
[ROW][C]1[/C][C]14153.25[/C][C]555.320553074228[/C][C]1297[/C][/ROW]
[ROW][C]2[/C][C]16440.75[/C][C]4090.62565508016[/C][C]8484[/C][/ROW]
[ROW][C]3[/C][C]12102.25[/C][C]462.960311473889[/C][C]982[/C][/ROW]
[ROW][C]4[/C][C]12602.25[/C][C]1148.73854727697[/C][C]2280[/C][/ROW]
[ROW][C]5[/C][C]19053[/C][C]3602.26715648169[/C][C]8169[/C][/ROW]
[ROW][C]6[/C][C]16852.25[/C][C]1649.92876108839[/C][C]3577[/C][/ROW]
[ROW][C]7[/C][C]15949.75[/C][C]2965.37905109392[/C][C]7222[/C][/ROW]
[ROW][C]8[/C][C]22164.25[/C][C]4797.27522488895[/C][C]10796[/C][/ROW]
[ROW][C]9[/C][C]22495.25[/C][C]3708.40490193111[/C][C]8515[/C][/ROW]
[ROW][C]10[/C][C]23467.5[/C][C]3908.84659032133[/C][C]9182[/C][/ROW]
[ROW][C]11[/C][C]28218.75[/C][C]3347.44692514559[/C][C]8169[/C][/ROW]
[ROW][C]12[/C][C]29199.5[/C][C]4127.90523954544[/C][C]9502[/C][/ROW]
[ROW][C]13[/C][C]29199.75[/C][C]2995.93206142373[/C][C]6871[/C][/ROW]
[ROW][C]14[/C][C]33047.5[/C][C]3364.01719179119[/C][C]8168[/C][/ROW]
[ROW][C]15[/C][C]36316.25[/C][C]4542.99492809167[/C][C]10796[/C][/ROW]
[ROW][C]16[/C][C]32960.75[/C][C]5453.54370264571[/C][C]13075[/C][/ROW]
[ROW][C]17[/C][C]30917.5[/C][C]4054.25245883874[/C][C]9813[/C][/ROW]
[ROW][C]18[/C][C]35089.75[/C][C]4505.40663166674[/C][C]10795[/C][/ROW]
[ROW][C]19[/C][C]32145.25[/C][C]4945.89603442423[/C][C]12094[/C][/ROW]
[ROW][C]20[/C][C]31328.75[/C][C]3629.34497074426[/C][C]8836[/C][/ROW]
[ROW][C]21[/C][C]35003[/C][C]4685.22322484924[/C][C]11116[/C][/ROW]
[ROW][C]22[/C][C]34764[/C][C]4835.05856565702[/C][C]11782[/C][/ROW]
[ROW][C]23[/C][C]34433[/C][C]3437.65569344381[/C][C]7853[/C][/ROW]
[ROW][C]24[/C][C]39997.5[/C][C]5113.76994007357[/C][C]11116[/C][/ROW]
[ROW][C]25[/C][C]37710.5[/C][C]6207.59762978669[/C][C]15071[/C][/ROW]
[ROW][C]26[/C][C]34526.25[/C][C]2338.11767240231[/C][C]4911[/C][/ROW]
[ROW][C]27[/C][C]42854[/C][C]5794.0292830925[/C][C]12760[/C][/ROW]
[ROW][C]28[/C][C]41058.75[/C][C]6652.01435030523[/C][C]16022[/C][/ROW]
[ROW][C]29[/C][C]37044.25[/C][C]2407.98856240362[/C][C]5227[/C][/ROW]
[ROW][C]30[/C][C]43598.25[/C][C]4718.44510935541[/C][C]10133[/C][/ROW]
[/TABLE]
Source: https://freestatistics.org/blog/index.php?pk=124164&T=1

Globally Unique Identifier (entire table): ba.freestatistics.org/blog/index.php?pk=124164&T=1

As an alternative you can also use a QR Code:  

The GUIDs for individual cells are displayed in the table below:

Standard Deviation-Mean Plot
SectionMeanStandard DeviationRange
114153.25555.3205530742281297
216440.754090.625655080168484
312102.25462.960311473889982
412602.251148.738547276972280
5190533602.267156481698169
616852.251649.928761088393577
715949.752965.379051093927222
822164.254797.2752248889510796
922495.253708.404901931118515
1023467.53908.846590321339182
1128218.753347.446925145598169
1229199.54127.905239545449502
1329199.752995.932061423736871
1433047.53364.017191791198168
1536316.254542.9949280916710796
1632960.755453.5437026457113075
1730917.54054.252458838749813
1835089.754505.4066316667410795
1932145.254945.8960344242312094
2031328.753629.344970744268836
21350034685.2232248492411116
22347644835.0585656570211782
23344333437.655693443817853
2439997.55113.7699400735711116
2537710.56207.5976297866915071
2634526.252338.117672402314911
27428545794.029283092512760
2841058.756652.0143503052316022
2937044.252407.988562403625227
3043598.254718.4451093554110133


Regression: S.E.(k) = alpha + beta * Mean(k)
alpha421.095090871136
beta0.11594176156199
S.D.0.0217241488388439
T-STAT5.33699904295815
p-value1.10451492729493e-05

\begin{tabular}{lllllllll}
\hline
Regression: S.E.(k) = alpha + beta * Mean(k) \tabularnewline
alpha & 421.095090871136 \tabularnewline
beta & 0.11594176156199 \tabularnewline
S.D. & 0.0217241488388439 \tabularnewline
T-STAT & 5.33699904295815 \tabularnewline
p-value & 1.10451492729493e-05 \tabularnewline
\hline
\end{tabular}
%Source: https://freestatistics.org/blog/index.php?pk=124164&T=2

[TABLE]
[ROW][C]Regression: S.E.(k) = alpha + beta * Mean(k)[/C][/ROW]
[ROW][C]alpha[/C][C]421.095090871136[/C][/ROW]
[ROW][C]beta[/C][C]0.11594176156199[/C][/ROW]
[ROW][C]S.D.[/C][C]0.0217241488388439[/C][/ROW]
[ROW][C]T-STAT[/C][C]5.33699904295815[/C][/ROW]
[ROW][C]p-value[/C][C]1.10451492729493e-05[/C][/ROW]
[/TABLE]
Source: https://freestatistics.org/blog/index.php?pk=124164&T=2

Globally Unique Identifier (entire table): ba.freestatistics.org/blog/index.php?pk=124164&T=2

As an alternative you can also use a QR Code:  

The GUIDs for individual cells are displayed in the table below:

Regression: S.E.(k) = alpha + beta * Mean(k)
alpha421.095090871136
beta0.11594176156199
S.D.0.0217241488388439
T-STAT5.33699904295815
p-value1.10451492729493e-05


Regression: ln S.E.(k) = alpha + beta * ln Mean(k)
alpha-4.64468099715125
beta1.24790253350852
S.D.0.210505018812311
T-STAT5.92813672827993
p-value2.22080456527266e-06
Lambda-0.247902533508522

\begin{tabular}{lllllllll}
\hline
Regression: ln S.E.(k) = alpha + beta * ln Mean(k) \tabularnewline
alpha & -4.64468099715125 \tabularnewline
beta & 1.24790253350852 \tabularnewline
S.D. & 0.210505018812311 \tabularnewline
T-STAT & 5.92813672827993 \tabularnewline
p-value & 2.22080456527266e-06 \tabularnewline
Lambda & -0.247902533508522 \tabularnewline
\hline
\end{tabular}
%Source: https://freestatistics.org/blog/index.php?pk=124164&T=3

[TABLE]
[ROW][C]Regression: ln S.E.(k) = alpha + beta * ln Mean(k)[/C][/ROW]
[ROW][C]alpha[/C][C]-4.64468099715125[/C][/ROW]
[ROW][C]beta[/C][C]1.24790253350852[/C][/ROW]
[ROW][C]S.D.[/C][C]0.210505018812311[/C][/ROW]
[ROW][C]T-STAT[/C][C]5.92813672827993[/C][/ROW]
[ROW][C]p-value[/C][C]2.22080456527266e-06[/C][/ROW]
[ROW][C]Lambda[/C][C]-0.247902533508522[/C][/ROW]
[/TABLE]
Source: https://freestatistics.org/blog/index.php?pk=124164&T=3

Globally Unique Identifier (entire table): ba.freestatistics.org/blog/index.php?pk=124164&T=3

As an alternative you can also use a QR Code:  

The GUIDs for individual cells are displayed in the table below:

Regression: ln S.E.(k) = alpha + beta * ln Mean(k)
alpha-4.64468099715125
beta1.24790253350852
S.D.0.210505018812311
T-STAT5.92813672827993
p-value2.22080456527266e-06
Lambda-0.247902533508522


Parameters (Session):
par1 = 4 ;
Parameters (R input):
par1 = 4 ;
R code (references can be found in the software module):
par1 <- as.numeric(par1)
(n <- length(x))
(np <- floor(n / par1))
arr <- array(NA,dim=c(par1,np))
j <- 0
k <- 1
for (i in 1:(np*par1))
{
j = j + 1
arr[j,k] <- x[i]
if (j == par1) {
j = 0
k=k+1
}
}
arr
arr.mean <- array(NA,dim=np)
arr.sd <- array(NA,dim=np)
arr.range <- array(NA,dim=np)
for (j in 1:np)
{
arr.mean[j] <- mean(arr[,j],na.rm=TRUE)
arr.sd[j] <- sd(arr[,j],na.rm=TRUE)
arr.range[j] <- max(arr[,j],na.rm=TRUE) - min(arr[,j],na.rm=TRUE)
}
arr.mean
arr.sd
arr.range
(lm1 <- lm(arr.sd~arr.mean))
(lnlm1 <- lm(log(arr.sd)~log(arr.mean)))
(lm2 <- lm(arr.range~arr.mean))
bitmap(file='test1.png')
plot(arr.mean,arr.sd,main='Standard Deviation-Mean Plot',xlab='mean',ylab='standard deviation')
dev.off()
bitmap(file='test2.png')
plot(arr.mean,arr.range,main='Range-Mean Plot',xlab='mean',ylab='range')
dev.off()
load(file='createtable')
a<-table.start()
a<-table.row.start(a)
a<-table.element(a,'Standard Deviation-Mean Plot',4,TRUE)
a<-table.row.end(a)
a<-table.row.start(a)
a<-table.element(a,'Section',header=TRUE)
a<-table.element(a,'Mean',header=TRUE)
a<-table.element(a,'Standard Deviation',header=TRUE)
a<-table.element(a,'Range',header=TRUE)
a<-table.row.end(a)
for (j in 1:np) {
a<-table.row.start(a)
a<-table.element(a,j,header=TRUE)
a<-table.element(a,arr.mean[j])
a<-table.element(a,arr.sd[j] )
a<-table.element(a,arr.range[j] )
a<-table.row.end(a)
}
a<-table.end(a)
table.save(a,file='mytable.tab')
a<-table.start()
a<-table.row.start(a)
a<-table.element(a,'Regression: S.E.(k) = alpha + beta * Mean(k)',2,TRUE)
a<-table.row.end(a)
a<-table.row.start(a)
a<-table.element(a,'alpha',header=TRUE)
a<-table.element(a,lm1$coefficients[[1]])
a<-table.row.end(a)
a<-table.row.start(a)
a<-table.element(a,'beta',header=TRUE)
a<-table.element(a,lm1$coefficients[[2]])
a<-table.row.end(a)
a<-table.row.start(a)
a<-table.element(a,'S.D.',header=TRUE)
a<-table.element(a,summary(lm1)$coefficients[2,2])
a<-table.row.end(a)
a<-table.row.start(a)
a<-table.element(a,'T-STAT',header=TRUE)
a<-table.element(a,summary(lm1)$coefficients[2,3])
a<-table.row.end(a)
a<-table.row.start(a)
a<-table.element(a,'p-value',header=TRUE)
a<-table.element(a,summary(lm1)$coefficients[2,4])
a<-table.row.end(a)
a<-table.end(a)
table.save(a,file='mytable1.tab')
a<-table.start()
a<-table.row.start(a)
a<-table.element(a,'Regression: ln S.E.(k) = alpha + beta * ln Mean(k)',2,TRUE)
a<-table.row.end(a)
a<-table.row.start(a)
a<-table.element(a,'alpha',header=TRUE)
a<-table.element(a,lnlm1$coefficients[[1]])
a<-table.row.end(a)
a<-table.row.start(a)
a<-table.element(a,'beta',header=TRUE)
a<-table.element(a,lnlm1$coefficients[[2]])
a<-table.row.end(a)
a<-table.row.start(a)
a<-table.element(a,'S.D.',header=TRUE)
a<-table.element(a,summary(lnlm1)$coefficients[2,2])
a<-table.row.end(a)
a<-table.row.start(a)
a<-table.element(a,'T-STAT',header=TRUE)
a<-table.element(a,summary(lnlm1)$coefficients[2,3])
a<-table.row.end(a)
a<-table.row.start(a)
a<-table.element(a,'p-value',header=TRUE)
a<-table.element(a,summary(lnlm1)$coefficients[2,4])
a<-table.row.end(a)
a<-table.row.start(a)
a<-table.element(a,'Lambda',header=TRUE)
a<-table.element(a,1-lnlm1$coefficients[[2]])
a<-table.row.end(a)
a<-table.end(a)
table.save(a,file='mytable2.tab')