Free Statistics

of Irreproducible Research!

Author's title

Author*Unverified author*
R Software Modulerwasp_smp.wasp
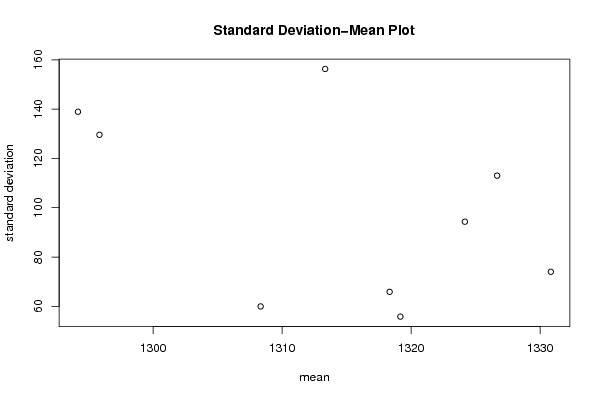
Title produced by softwareStandard Deviation-Mean Plot
Date of computationThu, 18 Aug 2011 16:51:56 -0400
Cite this page as followsStatistical Computations at FreeStatistics.org, Office for Research Development and Education, URL https://freestatistics.org/blog/index.php?v=date/2011/Aug/18/t13137007308r5ixqmbkeieizf.htm/, Retrieved Wed, 15 May 2024 09:45:15 +0000
Statistical Computations at FreeStatistics.org, Office for Research Development and Education, URL https://freestatistics.org/blog/index.php?pk=124160, Retrieved Wed, 15 May 2024 09:45:15 +0000
QR Codes:

Original text written by user:
IsPrivate?No (this computation is public)
User-defined keywordsGregory Goris
Estimated Impact83
Family? (F = Feedback message, R = changed R code, M = changed R Module, P = changed Parameters, D = changed Data)
-       [Standard Deviation-Mean Plot] [Tijdreeks B - Sta...] [2011-08-18 20:51:56] [4069dbe0e58b4004934f5f5b0dc60f40] [Current]
Feedback Forum

Post a new message
Dataseries X:
1220
1250
1350
1380
1310
1350
1360
1230
1330
1330
1380
1340
1220
1230
1400
1320
1320
1380
1340
1220
1310
1280
1330
1350
1240
1260
1340
1270
1330
1440
1350
1220
1310
1350
1300
1410
1260
1210
1410
1240
1360
1420
1310
1360
1260
1410
1330
1400
1240
1280
1460
1250
1340
1440
1170
1420
1250
1390
1260
1390
1290
1310
1540
1250
1320
1430
1080
1370
1290
1380
1260
1400
1250
1290
1550
1200
1320
1500
1060
1220
1260
1270
1280
1350
1320
1350
1530
1150
1270
1460
1000
1290
1330
1180
1350
1300
1350
1350
1540
1180
1280
1520
960
1420
1370
1210
1320
1260


Summary of computational transaction
Raw Inputview raw input (R code)
Raw Outputview raw output of R engine
Computing time0 seconds
R Server'Gertrude Mary Cox' @ cox.wessa.net

\begin{tabular}{lllllllll}
\hline
Summary of computational transaction \tabularnewline
Raw Input & view raw input (R code)  \tabularnewline
Raw Output & view raw output of R engine  \tabularnewline
Computing time & 0 seconds \tabularnewline
R Server & 'Gertrude Mary Cox' @ cox.wessa.net \tabularnewline
\hline
\end{tabular}
%Source: https://freestatistics.org/blog/index.php?pk=124160&T=0

[TABLE]
[ROW][C]Summary of computational transaction[/C][/ROW]
[ROW][C]Raw Input[/C][C]view raw input (R code) [/C][/ROW]
[ROW][C]Raw Output[/C][C]view raw output of R engine [/C][/ROW]
[ROW][C]Computing time[/C][C]0 seconds[/C][/ROW]
[ROW][C]R Server[/C][C]'Gertrude Mary Cox' @ cox.wessa.net[/C][/ROW]
[/TABLE]
Source: https://freestatistics.org/blog/index.php?pk=124160&T=0

Globally Unique Identifier (entire table): ba.freestatistics.org/blog/index.php?pk=124160&T=0

As an alternative you can also use a QR Code:  

The GUIDs for individual cells are displayed in the table below:

Summary of computational transaction
Raw Inputview raw input (R code)
Raw Outputview raw output of R engine
Computing time0 seconds
R Server'Gertrude Mary Cox' @ cox.wessa.net


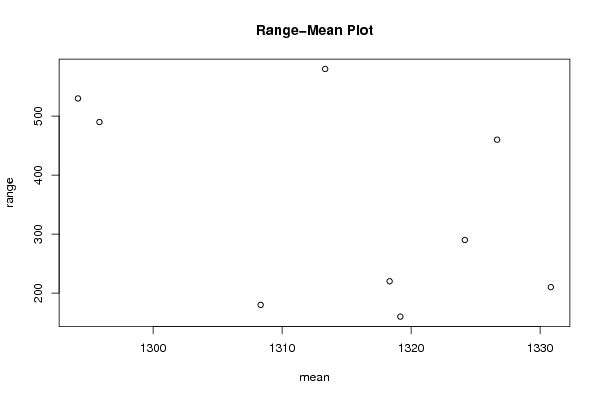
Standard Deviation-Mean Plot
SectionMeanStandard DeviationRange
11319.1666666666755.833898685514160
21308.3333333333359.9747421584261180
31318.3333333333365.8970730945179220
41330.8333333333374.034185387972210
51324.1666666666794.3357960916344290
61326.66666666667113.003083894631460
71295.83333333333129.576817043604490
81294.16666666667138.921713292928530
91313.33333333333156.282572362508580

\begin{tabular}{lllllllll}
\hline
Standard Deviation-Mean Plot \tabularnewline
Section & Mean & Standard Deviation & Range \tabularnewline
1 & 1319.16666666667 & 55.833898685514 & 160 \tabularnewline
2 & 1308.33333333333 & 59.9747421584261 & 180 \tabularnewline
3 & 1318.33333333333 & 65.8970730945179 & 220 \tabularnewline
4 & 1330.83333333333 & 74.034185387972 & 210 \tabularnewline
5 & 1324.16666666667 & 94.3357960916344 & 290 \tabularnewline
6 & 1326.66666666667 & 113.003083894631 & 460 \tabularnewline
7 & 1295.83333333333 & 129.576817043604 & 490 \tabularnewline
8 & 1294.16666666667 & 138.921713292928 & 530 \tabularnewline
9 & 1313.33333333333 & 156.282572362508 & 580 \tabularnewline
\hline
\end{tabular}
%Source: https://freestatistics.org/blog/index.php?pk=124160&T=1

[TABLE]
[ROW][C]Standard Deviation-Mean Plot[/C][/ROW]
[ROW][C]Section[/C][C]Mean[/C][C]Standard Deviation[/C][C]Range[/C][/ROW]
[ROW][C]1[/C][C]1319.16666666667[/C][C]55.833898685514[/C][C]160[/C][/ROW]
[ROW][C]2[/C][C]1308.33333333333[/C][C]59.9747421584261[/C][C]180[/C][/ROW]
[ROW][C]3[/C][C]1318.33333333333[/C][C]65.8970730945179[/C][C]220[/C][/ROW]
[ROW][C]4[/C][C]1330.83333333333[/C][C]74.034185387972[/C][C]210[/C][/ROW]
[ROW][C]5[/C][C]1324.16666666667[/C][C]94.3357960916344[/C][C]290[/C][/ROW]
[ROW][C]6[/C][C]1326.66666666667[/C][C]113.003083894631[/C][C]460[/C][/ROW]
[ROW][C]7[/C][C]1295.83333333333[/C][C]129.576817043604[/C][C]490[/C][/ROW]
[ROW][C]8[/C][C]1294.16666666667[/C][C]138.921713292928[/C][C]530[/C][/ROW]
[ROW][C]9[/C][C]1313.33333333333[/C][C]156.282572362508[/C][C]580[/C][/ROW]
[/TABLE]
Source: https://freestatistics.org/blog/index.php?pk=124160&T=1

Globally Unique Identifier (entire table): ba.freestatistics.org/blog/index.php?pk=124160&T=1

As an alternative you can also use a QR Code:  

The GUIDs for individual cells are displayed in the table below:

Standard Deviation-Mean Plot
SectionMeanStandard DeviationRange
11319.1666666666755.833898685514160
21308.3333333333359.9747421584261180
31318.3333333333365.8970730945179220
41330.8333333333374.034185387972210
51324.1666666666794.3357960916344290
61326.66666666667113.003083894631460
71295.83333333333129.576817043604490
81294.16666666667138.921713292928530
91313.33333333333156.282572362508580


Regression: S.E.(k) = alpha + beta * Mean(k)
alpha1875.53291689716
beta-1.35171681651583
S.D.0.959422774848867
T-STAT-1.40888547984361
p-value0.201706432704721

\begin{tabular}{lllllllll}
\hline
Regression: S.E.(k) = alpha + beta * Mean(k) \tabularnewline
alpha & 1875.53291689716 \tabularnewline
beta & -1.35171681651583 \tabularnewline
S.D. & 0.959422774848867 \tabularnewline
T-STAT & -1.40888547984361 \tabularnewline
p-value & 0.201706432704721 \tabularnewline
\hline
\end{tabular}
%Source: https://freestatistics.org/blog/index.php?pk=124160&T=2

[TABLE]
[ROW][C]Regression: S.E.(k) = alpha + beta * Mean(k)[/C][/ROW]
[ROW][C]alpha[/C][C]1875.53291689716[/C][/ROW]
[ROW][C]beta[/C][C]-1.35171681651583[/C][/ROW]
[ROW][C]S.D.[/C][C]0.959422774848867[/C][/ROW]
[ROW][C]T-STAT[/C][C]-1.40888547984361[/C][/ROW]
[ROW][C]p-value[/C][C]0.201706432704721[/C][/ROW]
[/TABLE]
Source: https://freestatistics.org/blog/index.php?pk=124160&T=2

Globally Unique Identifier (entire table): ba.freestatistics.org/blog/index.php?pk=124160&T=2

As an alternative you can also use a QR Code:  

The GUIDs for individual cells are displayed in the table below:

Regression: S.E.(k) = alpha + beta * Mean(k)
alpha1875.53291689716
beta-1.35171681651583
S.D.0.959422774848867
T-STAT-1.40888547984361
p-value0.201706432704721


Regression: ln S.E.(k) = alpha + beta * ln Mean(k)
alpha124.98570791827
beta-16.7743376452963
S.D.13.3853422562682
T-STAT-1.25318705522387
p-value0.250373809051612
Lambda17.7743376452963

\begin{tabular}{lllllllll}
\hline
Regression: ln S.E.(k) = alpha + beta * ln Mean(k) \tabularnewline
alpha & 124.98570791827 \tabularnewline
beta & -16.7743376452963 \tabularnewline
S.D. & 13.3853422562682 \tabularnewline
T-STAT & -1.25318705522387 \tabularnewline
p-value & 0.250373809051612 \tabularnewline
Lambda & 17.7743376452963 \tabularnewline
\hline
\end{tabular}
%Source: https://freestatistics.org/blog/index.php?pk=124160&T=3

[TABLE]
[ROW][C]Regression: ln S.E.(k) = alpha + beta * ln Mean(k)[/C][/ROW]
[ROW][C]alpha[/C][C]124.98570791827[/C][/ROW]
[ROW][C]beta[/C][C]-16.7743376452963[/C][/ROW]
[ROW][C]S.D.[/C][C]13.3853422562682[/C][/ROW]
[ROW][C]T-STAT[/C][C]-1.25318705522387[/C][/ROW]
[ROW][C]p-value[/C][C]0.250373809051612[/C][/ROW]
[ROW][C]Lambda[/C][C]17.7743376452963[/C][/ROW]
[/TABLE]
Source: https://freestatistics.org/blog/index.php?pk=124160&T=3

Globally Unique Identifier (entire table): ba.freestatistics.org/blog/index.php?pk=124160&T=3

As an alternative you can also use a QR Code:  

The GUIDs for individual cells are displayed in the table below:

Regression: ln S.E.(k) = alpha + beta * ln Mean(k)
alpha124.98570791827
beta-16.7743376452963
S.D.13.3853422562682
T-STAT-1.25318705522387
p-value0.250373809051612
Lambda17.7743376452963


Parameters (Session):
par1 = 12 ;
Parameters (R input):
par1 = 12 ;
R code (references can be found in the software module):
par1 <- as.numeric(par1)
(n <- length(x))
(np <- floor(n / par1))
arr <- array(NA,dim=c(par1,np))
j <- 0
k <- 1
for (i in 1:(np*par1))
{
j = j + 1
arr[j,k] <- x[i]
if (j == par1) {
j = 0
k=k+1
}
}
arr
arr.mean <- array(NA,dim=np)
arr.sd <- array(NA,dim=np)
arr.range <- array(NA,dim=np)
for (j in 1:np)
{
arr.mean[j] <- mean(arr[,j],na.rm=TRUE)
arr.sd[j] <- sd(arr[,j],na.rm=TRUE)
arr.range[j] <- max(arr[,j],na.rm=TRUE) - min(arr[,j],na.rm=TRUE)
}
arr.mean
arr.sd
arr.range
(lm1 <- lm(arr.sd~arr.mean))
(lnlm1 <- lm(log(arr.sd)~log(arr.mean)))
(lm2 <- lm(arr.range~arr.mean))
bitmap(file='test1.png')
plot(arr.mean,arr.sd,main='Standard Deviation-Mean Plot',xlab='mean',ylab='standard deviation')
dev.off()
bitmap(file='test2.png')
plot(arr.mean,arr.range,main='Range-Mean Plot',xlab='mean',ylab='range')
dev.off()
load(file='createtable')
a<-table.start()
a<-table.row.start(a)
a<-table.element(a,'Standard Deviation-Mean Plot',4,TRUE)
a<-table.row.end(a)
a<-table.row.start(a)
a<-table.element(a,'Section',header=TRUE)
a<-table.element(a,'Mean',header=TRUE)
a<-table.element(a,'Standard Deviation',header=TRUE)
a<-table.element(a,'Range',header=TRUE)
a<-table.row.end(a)
for (j in 1:np) {
a<-table.row.start(a)
a<-table.element(a,j,header=TRUE)
a<-table.element(a,arr.mean[j])
a<-table.element(a,arr.sd[j] )
a<-table.element(a,arr.range[j] )
a<-table.row.end(a)
}
a<-table.end(a)
table.save(a,file='mytable.tab')
a<-table.start()
a<-table.row.start(a)
a<-table.element(a,'Regression: S.E.(k) = alpha + beta * Mean(k)',2,TRUE)
a<-table.row.end(a)
a<-table.row.start(a)
a<-table.element(a,'alpha',header=TRUE)
a<-table.element(a,lm1$coefficients[[1]])
a<-table.row.end(a)
a<-table.row.start(a)
a<-table.element(a,'beta',header=TRUE)
a<-table.element(a,lm1$coefficients[[2]])
a<-table.row.end(a)
a<-table.row.start(a)
a<-table.element(a,'S.D.',header=TRUE)
a<-table.element(a,summary(lm1)$coefficients[2,2])
a<-table.row.end(a)
a<-table.row.start(a)
a<-table.element(a,'T-STAT',header=TRUE)
a<-table.element(a,summary(lm1)$coefficients[2,3])
a<-table.row.end(a)
a<-table.row.start(a)
a<-table.element(a,'p-value',header=TRUE)
a<-table.element(a,summary(lm1)$coefficients[2,4])
a<-table.row.end(a)
a<-table.end(a)
table.save(a,file='mytable1.tab')
a<-table.start()
a<-table.row.start(a)
a<-table.element(a,'Regression: ln S.E.(k) = alpha + beta * ln Mean(k)',2,TRUE)
a<-table.row.end(a)
a<-table.row.start(a)
a<-table.element(a,'alpha',header=TRUE)
a<-table.element(a,lnlm1$coefficients[[1]])
a<-table.row.end(a)
a<-table.row.start(a)
a<-table.element(a,'beta',header=TRUE)
a<-table.element(a,lnlm1$coefficients[[2]])
a<-table.row.end(a)
a<-table.row.start(a)
a<-table.element(a,'S.D.',header=TRUE)
a<-table.element(a,summary(lnlm1)$coefficients[2,2])
a<-table.row.end(a)
a<-table.row.start(a)
a<-table.element(a,'T-STAT',header=TRUE)
a<-table.element(a,summary(lnlm1)$coefficients[2,3])
a<-table.row.end(a)
a<-table.row.start(a)
a<-table.element(a,'p-value',header=TRUE)
a<-table.element(a,summary(lnlm1)$coefficients[2,4])
a<-table.row.end(a)
a<-table.row.start(a)
a<-table.element(a,'Lambda',header=TRUE)
a<-table.element(a,1-lnlm1$coefficients[[2]])
a<-table.row.end(a)
a<-table.end(a)
table.save(a,file='mytable2.tab')