Free Statistics

of Irreproducible Research!

Author's title

Author*Unverified author*
R Software Modulerwasp_autocorrelation.wasp
Title produced by software(Partial) Autocorrelation Function
Date of computationThu, 18 Aug 2011 16:06:34 -0400
Cite this page as followsStatistical Computations at FreeStatistics.org, Office for Research Development and Education, URL https://freestatistics.org/blog/index.php?v=date/2011/Aug/18/t1313698207ct8ba71gsbo7imb.htm/, Retrieved Wed, 15 May 2024 23:20:47 +0000
Statistical Computations at FreeStatistics.org, Office for Research Development and Education, URL https://freestatistics.org/blog/index.php?pk=124146, Retrieved Wed, 15 May 2024 23:20:47 +0000
QR Codes:

Original text written by user:
IsPrivate?No (this computation is public)
User-defined keywordsMorel Sarah
Estimated Impact106
Family? (F = Feedback message, R = changed R code, M = changed R Module, P = changed Parameters, D = changed Data)
-       [(Partial) Autocorrelation Function] [autocorrelatie re...] [2011-08-18 20:06:34] [d41d8cd98f00b204e9800998ecf8427e] [Current]
Feedback Forum

Post a new message
Dataseries X:
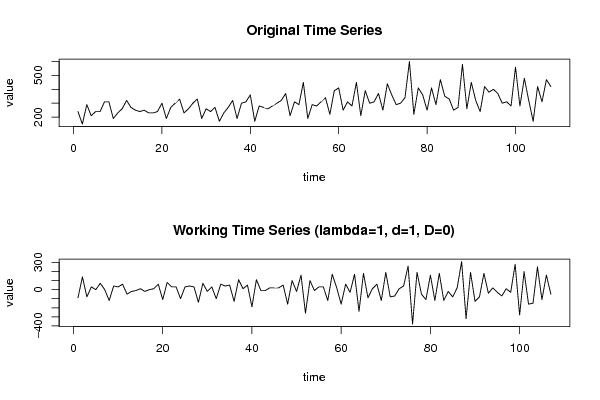
240
150
290
210
240
240
310
310
190
230
260
320
270
250
240
250
230
230
240
300
190
270
300
330
230
260
300
330
190
260
240
270
170
230
270
320
190
300
310
360
170
280
270
260
280
300
320
370
210
310
290
450
190
290
280
310
340
220
390
410
250
310
280
450
210
390
300
310
370
250
440
360
290
300
340
600
220
410
360
250
410
290
470
350
330
250
270
580
260
450
320
240
420
380
400
370
300
310
280
560
280
480
320
170
420
310
470
420


Summary of computational transaction
Raw Inputview raw input (R code)
Raw Outputview raw output of R engine
Computing time2 seconds
R Server'Gertrude Mary Cox' @ cox.wessa.net

\begin{tabular}{lllllllll}
\hline
Summary of computational transaction \tabularnewline
Raw Input & view raw input (R code)  \tabularnewline
Raw Output & view raw output of R engine  \tabularnewline
Computing time & 2 seconds \tabularnewline
R Server & 'Gertrude Mary Cox' @ cox.wessa.net \tabularnewline
\hline
\end{tabular}
%Source: https://freestatistics.org/blog/index.php?pk=124146&T=0

[TABLE]
[ROW][C]Summary of computational transaction[/C][/ROW]
[ROW][C]Raw Input[/C][C]view raw input (R code) [/C][/ROW]
[ROW][C]Raw Output[/C][C]view raw output of R engine [/C][/ROW]
[ROW][C]Computing time[/C][C]2 seconds[/C][/ROW]
[ROW][C]R Server[/C][C]'Gertrude Mary Cox' @ cox.wessa.net[/C][/ROW]
[/TABLE]
Source: https://freestatistics.org/blog/index.php?pk=124146&T=0

Globally Unique Identifier (entire table): ba.freestatistics.org/blog/index.php?pk=124146&T=0

As an alternative you can also use a QR Code:  

The GUIDs for individual cells are displayed in the table below:

Summary of computational transaction
Raw Inputview raw input (R code)
Raw Outputview raw output of R engine
Computing time2 seconds
R Server'Gertrude Mary Cox' @ cox.wessa.net


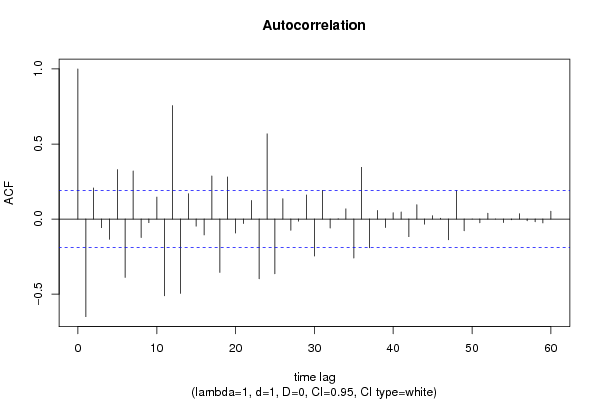
Autocorrelation Function
Time lag kACF(k)T-STATP-value
1-0.650236-6.72610
20.20692.14020.017306
3-0.057026-0.58990.278258
4-0.135183-1.39830.082451
50.3295863.40930.00046
6-0.388739-4.02115.4e-05
70.3203093.31330.000629
8-0.122963-1.27190.103076
9-0.023776-0.24590.403099
100.1462111.51240.066688
11-0.510635-5.2820
120.755477.81460
13-0.495027-5.12061e-06
140.1690291.74840.041627
15-0.04701-0.48630.313885
16-0.105603-1.09240.138563
170.2863422.96190.001883
18-0.355522-3.67750.000185
190.2801942.89830.002276
20-0.092712-0.9590.169855
21-0.029963-0.30990.378607
220.1234361.27680.102212
23-0.397797-4.11483.8e-05
240.5675215.87050
25-0.364616-3.77160.000133
260.1358221.4050.081465
27-0.07467-0.77240.220792
28-0.013823-0.1430.443283
290.1599011.6540.050526
30-0.246768-2.55260.006052
310.1910141.97590.025372
32-0.059373-0.61420.270205
330.0019640.02030.491917
340.0678090.70140.242283
35-0.25998-2.68930.004154
360.3442513.5610.000276
37-0.191833-1.98430.024889
380.056740.58690.279245
39-0.056883-0.58840.278752
400.0424520.43910.330727
410.0472670.48890.312946
42-0.11728-1.21320.113872
430.0956070.9890.162455
44-0.033712-0.34870.363994
450.0224940.23270.408226
460.0053550.05540.477963
47-0.137461-1.42190.078981
480.1907891.97350.025506
49-0.078365-0.81060.209693
500.0003510.00360.498554
51-0.024538-0.25380.40006
520.0384290.39750.345889
53-8.1e-05-8e-040.499666
54-0.022838-0.23620.406851
55-0.004787-0.04950.4803
560.035690.36920.356361
57-0.010958-0.11340.454982
58-0.018181-0.18810.425591
59-0.025678-0.26560.395522
600.0518250.53610.296509

\begin{tabular}{lllllllll}
\hline
Autocorrelation Function \tabularnewline
Time lag k & ACF(k) & T-STAT & P-value \tabularnewline
1 & -0.650236 & -6.7261 & 0 \tabularnewline
2 & 0.2069 & 2.1402 & 0.017306 \tabularnewline
3 & -0.057026 & -0.5899 & 0.278258 \tabularnewline
4 & -0.135183 & -1.3983 & 0.082451 \tabularnewline
5 & 0.329586 & 3.4093 & 0.00046 \tabularnewline
6 & -0.388739 & -4.0211 & 5.4e-05 \tabularnewline
7 & 0.320309 & 3.3133 & 0.000629 \tabularnewline
8 & -0.122963 & -1.2719 & 0.103076 \tabularnewline
9 & -0.023776 & -0.2459 & 0.403099 \tabularnewline
10 & 0.146211 & 1.5124 & 0.066688 \tabularnewline
11 & -0.510635 & -5.282 & 0 \tabularnewline
12 & 0.75547 & 7.8146 & 0 \tabularnewline
13 & -0.495027 & -5.1206 & 1e-06 \tabularnewline
14 & 0.169029 & 1.7484 & 0.041627 \tabularnewline
15 & -0.04701 & -0.4863 & 0.313885 \tabularnewline
16 & -0.105603 & -1.0924 & 0.138563 \tabularnewline
17 & 0.286342 & 2.9619 & 0.001883 \tabularnewline
18 & -0.355522 & -3.6775 & 0.000185 \tabularnewline
19 & 0.280194 & 2.8983 & 0.002276 \tabularnewline
20 & -0.092712 & -0.959 & 0.169855 \tabularnewline
21 & -0.029963 & -0.3099 & 0.378607 \tabularnewline
22 & 0.123436 & 1.2768 & 0.102212 \tabularnewline
23 & -0.397797 & -4.1148 & 3.8e-05 \tabularnewline
24 & 0.567521 & 5.8705 & 0 \tabularnewline
25 & -0.364616 & -3.7716 & 0.000133 \tabularnewline
26 & 0.135822 & 1.405 & 0.081465 \tabularnewline
27 & -0.07467 & -0.7724 & 0.220792 \tabularnewline
28 & -0.013823 & -0.143 & 0.443283 \tabularnewline
29 & 0.159901 & 1.654 & 0.050526 \tabularnewline
30 & -0.246768 & -2.5526 & 0.006052 \tabularnewline
31 & 0.191014 & 1.9759 & 0.025372 \tabularnewline
32 & -0.059373 & -0.6142 & 0.270205 \tabularnewline
33 & 0.001964 & 0.0203 & 0.491917 \tabularnewline
34 & 0.067809 & 0.7014 & 0.242283 \tabularnewline
35 & -0.25998 & -2.6893 & 0.004154 \tabularnewline
36 & 0.344251 & 3.561 & 0.000276 \tabularnewline
37 & -0.191833 & -1.9843 & 0.024889 \tabularnewline
38 & 0.05674 & 0.5869 & 0.279245 \tabularnewline
39 & -0.056883 & -0.5884 & 0.278752 \tabularnewline
40 & 0.042452 & 0.4391 & 0.330727 \tabularnewline
41 & 0.047267 & 0.4889 & 0.312946 \tabularnewline
42 & -0.11728 & -1.2132 & 0.113872 \tabularnewline
43 & 0.095607 & 0.989 & 0.162455 \tabularnewline
44 & -0.033712 & -0.3487 & 0.363994 \tabularnewline
45 & 0.022494 & 0.2327 & 0.408226 \tabularnewline
46 & 0.005355 & 0.0554 & 0.477963 \tabularnewline
47 & -0.137461 & -1.4219 & 0.078981 \tabularnewline
48 & 0.190789 & 1.9735 & 0.025506 \tabularnewline
49 & -0.078365 & -0.8106 & 0.209693 \tabularnewline
50 & 0.000351 & 0.0036 & 0.498554 \tabularnewline
51 & -0.024538 & -0.2538 & 0.40006 \tabularnewline
52 & 0.038429 & 0.3975 & 0.345889 \tabularnewline
53 & -8.1e-05 & -8e-04 & 0.499666 \tabularnewline
54 & -0.022838 & -0.2362 & 0.406851 \tabularnewline
55 & -0.004787 & -0.0495 & 0.4803 \tabularnewline
56 & 0.03569 & 0.3692 & 0.356361 \tabularnewline
57 & -0.010958 & -0.1134 & 0.454982 \tabularnewline
58 & -0.018181 & -0.1881 & 0.425591 \tabularnewline
59 & -0.025678 & -0.2656 & 0.395522 \tabularnewline
60 & 0.051825 & 0.5361 & 0.296509 \tabularnewline
\hline
\end{tabular}
%Source: https://freestatistics.org/blog/index.php?pk=124146&T=1

[TABLE]
[ROW][C]Autocorrelation Function[/C][/ROW]
[ROW][C]Time lag k[/C][C]ACF(k)[/C][C]T-STAT[/C][C]P-value[/C][/ROW]
[ROW][C]1[/C][C]-0.650236[/C][C]-6.7261[/C][C]0[/C][/ROW]
[ROW][C]2[/C][C]0.2069[/C][C]2.1402[/C][C]0.017306[/C][/ROW]
[ROW][C]3[/C][C]-0.057026[/C][C]-0.5899[/C][C]0.278258[/C][/ROW]
[ROW][C]4[/C][C]-0.135183[/C][C]-1.3983[/C][C]0.082451[/C][/ROW]
[ROW][C]5[/C][C]0.329586[/C][C]3.4093[/C][C]0.00046[/C][/ROW]
[ROW][C]6[/C][C]-0.388739[/C][C]-4.0211[/C][C]5.4e-05[/C][/ROW]
[ROW][C]7[/C][C]0.320309[/C][C]3.3133[/C][C]0.000629[/C][/ROW]
[ROW][C]8[/C][C]-0.122963[/C][C]-1.2719[/C][C]0.103076[/C][/ROW]
[ROW][C]9[/C][C]-0.023776[/C][C]-0.2459[/C][C]0.403099[/C][/ROW]
[ROW][C]10[/C][C]0.146211[/C][C]1.5124[/C][C]0.066688[/C][/ROW]
[ROW][C]11[/C][C]-0.510635[/C][C]-5.282[/C][C]0[/C][/ROW]
[ROW][C]12[/C][C]0.75547[/C][C]7.8146[/C][C]0[/C][/ROW]
[ROW][C]13[/C][C]-0.495027[/C][C]-5.1206[/C][C]1e-06[/C][/ROW]
[ROW][C]14[/C][C]0.169029[/C][C]1.7484[/C][C]0.041627[/C][/ROW]
[ROW][C]15[/C][C]-0.04701[/C][C]-0.4863[/C][C]0.313885[/C][/ROW]
[ROW][C]16[/C][C]-0.105603[/C][C]-1.0924[/C][C]0.138563[/C][/ROW]
[ROW][C]17[/C][C]0.286342[/C][C]2.9619[/C][C]0.001883[/C][/ROW]
[ROW][C]18[/C][C]-0.355522[/C][C]-3.6775[/C][C]0.000185[/C][/ROW]
[ROW][C]19[/C][C]0.280194[/C][C]2.8983[/C][C]0.002276[/C][/ROW]
[ROW][C]20[/C][C]-0.092712[/C][C]-0.959[/C][C]0.169855[/C][/ROW]
[ROW][C]21[/C][C]-0.029963[/C][C]-0.3099[/C][C]0.378607[/C][/ROW]
[ROW][C]22[/C][C]0.123436[/C][C]1.2768[/C][C]0.102212[/C][/ROW]
[ROW][C]23[/C][C]-0.397797[/C][C]-4.1148[/C][C]3.8e-05[/C][/ROW]
[ROW][C]24[/C][C]0.567521[/C][C]5.8705[/C][C]0[/C][/ROW]
[ROW][C]25[/C][C]-0.364616[/C][C]-3.7716[/C][C]0.000133[/C][/ROW]
[ROW][C]26[/C][C]0.135822[/C][C]1.405[/C][C]0.081465[/C][/ROW]
[ROW][C]27[/C][C]-0.07467[/C][C]-0.7724[/C][C]0.220792[/C][/ROW]
[ROW][C]28[/C][C]-0.013823[/C][C]-0.143[/C][C]0.443283[/C][/ROW]
[ROW][C]29[/C][C]0.159901[/C][C]1.654[/C][C]0.050526[/C][/ROW]
[ROW][C]30[/C][C]-0.246768[/C][C]-2.5526[/C][C]0.006052[/C][/ROW]
[ROW][C]31[/C][C]0.191014[/C][C]1.9759[/C][C]0.025372[/C][/ROW]
[ROW][C]32[/C][C]-0.059373[/C][C]-0.6142[/C][C]0.270205[/C][/ROW]
[ROW][C]33[/C][C]0.001964[/C][C]0.0203[/C][C]0.491917[/C][/ROW]
[ROW][C]34[/C][C]0.067809[/C][C]0.7014[/C][C]0.242283[/C][/ROW]
[ROW][C]35[/C][C]-0.25998[/C][C]-2.6893[/C][C]0.004154[/C][/ROW]
[ROW][C]36[/C][C]0.344251[/C][C]3.561[/C][C]0.000276[/C][/ROW]
[ROW][C]37[/C][C]-0.191833[/C][C]-1.9843[/C][C]0.024889[/C][/ROW]
[ROW][C]38[/C][C]0.05674[/C][C]0.5869[/C][C]0.279245[/C][/ROW]
[ROW][C]39[/C][C]-0.056883[/C][C]-0.5884[/C][C]0.278752[/C][/ROW]
[ROW][C]40[/C][C]0.042452[/C][C]0.4391[/C][C]0.330727[/C][/ROW]
[ROW][C]41[/C][C]0.047267[/C][C]0.4889[/C][C]0.312946[/C][/ROW]
[ROW][C]42[/C][C]-0.11728[/C][C]-1.2132[/C][C]0.113872[/C][/ROW]
[ROW][C]43[/C][C]0.095607[/C][C]0.989[/C][C]0.162455[/C][/ROW]
[ROW][C]44[/C][C]-0.033712[/C][C]-0.3487[/C][C]0.363994[/C][/ROW]
[ROW][C]45[/C][C]0.022494[/C][C]0.2327[/C][C]0.408226[/C][/ROW]
[ROW][C]46[/C][C]0.005355[/C][C]0.0554[/C][C]0.477963[/C][/ROW]
[ROW][C]47[/C][C]-0.137461[/C][C]-1.4219[/C][C]0.078981[/C][/ROW]
[ROW][C]48[/C][C]0.190789[/C][C]1.9735[/C][C]0.025506[/C][/ROW]
[ROW][C]49[/C][C]-0.078365[/C][C]-0.8106[/C][C]0.209693[/C][/ROW]
[ROW][C]50[/C][C]0.000351[/C][C]0.0036[/C][C]0.498554[/C][/ROW]
[ROW][C]51[/C][C]-0.024538[/C][C]-0.2538[/C][C]0.40006[/C][/ROW]
[ROW][C]52[/C][C]0.038429[/C][C]0.3975[/C][C]0.345889[/C][/ROW]
[ROW][C]53[/C][C]-8.1e-05[/C][C]-8e-04[/C][C]0.499666[/C][/ROW]
[ROW][C]54[/C][C]-0.022838[/C][C]-0.2362[/C][C]0.406851[/C][/ROW]
[ROW][C]55[/C][C]-0.004787[/C][C]-0.0495[/C][C]0.4803[/C][/ROW]
[ROW][C]56[/C][C]0.03569[/C][C]0.3692[/C][C]0.356361[/C][/ROW]
[ROW][C]57[/C][C]-0.010958[/C][C]-0.1134[/C][C]0.454982[/C][/ROW]
[ROW][C]58[/C][C]-0.018181[/C][C]-0.1881[/C][C]0.425591[/C][/ROW]
[ROW][C]59[/C][C]-0.025678[/C][C]-0.2656[/C][C]0.395522[/C][/ROW]
[ROW][C]60[/C][C]0.051825[/C][C]0.5361[/C][C]0.296509[/C][/ROW]
[/TABLE]
Source: https://freestatistics.org/blog/index.php?pk=124146&T=1

Globally Unique Identifier (entire table): ba.freestatistics.org/blog/index.php?pk=124146&T=1

As an alternative you can also use a QR Code:  

The GUIDs for individual cells are displayed in the table below:

Autocorrelation Function
Time lag kACF(k)T-STATP-value
1-0.650236-6.72610
20.20692.14020.017306
3-0.057026-0.58990.278258
4-0.135183-1.39830.082451
50.3295863.40930.00046
6-0.388739-4.02115.4e-05
70.3203093.31330.000629
8-0.122963-1.27190.103076
9-0.023776-0.24590.403099
100.1462111.51240.066688
11-0.510635-5.2820
120.755477.81460
13-0.495027-5.12061e-06
140.1690291.74840.041627
15-0.04701-0.48630.313885
16-0.105603-1.09240.138563
170.2863422.96190.001883
18-0.355522-3.67750.000185
190.2801942.89830.002276
20-0.092712-0.9590.169855
21-0.029963-0.30990.378607
220.1234361.27680.102212
23-0.397797-4.11483.8e-05
240.5675215.87050
25-0.364616-3.77160.000133
260.1358221.4050.081465
27-0.07467-0.77240.220792
28-0.013823-0.1430.443283
290.1599011.6540.050526
30-0.246768-2.55260.006052
310.1910141.97590.025372
32-0.059373-0.61420.270205
330.0019640.02030.491917
340.0678090.70140.242283
35-0.25998-2.68930.004154
360.3442513.5610.000276
37-0.191833-1.98430.024889
380.056740.58690.279245
39-0.056883-0.58840.278752
400.0424520.43910.330727
410.0472670.48890.312946
42-0.11728-1.21320.113872
430.0956070.9890.162455
44-0.033712-0.34870.363994
450.0224940.23270.408226
460.0053550.05540.477963
47-0.137461-1.42190.078981
480.1907891.97350.025506
49-0.078365-0.81060.209693
500.0003510.00360.498554
51-0.024538-0.25380.40006
520.0384290.39750.345889
53-8.1e-05-8e-040.499666
54-0.022838-0.23620.406851
55-0.004787-0.04950.4803
560.035690.36920.356361
57-0.010958-0.11340.454982
58-0.018181-0.18810.425591
59-0.025678-0.26560.395522
600.0518250.53610.296509


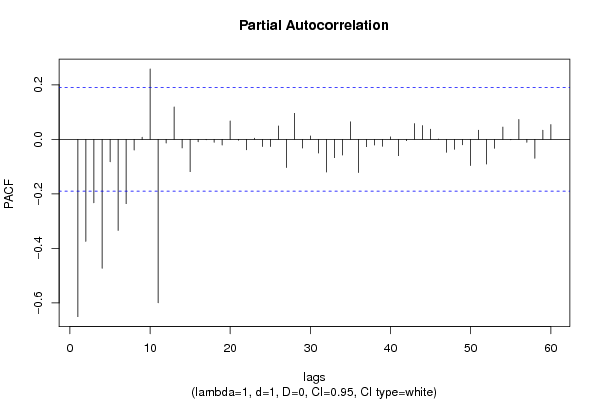
Partial Autocorrelation Function
Time lag kPACF(k)T-STATP-value
1-0.650236-6.72610
2-0.374064-3.86949.4e-05
3-0.232455-2.40450.008955
4-0.472476-4.88732e-06
5-0.082052-0.84880.198957
6-0.33373-3.45210.000399
7-0.23568-2.43790.00821
8-0.039349-0.4070.342398
90.0079950.08270.467123
100.2582652.67150.004366
11-0.599171-6.19790
12-0.013674-0.14140.443892
130.1187521.22840.111001
14-0.031201-0.32270.373761
15-0.118383-1.22460.111715
16-0.008635-0.08930.464496
17-0.00153-0.01580.493702
18-0.010428-0.10790.457152
19-0.020869-0.21590.414748
200.067080.69390.244631
21-0.002821-0.02920.488389
22-0.03813-0.39440.347029
230.0040230.04160.48344
24-0.026082-0.26980.39392
25-0.025978-0.26870.394331
260.04930.510.305565
27-0.102982-1.06530.144579
280.0955030.98790.162718
29-0.031998-0.3310.37065
300.0124490.12880.44889
31-0.050171-0.5190.302427
32-0.119918-1.24040.108762
33-0.066911-0.69210.245177
34-0.05728-0.59250.277381
350.0641680.66380.254136
36-0.121516-1.2570.105751
37-0.026732-0.27650.391341
38-0.020538-0.21240.416081
39-0.02508-0.25940.397903
400.0090310.09340.462875
41-0.059592-0.61640.269462
42-0.004684-0.04850.480722
430.0576280.59610.276181
440.0505510.52290.301062
450.0374270.38710.349708
46-0.000577-0.0060.497624
47-0.046992-0.48610.313948
48-0.036466-0.37720.353383
49-0.019749-0.20430.41926
50-0.095837-0.99130.161877
510.033250.34390.365784
52-0.090382-0.93490.175966
53-0.032324-0.33440.36938
540.0449280.46470.321533
55-0.001285-0.01330.494708
560.0730570.75570.225743
57-0.010409-0.10770.457228
58-0.069453-0.71840.237029
590.0335270.34680.364711
600.0542370.5610.287975

\begin{tabular}{lllllllll}
\hline
Partial Autocorrelation Function \tabularnewline
Time lag k & PACF(k) & T-STAT & P-value \tabularnewline
1 & -0.650236 & -6.7261 & 0 \tabularnewline
2 & -0.374064 & -3.8694 & 9.4e-05 \tabularnewline
3 & -0.232455 & -2.4045 & 0.008955 \tabularnewline
4 & -0.472476 & -4.8873 & 2e-06 \tabularnewline
5 & -0.082052 & -0.8488 & 0.198957 \tabularnewline
6 & -0.33373 & -3.4521 & 0.000399 \tabularnewline
7 & -0.23568 & -2.4379 & 0.00821 \tabularnewline
8 & -0.039349 & -0.407 & 0.342398 \tabularnewline
9 & 0.007995 & 0.0827 & 0.467123 \tabularnewline
10 & 0.258265 & 2.6715 & 0.004366 \tabularnewline
11 & -0.599171 & -6.1979 & 0 \tabularnewline
12 & -0.013674 & -0.1414 & 0.443892 \tabularnewline
13 & 0.118752 & 1.2284 & 0.111001 \tabularnewline
14 & -0.031201 & -0.3227 & 0.373761 \tabularnewline
15 & -0.118383 & -1.2246 & 0.111715 \tabularnewline
16 & -0.008635 & -0.0893 & 0.464496 \tabularnewline
17 & -0.00153 & -0.0158 & 0.493702 \tabularnewline
18 & -0.010428 & -0.1079 & 0.457152 \tabularnewline
19 & -0.020869 & -0.2159 & 0.414748 \tabularnewline
20 & 0.06708 & 0.6939 & 0.244631 \tabularnewline
21 & -0.002821 & -0.0292 & 0.488389 \tabularnewline
22 & -0.03813 & -0.3944 & 0.347029 \tabularnewline
23 & 0.004023 & 0.0416 & 0.48344 \tabularnewline
24 & -0.026082 & -0.2698 & 0.39392 \tabularnewline
25 & -0.025978 & -0.2687 & 0.394331 \tabularnewline
26 & 0.0493 & 0.51 & 0.305565 \tabularnewline
27 & -0.102982 & -1.0653 & 0.144579 \tabularnewline
28 & 0.095503 & 0.9879 & 0.162718 \tabularnewline
29 & -0.031998 & -0.331 & 0.37065 \tabularnewline
30 & 0.012449 & 0.1288 & 0.44889 \tabularnewline
31 & -0.050171 & -0.519 & 0.302427 \tabularnewline
32 & -0.119918 & -1.2404 & 0.108762 \tabularnewline
33 & -0.066911 & -0.6921 & 0.245177 \tabularnewline
34 & -0.05728 & -0.5925 & 0.277381 \tabularnewline
35 & 0.064168 & 0.6638 & 0.254136 \tabularnewline
36 & -0.121516 & -1.257 & 0.105751 \tabularnewline
37 & -0.026732 & -0.2765 & 0.391341 \tabularnewline
38 & -0.020538 & -0.2124 & 0.416081 \tabularnewline
39 & -0.02508 & -0.2594 & 0.397903 \tabularnewline
40 & 0.009031 & 0.0934 & 0.462875 \tabularnewline
41 & -0.059592 & -0.6164 & 0.269462 \tabularnewline
42 & -0.004684 & -0.0485 & 0.480722 \tabularnewline
43 & 0.057628 & 0.5961 & 0.276181 \tabularnewline
44 & 0.050551 & 0.5229 & 0.301062 \tabularnewline
45 & 0.037427 & 0.3871 & 0.349708 \tabularnewline
46 & -0.000577 & -0.006 & 0.497624 \tabularnewline
47 & -0.046992 & -0.4861 & 0.313948 \tabularnewline
48 & -0.036466 & -0.3772 & 0.353383 \tabularnewline
49 & -0.019749 & -0.2043 & 0.41926 \tabularnewline
50 & -0.095837 & -0.9913 & 0.161877 \tabularnewline
51 & 0.03325 & 0.3439 & 0.365784 \tabularnewline
52 & -0.090382 & -0.9349 & 0.175966 \tabularnewline
53 & -0.032324 & -0.3344 & 0.36938 \tabularnewline
54 & 0.044928 & 0.4647 & 0.321533 \tabularnewline
55 & -0.001285 & -0.0133 & 0.494708 \tabularnewline
56 & 0.073057 & 0.7557 & 0.225743 \tabularnewline
57 & -0.010409 & -0.1077 & 0.457228 \tabularnewline
58 & -0.069453 & -0.7184 & 0.237029 \tabularnewline
59 & 0.033527 & 0.3468 & 0.364711 \tabularnewline
60 & 0.054237 & 0.561 & 0.287975 \tabularnewline
\hline
\end{tabular}
%Source: https://freestatistics.org/blog/index.php?pk=124146&T=2

[TABLE]
[ROW][C]Partial Autocorrelation Function[/C][/ROW]
[ROW][C]Time lag k[/C][C]PACF(k)[/C][C]T-STAT[/C][C]P-value[/C][/ROW]
[ROW][C]1[/C][C]-0.650236[/C][C]-6.7261[/C][C]0[/C][/ROW]
[ROW][C]2[/C][C]-0.374064[/C][C]-3.8694[/C][C]9.4e-05[/C][/ROW]
[ROW][C]3[/C][C]-0.232455[/C][C]-2.4045[/C][C]0.008955[/C][/ROW]
[ROW][C]4[/C][C]-0.472476[/C][C]-4.8873[/C][C]2e-06[/C][/ROW]
[ROW][C]5[/C][C]-0.082052[/C][C]-0.8488[/C][C]0.198957[/C][/ROW]
[ROW][C]6[/C][C]-0.33373[/C][C]-3.4521[/C][C]0.000399[/C][/ROW]
[ROW][C]7[/C][C]-0.23568[/C][C]-2.4379[/C][C]0.00821[/C][/ROW]
[ROW][C]8[/C][C]-0.039349[/C][C]-0.407[/C][C]0.342398[/C][/ROW]
[ROW][C]9[/C][C]0.007995[/C][C]0.0827[/C][C]0.467123[/C][/ROW]
[ROW][C]10[/C][C]0.258265[/C][C]2.6715[/C][C]0.004366[/C][/ROW]
[ROW][C]11[/C][C]-0.599171[/C][C]-6.1979[/C][C]0[/C][/ROW]
[ROW][C]12[/C][C]-0.013674[/C][C]-0.1414[/C][C]0.443892[/C][/ROW]
[ROW][C]13[/C][C]0.118752[/C][C]1.2284[/C][C]0.111001[/C][/ROW]
[ROW][C]14[/C][C]-0.031201[/C][C]-0.3227[/C][C]0.373761[/C][/ROW]
[ROW][C]15[/C][C]-0.118383[/C][C]-1.2246[/C][C]0.111715[/C][/ROW]
[ROW][C]16[/C][C]-0.008635[/C][C]-0.0893[/C][C]0.464496[/C][/ROW]
[ROW][C]17[/C][C]-0.00153[/C][C]-0.0158[/C][C]0.493702[/C][/ROW]
[ROW][C]18[/C][C]-0.010428[/C][C]-0.1079[/C][C]0.457152[/C][/ROW]
[ROW][C]19[/C][C]-0.020869[/C][C]-0.2159[/C][C]0.414748[/C][/ROW]
[ROW][C]20[/C][C]0.06708[/C][C]0.6939[/C][C]0.244631[/C][/ROW]
[ROW][C]21[/C][C]-0.002821[/C][C]-0.0292[/C][C]0.488389[/C][/ROW]
[ROW][C]22[/C][C]-0.03813[/C][C]-0.3944[/C][C]0.347029[/C][/ROW]
[ROW][C]23[/C][C]0.004023[/C][C]0.0416[/C][C]0.48344[/C][/ROW]
[ROW][C]24[/C][C]-0.026082[/C][C]-0.2698[/C][C]0.39392[/C][/ROW]
[ROW][C]25[/C][C]-0.025978[/C][C]-0.2687[/C][C]0.394331[/C][/ROW]
[ROW][C]26[/C][C]0.0493[/C][C]0.51[/C][C]0.305565[/C][/ROW]
[ROW][C]27[/C][C]-0.102982[/C][C]-1.0653[/C][C]0.144579[/C][/ROW]
[ROW][C]28[/C][C]0.095503[/C][C]0.9879[/C][C]0.162718[/C][/ROW]
[ROW][C]29[/C][C]-0.031998[/C][C]-0.331[/C][C]0.37065[/C][/ROW]
[ROW][C]30[/C][C]0.012449[/C][C]0.1288[/C][C]0.44889[/C][/ROW]
[ROW][C]31[/C][C]-0.050171[/C][C]-0.519[/C][C]0.302427[/C][/ROW]
[ROW][C]32[/C][C]-0.119918[/C][C]-1.2404[/C][C]0.108762[/C][/ROW]
[ROW][C]33[/C][C]-0.066911[/C][C]-0.6921[/C][C]0.245177[/C][/ROW]
[ROW][C]34[/C][C]-0.05728[/C][C]-0.5925[/C][C]0.277381[/C][/ROW]
[ROW][C]35[/C][C]0.064168[/C][C]0.6638[/C][C]0.254136[/C][/ROW]
[ROW][C]36[/C][C]-0.121516[/C][C]-1.257[/C][C]0.105751[/C][/ROW]
[ROW][C]37[/C][C]-0.026732[/C][C]-0.2765[/C][C]0.391341[/C][/ROW]
[ROW][C]38[/C][C]-0.020538[/C][C]-0.2124[/C][C]0.416081[/C][/ROW]
[ROW][C]39[/C][C]-0.02508[/C][C]-0.2594[/C][C]0.397903[/C][/ROW]
[ROW][C]40[/C][C]0.009031[/C][C]0.0934[/C][C]0.462875[/C][/ROW]
[ROW][C]41[/C][C]-0.059592[/C][C]-0.6164[/C][C]0.269462[/C][/ROW]
[ROW][C]42[/C][C]-0.004684[/C][C]-0.0485[/C][C]0.480722[/C][/ROW]
[ROW][C]43[/C][C]0.057628[/C][C]0.5961[/C][C]0.276181[/C][/ROW]
[ROW][C]44[/C][C]0.050551[/C][C]0.5229[/C][C]0.301062[/C][/ROW]
[ROW][C]45[/C][C]0.037427[/C][C]0.3871[/C][C]0.349708[/C][/ROW]
[ROW][C]46[/C][C]-0.000577[/C][C]-0.006[/C][C]0.497624[/C][/ROW]
[ROW][C]47[/C][C]-0.046992[/C][C]-0.4861[/C][C]0.313948[/C][/ROW]
[ROW][C]48[/C][C]-0.036466[/C][C]-0.3772[/C][C]0.353383[/C][/ROW]
[ROW][C]49[/C][C]-0.019749[/C][C]-0.2043[/C][C]0.41926[/C][/ROW]
[ROW][C]50[/C][C]-0.095837[/C][C]-0.9913[/C][C]0.161877[/C][/ROW]
[ROW][C]51[/C][C]0.03325[/C][C]0.3439[/C][C]0.365784[/C][/ROW]
[ROW][C]52[/C][C]-0.090382[/C][C]-0.9349[/C][C]0.175966[/C][/ROW]
[ROW][C]53[/C][C]-0.032324[/C][C]-0.3344[/C][C]0.36938[/C][/ROW]
[ROW][C]54[/C][C]0.044928[/C][C]0.4647[/C][C]0.321533[/C][/ROW]
[ROW][C]55[/C][C]-0.001285[/C][C]-0.0133[/C][C]0.494708[/C][/ROW]
[ROW][C]56[/C][C]0.073057[/C][C]0.7557[/C][C]0.225743[/C][/ROW]
[ROW][C]57[/C][C]-0.010409[/C][C]-0.1077[/C][C]0.457228[/C][/ROW]
[ROW][C]58[/C][C]-0.069453[/C][C]-0.7184[/C][C]0.237029[/C][/ROW]
[ROW][C]59[/C][C]0.033527[/C][C]0.3468[/C][C]0.364711[/C][/ROW]
[ROW][C]60[/C][C]0.054237[/C][C]0.561[/C][C]0.287975[/C][/ROW]
[/TABLE]
Source: https://freestatistics.org/blog/index.php?pk=124146&T=2

Globally Unique Identifier (entire table): ba.freestatistics.org/blog/index.php?pk=124146&T=2

As an alternative you can also use a QR Code:  

The GUIDs for individual cells are displayed in the table below:

Partial Autocorrelation Function
Time lag kPACF(k)T-STATP-value
1-0.650236-6.72610
2-0.374064-3.86949.4e-05
3-0.232455-2.40450.008955
4-0.472476-4.88732e-06
5-0.082052-0.84880.198957
6-0.33373-3.45210.000399
7-0.23568-2.43790.00821
8-0.039349-0.4070.342398
90.0079950.08270.467123
100.2582652.67150.004366
11-0.599171-6.19790
12-0.013674-0.14140.443892
130.1187521.22840.111001
14-0.031201-0.32270.373761
15-0.118383-1.22460.111715
16-0.008635-0.08930.464496
17-0.00153-0.01580.493702
18-0.010428-0.10790.457152
19-0.020869-0.21590.414748
200.067080.69390.244631
21-0.002821-0.02920.488389
22-0.03813-0.39440.347029
230.0040230.04160.48344
24-0.026082-0.26980.39392
25-0.025978-0.26870.394331
260.04930.510.305565
27-0.102982-1.06530.144579
280.0955030.98790.162718
29-0.031998-0.3310.37065
300.0124490.12880.44889
31-0.050171-0.5190.302427
32-0.119918-1.24040.108762
33-0.066911-0.69210.245177
34-0.05728-0.59250.277381
350.0641680.66380.254136
36-0.121516-1.2570.105751
37-0.026732-0.27650.391341
38-0.020538-0.21240.416081
39-0.02508-0.25940.397903
400.0090310.09340.462875
41-0.059592-0.61640.269462
42-0.004684-0.04850.480722
430.0576280.59610.276181
440.0505510.52290.301062
450.0374270.38710.349708
46-0.000577-0.0060.497624
47-0.046992-0.48610.313948
48-0.036466-0.37720.353383
49-0.019749-0.20430.41926
50-0.095837-0.99130.161877
510.033250.34390.365784
52-0.090382-0.93490.175966
53-0.032324-0.33440.36938
540.0449280.46470.321533
55-0.001285-0.01330.494708
560.0730570.75570.225743
57-0.010409-0.10770.457228
58-0.069453-0.71840.237029
590.0335270.34680.364711
600.0542370.5610.287975


Parameters (Session):
par1 = 60 ; par2 = 1 ; par3 = 1 ; par4 = 0 ; par5 = 12 ; par6 = White Noise ; par7 = 0.95 ;
Parameters (R input):
par1 = 60 ; par2 = 1 ; par3 = 1 ; par4 = 0 ; par5 = 12 ; par6 = White Noise ; par7 = 0.95 ; par8 = ;
R code (references can be found in the software module):
if (par1 == 'Default') {
par1 = 10*log10(length(x))
} else {
par1 <- as.numeric(par1)
}
par2 <- as.numeric(par2)
par3 <- as.numeric(par3)
par4 <- as.numeric(par4)
par5 <- as.numeric(par5)
if (par6 == 'White Noise') par6 <- 'white' else par6 <- 'ma'
par7 <- as.numeric(par7)
if (par8 != '') par8 <- as.numeric(par8)
ox <- x
if (par8 == '') {
if (par2 == 0) {
x <- log(x)
} else {
x <- (x ^ par2 - 1) / par2
}
} else {
x <- log(x,base=par8)
}
if (par3 > 0) x <- diff(x,lag=1,difference=par3)
if (par4 > 0) x <- diff(x,lag=par5,difference=par4)
bitmap(file='picts.png')
op <- par(mfrow=c(2,1))
plot(ox,type='l',main='Original Time Series',xlab='time',ylab='value')
if (par8=='') {
mytitle <- paste('Working Time Series (lambda=',par2,', d=',par3,', D=',par4,')',sep='')
mysub <- paste('(lambda=',par2,', d=',par3,', D=',par4,', CI=', par7, ', CI type=',par6,')',sep='')
} else {
mytitle <- paste('Working Time Series (base=',par8,', d=',par3,', D=',par4,')',sep='')
mysub <- paste('(base=',par8,', d=',par3,', D=',par4,', CI=', par7, ', CI type=',par6,')',sep='')
}
plot(x,type='l', main=mytitle,xlab='time',ylab='value')
par(op)
dev.off()
bitmap(file='pic1.png')
racf <- acf(x, par1, main='Autocorrelation', xlab='time lag', ylab='ACF', ci.type=par6, ci=par7, sub=mysub)
dev.off()
bitmap(file='pic2.png')
rpacf <- pacf(x,par1,main='Partial Autocorrelation',xlab='lags',ylab='PACF',sub=mysub)
dev.off()
(myacf <- c(racf$acf))
(mypacf <- c(rpacf$acf))
lengthx <- length(x)
sqrtn <- sqrt(lengthx)
load(file='createtable')
a<-table.start()
a<-table.row.start(a)
a<-table.element(a,'Autocorrelation Function',4,TRUE)
a<-table.row.end(a)
a<-table.row.start(a)
a<-table.element(a,'Time lag k',header=TRUE)
a<-table.element(a,hyperlink('basics.htm','ACF(k)','click here for more information about the Autocorrelation Function'),header=TRUE)
a<-table.element(a,'T-STAT',header=TRUE)
a<-table.element(a,'P-value',header=TRUE)
a<-table.row.end(a)
for (i in 2:(par1+1)) {
a<-table.row.start(a)
a<-table.element(a,i-1,header=TRUE)
a<-table.element(a,round(myacf[i],6))
mytstat <- myacf[i]*sqrtn
a<-table.element(a,round(mytstat,4))
a<-table.element(a,round(1-pt(abs(mytstat),lengthx),6))
a<-table.row.end(a)
}
a<-table.end(a)
table.save(a,file='mytable.tab')
a<-table.start()
a<-table.row.start(a)
a<-table.element(a,'Partial Autocorrelation Function',4,TRUE)
a<-table.row.end(a)
a<-table.row.start(a)
a<-table.element(a,'Time lag k',header=TRUE)
a<-table.element(a,hyperlink('basics.htm','PACF(k)','click here for more information about the Partial Autocorrelation Function'),header=TRUE)
a<-table.element(a,'T-STAT',header=TRUE)
a<-table.element(a,'P-value',header=TRUE)
a<-table.row.end(a)
for (i in 1:par1) {
a<-table.row.start(a)
a<-table.element(a,i,header=TRUE)
a<-table.element(a,round(mypacf[i],6))
mytstat <- mypacf[i]*sqrtn
a<-table.element(a,round(mytstat,4))
a<-table.element(a,round(1-pt(abs(mytstat),lengthx),6))
a<-table.row.end(a)
}
a<-table.end(a)
table.save(a,file='mytable1.tab')