Free Statistics

of Irreproducible Research!

Author's title

Author*Unverified author*
R Software Modulerwasp_autocorrelation.wasp
Title produced by software(Partial) Autocorrelation Function
Date of computationWed, 17 Aug 2011 17:48:14 -0400
Cite this page as followsStatistical Computations at FreeStatistics.org, Office for Research Development and Education, URL https://freestatistics.org/blog/index.php?v=date/2011/Aug/17/t1313618035nmej6gyewyhe2u5.htm/, Retrieved Wed, 15 May 2024 09:22:16 +0000
Statistical Computations at FreeStatistics.org, Office for Research Development and Education, URL https://freestatistics.org/blog/index.php?pk=123985, Retrieved Wed, 15 May 2024 09:22:16 +0000
QR Codes:

Original text written by user:
IsPrivate?No (this computation is public)
User-defined keywordsGuy Hendrickx
Estimated Impact92
Family? (F = Feedback message, R = changed R code, M = changed R Module, P = changed Parameters, D = changed Data)
-       [(Partial) Autocorrelation Function] [reeksAstap21] [2011-08-17 21:48:14] [f94d9a6f82d80010722d76d48bd1e82c] [Current]
Feedback Forum

Post a new message
Dataseries X:
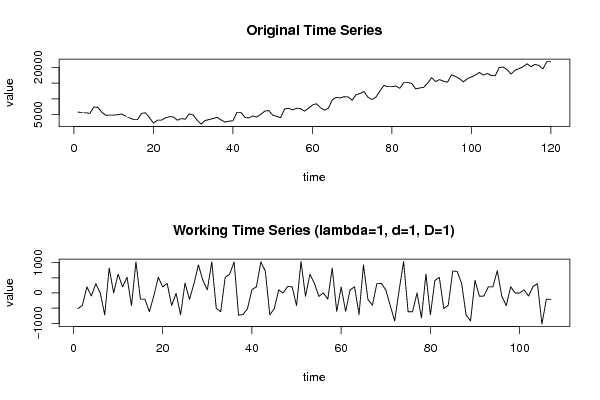
5740
5639
5538
5336
7380
7279
5740
4718
4819
4819
4920
5133
4516
3898
3392
3392
5336
5538
3999
2258
3179
3179
3898
4313
4212
3179
3696
3493
5234
4819
3179
1954
3078
3392
3696
4100
3280
2572
2876
2977
5639
5639
4100
3898
4516
4212
5032
6054
6257
4819
4414
3999
6773
6976
6459
6976
6874
6054
6976
7998
8413
7178
6358
6976
9638
10458
10256
10660
10559
9537
11278
11693
12300
10458
9739
10559
12513
14254
13839
13839
14042
13333
15176
15176
14862
13120
13434
13637
14973
16714
15479
16097
15580
15277
17636
17119
16400
15378
16400
16917
17534
18354
17534
18040
17423
17322
19883
20096
19276
17838
19063
19579
20197
21118
20197
20916
20602
19478
21837
21837


Summary of computational transaction
Raw Inputview raw input (R code)
Raw Outputview raw output of R engine
Computing time1 seconds
R Server'Gertrude Mary Cox' @ cox.wessa.net

\begin{tabular}{lllllllll}
\hline
Summary of computational transaction \tabularnewline
Raw Input & view raw input (R code)  \tabularnewline
Raw Output & view raw output of R engine  \tabularnewline
Computing time & 1 seconds \tabularnewline
R Server & 'Gertrude Mary Cox' @ cox.wessa.net \tabularnewline
\hline
\end{tabular}
%Source: https://freestatistics.org/blog/index.php?pk=123985&T=0

[TABLE]
[ROW][C]Summary of computational transaction[/C][/ROW]
[ROW][C]Raw Input[/C][C]view raw input (R code) [/C][/ROW]
[ROW][C]Raw Output[/C][C]view raw output of R engine [/C][/ROW]
[ROW][C]Computing time[/C][C]1 seconds[/C][/ROW]
[ROW][C]R Server[/C][C]'Gertrude Mary Cox' @ cox.wessa.net[/C][/ROW]
[/TABLE]
Source: https://freestatistics.org/blog/index.php?pk=123985&T=0

Globally Unique Identifier (entire table): ba.freestatistics.org/blog/index.php?pk=123985&T=0

As an alternative you can also use a QR Code:  

The GUIDs for individual cells are displayed in the table below:

Summary of computational transaction
Raw Inputview raw input (R code)
Raw Outputview raw output of R engine
Computing time1 seconds
R Server'Gertrude Mary Cox' @ cox.wessa.net


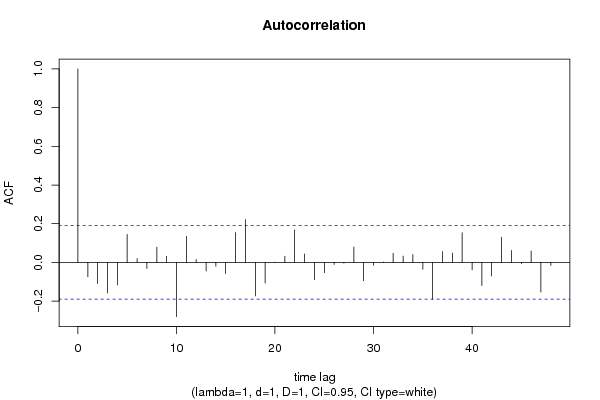
Autocorrelation Function
Time lag kACF(k)T-STATP-value
1-0.074446-0.77010.221477
2-0.109016-1.12770.130991
3-0.15777-1.6320.052812
4-0.116627-1.20640.115162
50.1440621.49020.069559
60.0191980.19860.42148
7-0.031123-0.32190.374063
80.0778360.80510.211263
90.0309690.32030.374664
10-0.280664-2.90320.002243
110.1349841.39630.082759
120.0141780.14670.441838
13-0.044689-0.46230.322415
14-0.019675-0.20350.419557
15-0.057616-0.5960.276221
160.153861.59150.057219
170.2202892.27870.012336
18-0.173391-1.79360.037853
19-0.106595-1.10260.136331
20-0.001264-0.01310.494794
210.0314280.32510.372874
220.1676181.73390.042912
230.0437250.45230.325987
24-0.089452-0.92530.178447
25-0.053013-0.54840.292291
26-0.010306-0.10660.457652
27-0.004039-0.04180.483375
280.0788870.8160.208154
29-0.095122-0.9840.163679
30-0.014625-0.15130.440019
310.0007690.0080.496836
320.0464530.48050.315922
330.0321920.3330.369896
340.0402250.41610.339088
35-0.03558-0.3680.356786
36-0.189969-1.96510.026
370.0552450.57150.284445
380.0482620.49920.309324
390.1533271.5860.057842
40-0.038544-0.39870.345453
41-0.120034-1.24160.108542
42-0.070843-0.73280.232638
430.1303411.34830.090212
440.0614650.63580.263132
45-0.006734-0.06970.4723
460.058170.60170.274319
47-0.15366-1.58950.057452
48-0.015508-0.16040.436426

\begin{tabular}{lllllllll}
\hline
Autocorrelation Function \tabularnewline
Time lag k & ACF(k) & T-STAT & P-value \tabularnewline
1 & -0.074446 & -0.7701 & 0.221477 \tabularnewline
2 & -0.109016 & -1.1277 & 0.130991 \tabularnewline
3 & -0.15777 & -1.632 & 0.052812 \tabularnewline
4 & -0.116627 & -1.2064 & 0.115162 \tabularnewline
5 & 0.144062 & 1.4902 & 0.069559 \tabularnewline
6 & 0.019198 & 0.1986 & 0.42148 \tabularnewline
7 & -0.031123 & -0.3219 & 0.374063 \tabularnewline
8 & 0.077836 & 0.8051 & 0.211263 \tabularnewline
9 & 0.030969 & 0.3203 & 0.374664 \tabularnewline
10 & -0.280664 & -2.9032 & 0.002243 \tabularnewline
11 & 0.134984 & 1.3963 & 0.082759 \tabularnewline
12 & 0.014178 & 0.1467 & 0.441838 \tabularnewline
13 & -0.044689 & -0.4623 & 0.322415 \tabularnewline
14 & -0.019675 & -0.2035 & 0.419557 \tabularnewline
15 & -0.057616 & -0.596 & 0.276221 \tabularnewline
16 & 0.15386 & 1.5915 & 0.057219 \tabularnewline
17 & 0.220289 & 2.2787 & 0.012336 \tabularnewline
18 & -0.173391 & -1.7936 & 0.037853 \tabularnewline
19 & -0.106595 & -1.1026 & 0.136331 \tabularnewline
20 & -0.001264 & -0.0131 & 0.494794 \tabularnewline
21 & 0.031428 & 0.3251 & 0.372874 \tabularnewline
22 & 0.167618 & 1.7339 & 0.042912 \tabularnewline
23 & 0.043725 & 0.4523 & 0.325987 \tabularnewline
24 & -0.089452 & -0.9253 & 0.178447 \tabularnewline
25 & -0.053013 & -0.5484 & 0.292291 \tabularnewline
26 & -0.010306 & -0.1066 & 0.457652 \tabularnewline
27 & -0.004039 & -0.0418 & 0.483375 \tabularnewline
28 & 0.078887 & 0.816 & 0.208154 \tabularnewline
29 & -0.095122 & -0.984 & 0.163679 \tabularnewline
30 & -0.014625 & -0.1513 & 0.440019 \tabularnewline
31 & 0.000769 & 0.008 & 0.496836 \tabularnewline
32 & 0.046453 & 0.4805 & 0.315922 \tabularnewline
33 & 0.032192 & 0.333 & 0.369896 \tabularnewline
34 & 0.040225 & 0.4161 & 0.339088 \tabularnewline
35 & -0.03558 & -0.368 & 0.356786 \tabularnewline
36 & -0.189969 & -1.9651 & 0.026 \tabularnewline
37 & 0.055245 & 0.5715 & 0.284445 \tabularnewline
38 & 0.048262 & 0.4992 & 0.309324 \tabularnewline
39 & 0.153327 & 1.586 & 0.057842 \tabularnewline
40 & -0.038544 & -0.3987 & 0.345453 \tabularnewline
41 & -0.120034 & -1.2416 & 0.108542 \tabularnewline
42 & -0.070843 & -0.7328 & 0.232638 \tabularnewline
43 & 0.130341 & 1.3483 & 0.090212 \tabularnewline
44 & 0.061465 & 0.6358 & 0.263132 \tabularnewline
45 & -0.006734 & -0.0697 & 0.4723 \tabularnewline
46 & 0.05817 & 0.6017 & 0.274319 \tabularnewline
47 & -0.15366 & -1.5895 & 0.057452 \tabularnewline
48 & -0.015508 & -0.1604 & 0.436426 \tabularnewline
\hline
\end{tabular}
%Source: https://freestatistics.org/blog/index.php?pk=123985&T=1

[TABLE]
[ROW][C]Autocorrelation Function[/C][/ROW]
[ROW][C]Time lag k[/C][C]ACF(k)[/C][C]T-STAT[/C][C]P-value[/C][/ROW]
[ROW][C]1[/C][C]-0.074446[/C][C]-0.7701[/C][C]0.221477[/C][/ROW]
[ROW][C]2[/C][C]-0.109016[/C][C]-1.1277[/C][C]0.130991[/C][/ROW]
[ROW][C]3[/C][C]-0.15777[/C][C]-1.632[/C][C]0.052812[/C][/ROW]
[ROW][C]4[/C][C]-0.116627[/C][C]-1.2064[/C][C]0.115162[/C][/ROW]
[ROW][C]5[/C][C]0.144062[/C][C]1.4902[/C][C]0.069559[/C][/ROW]
[ROW][C]6[/C][C]0.019198[/C][C]0.1986[/C][C]0.42148[/C][/ROW]
[ROW][C]7[/C][C]-0.031123[/C][C]-0.3219[/C][C]0.374063[/C][/ROW]
[ROW][C]8[/C][C]0.077836[/C][C]0.8051[/C][C]0.211263[/C][/ROW]
[ROW][C]9[/C][C]0.030969[/C][C]0.3203[/C][C]0.374664[/C][/ROW]
[ROW][C]10[/C][C]-0.280664[/C][C]-2.9032[/C][C]0.002243[/C][/ROW]
[ROW][C]11[/C][C]0.134984[/C][C]1.3963[/C][C]0.082759[/C][/ROW]
[ROW][C]12[/C][C]0.014178[/C][C]0.1467[/C][C]0.441838[/C][/ROW]
[ROW][C]13[/C][C]-0.044689[/C][C]-0.4623[/C][C]0.322415[/C][/ROW]
[ROW][C]14[/C][C]-0.019675[/C][C]-0.2035[/C][C]0.419557[/C][/ROW]
[ROW][C]15[/C][C]-0.057616[/C][C]-0.596[/C][C]0.276221[/C][/ROW]
[ROW][C]16[/C][C]0.15386[/C][C]1.5915[/C][C]0.057219[/C][/ROW]
[ROW][C]17[/C][C]0.220289[/C][C]2.2787[/C][C]0.012336[/C][/ROW]
[ROW][C]18[/C][C]-0.173391[/C][C]-1.7936[/C][C]0.037853[/C][/ROW]
[ROW][C]19[/C][C]-0.106595[/C][C]-1.1026[/C][C]0.136331[/C][/ROW]
[ROW][C]20[/C][C]-0.001264[/C][C]-0.0131[/C][C]0.494794[/C][/ROW]
[ROW][C]21[/C][C]0.031428[/C][C]0.3251[/C][C]0.372874[/C][/ROW]
[ROW][C]22[/C][C]0.167618[/C][C]1.7339[/C][C]0.042912[/C][/ROW]
[ROW][C]23[/C][C]0.043725[/C][C]0.4523[/C][C]0.325987[/C][/ROW]
[ROW][C]24[/C][C]-0.089452[/C][C]-0.9253[/C][C]0.178447[/C][/ROW]
[ROW][C]25[/C][C]-0.053013[/C][C]-0.5484[/C][C]0.292291[/C][/ROW]
[ROW][C]26[/C][C]-0.010306[/C][C]-0.1066[/C][C]0.457652[/C][/ROW]
[ROW][C]27[/C][C]-0.004039[/C][C]-0.0418[/C][C]0.483375[/C][/ROW]
[ROW][C]28[/C][C]0.078887[/C][C]0.816[/C][C]0.208154[/C][/ROW]
[ROW][C]29[/C][C]-0.095122[/C][C]-0.984[/C][C]0.163679[/C][/ROW]
[ROW][C]30[/C][C]-0.014625[/C][C]-0.1513[/C][C]0.440019[/C][/ROW]
[ROW][C]31[/C][C]0.000769[/C][C]0.008[/C][C]0.496836[/C][/ROW]
[ROW][C]32[/C][C]0.046453[/C][C]0.4805[/C][C]0.315922[/C][/ROW]
[ROW][C]33[/C][C]0.032192[/C][C]0.333[/C][C]0.369896[/C][/ROW]
[ROW][C]34[/C][C]0.040225[/C][C]0.4161[/C][C]0.339088[/C][/ROW]
[ROW][C]35[/C][C]-0.03558[/C][C]-0.368[/C][C]0.356786[/C][/ROW]
[ROW][C]36[/C][C]-0.189969[/C][C]-1.9651[/C][C]0.026[/C][/ROW]
[ROW][C]37[/C][C]0.055245[/C][C]0.5715[/C][C]0.284445[/C][/ROW]
[ROW][C]38[/C][C]0.048262[/C][C]0.4992[/C][C]0.309324[/C][/ROW]
[ROW][C]39[/C][C]0.153327[/C][C]1.586[/C][C]0.057842[/C][/ROW]
[ROW][C]40[/C][C]-0.038544[/C][C]-0.3987[/C][C]0.345453[/C][/ROW]
[ROW][C]41[/C][C]-0.120034[/C][C]-1.2416[/C][C]0.108542[/C][/ROW]
[ROW][C]42[/C][C]-0.070843[/C][C]-0.7328[/C][C]0.232638[/C][/ROW]
[ROW][C]43[/C][C]0.130341[/C][C]1.3483[/C][C]0.090212[/C][/ROW]
[ROW][C]44[/C][C]0.061465[/C][C]0.6358[/C][C]0.263132[/C][/ROW]
[ROW][C]45[/C][C]-0.006734[/C][C]-0.0697[/C][C]0.4723[/C][/ROW]
[ROW][C]46[/C][C]0.05817[/C][C]0.6017[/C][C]0.274319[/C][/ROW]
[ROW][C]47[/C][C]-0.15366[/C][C]-1.5895[/C][C]0.057452[/C][/ROW]
[ROW][C]48[/C][C]-0.015508[/C][C]-0.1604[/C][C]0.436426[/C][/ROW]
[/TABLE]
Source: https://freestatistics.org/blog/index.php?pk=123985&T=1

Globally Unique Identifier (entire table): ba.freestatistics.org/blog/index.php?pk=123985&T=1

As an alternative you can also use a QR Code:  

The GUIDs for individual cells are displayed in the table below:

Autocorrelation Function
Time lag kACF(k)T-STATP-value
1-0.074446-0.77010.221477
2-0.109016-1.12770.130991
3-0.15777-1.6320.052812
4-0.116627-1.20640.115162
50.1440621.49020.069559
60.0191980.19860.42148
7-0.031123-0.32190.374063
80.0778360.80510.211263
90.0309690.32030.374664
10-0.280664-2.90320.002243
110.1349841.39630.082759
120.0141780.14670.441838
13-0.044689-0.46230.322415
14-0.019675-0.20350.419557
15-0.057616-0.5960.276221
160.153861.59150.057219
170.2202892.27870.012336
18-0.173391-1.79360.037853
19-0.106595-1.10260.136331
20-0.001264-0.01310.494794
210.0314280.32510.372874
220.1676181.73390.042912
230.0437250.45230.325987
24-0.089452-0.92530.178447
25-0.053013-0.54840.292291
26-0.010306-0.10660.457652
27-0.004039-0.04180.483375
280.0788870.8160.208154
29-0.095122-0.9840.163679
30-0.014625-0.15130.440019
310.0007690.0080.496836
320.0464530.48050.315922
330.0321920.3330.369896
340.0402250.41610.339088
35-0.03558-0.3680.356786
36-0.189969-1.96510.026
370.0552450.57150.284445
380.0482620.49920.309324
390.1533271.5860.057842
40-0.038544-0.39870.345453
41-0.120034-1.24160.108542
42-0.070843-0.73280.232638
430.1303411.34830.090212
440.0614650.63580.263132
45-0.006734-0.06970.4723
460.058170.60170.274319
47-0.15366-1.58950.057452
48-0.015508-0.16040.436426


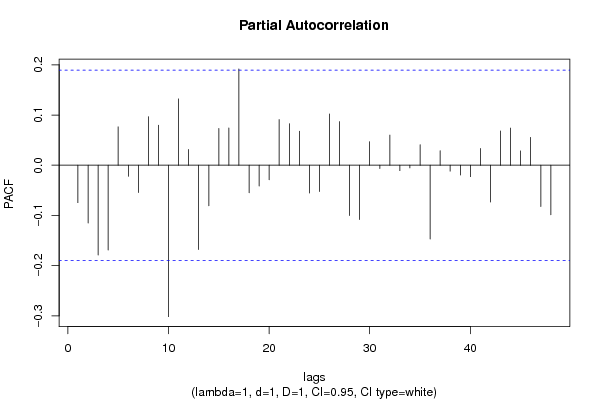
Partial Autocorrelation Function
Time lag kPACF(k)T-STATP-value
1-0.074446-0.77010.221477
2-0.115197-1.19160.118026
3-0.178746-1.8490.033612
4-0.168918-1.74730.041727
50.0764030.79030.215544
6-0.021915-0.22670.410548
7-0.054203-0.56070.288094
80.0966961.00020.159728
90.0796720.82410.205848
10-0.301566-3.11940.001164
110.1320981.36640.087334
120.03150.32580.372592
13-0.167969-1.73750.04259
14-0.08071-0.83490.202826
150.0730290.75540.225829
160.0740620.76610.222649
170.1917421.98340.024943
18-0.054853-0.56740.285815
19-0.041412-0.42840.334622
20-0.028972-0.29970.382496
210.0908290.93950.174783
220.0825450.85390.197546
230.0676450.69970.24281
24-0.055251-0.57150.284422
25-0.052435-0.54240.294337
260.1020131.05520.146848
270.0868550.89840.185485
28-0.099986-1.03430.151671
29-0.108227-1.11950.132715
300.04670.48310.315018
31-0.00667-0.0690.472559
320.0599340.620.268301
33-0.010811-0.11180.455584
34-0.005336-0.05520.478043
350.0407620.42160.337065
36-0.147038-1.5210.065608
370.0287510.29740.383367
38-0.011781-0.12190.451617
39-0.019361-0.20030.420823
40-0.022661-0.23440.407558
410.0333110.34460.365547
42-0.073309-0.75830.224964
430.0682160.70560.240976
440.0738980.76440.223153
450.0285320.29510.384229
460.055420.57330.283833
47-0.082159-0.84990.198651
48-0.098515-1.0190.15524

\begin{tabular}{lllllllll}
\hline
Partial Autocorrelation Function \tabularnewline
Time lag k & PACF(k) & T-STAT & P-value \tabularnewline
1 & -0.074446 & -0.7701 & 0.221477 \tabularnewline
2 & -0.115197 & -1.1916 & 0.118026 \tabularnewline
3 & -0.178746 & -1.849 & 0.033612 \tabularnewline
4 & -0.168918 & -1.7473 & 0.041727 \tabularnewline
5 & 0.076403 & 0.7903 & 0.215544 \tabularnewline
6 & -0.021915 & -0.2267 & 0.410548 \tabularnewline
7 & -0.054203 & -0.5607 & 0.288094 \tabularnewline
8 & 0.096696 & 1.0002 & 0.159728 \tabularnewline
9 & 0.079672 & 0.8241 & 0.205848 \tabularnewline
10 & -0.301566 & -3.1194 & 0.001164 \tabularnewline
11 & 0.132098 & 1.3664 & 0.087334 \tabularnewline
12 & 0.0315 & 0.3258 & 0.372592 \tabularnewline
13 & -0.167969 & -1.7375 & 0.04259 \tabularnewline
14 & -0.08071 & -0.8349 & 0.202826 \tabularnewline
15 & 0.073029 & 0.7554 & 0.225829 \tabularnewline
16 & 0.074062 & 0.7661 & 0.222649 \tabularnewline
17 & 0.191742 & 1.9834 & 0.024943 \tabularnewline
18 & -0.054853 & -0.5674 & 0.285815 \tabularnewline
19 & -0.041412 & -0.4284 & 0.334622 \tabularnewline
20 & -0.028972 & -0.2997 & 0.382496 \tabularnewline
21 & 0.090829 & 0.9395 & 0.174783 \tabularnewline
22 & 0.082545 & 0.8539 & 0.197546 \tabularnewline
23 & 0.067645 & 0.6997 & 0.24281 \tabularnewline
24 & -0.055251 & -0.5715 & 0.284422 \tabularnewline
25 & -0.052435 & -0.5424 & 0.294337 \tabularnewline
26 & 0.102013 & 1.0552 & 0.146848 \tabularnewline
27 & 0.086855 & 0.8984 & 0.185485 \tabularnewline
28 & -0.099986 & -1.0343 & 0.151671 \tabularnewline
29 & -0.108227 & -1.1195 & 0.132715 \tabularnewline
30 & 0.0467 & 0.4831 & 0.315018 \tabularnewline
31 & -0.00667 & -0.069 & 0.472559 \tabularnewline
32 & 0.059934 & 0.62 & 0.268301 \tabularnewline
33 & -0.010811 & -0.1118 & 0.455584 \tabularnewline
34 & -0.005336 & -0.0552 & 0.478043 \tabularnewline
35 & 0.040762 & 0.4216 & 0.337065 \tabularnewline
36 & -0.147038 & -1.521 & 0.065608 \tabularnewline
37 & 0.028751 & 0.2974 & 0.383367 \tabularnewline
38 & -0.011781 & -0.1219 & 0.451617 \tabularnewline
39 & -0.019361 & -0.2003 & 0.420823 \tabularnewline
40 & -0.022661 & -0.2344 & 0.407558 \tabularnewline
41 & 0.033311 & 0.3446 & 0.365547 \tabularnewline
42 & -0.073309 & -0.7583 & 0.224964 \tabularnewline
43 & 0.068216 & 0.7056 & 0.240976 \tabularnewline
44 & 0.073898 & 0.7644 & 0.223153 \tabularnewline
45 & 0.028532 & 0.2951 & 0.384229 \tabularnewline
46 & 0.05542 & 0.5733 & 0.283833 \tabularnewline
47 & -0.082159 & -0.8499 & 0.198651 \tabularnewline
48 & -0.098515 & -1.019 & 0.15524 \tabularnewline
\hline
\end{tabular}
%Source: https://freestatistics.org/blog/index.php?pk=123985&T=2

[TABLE]
[ROW][C]Partial Autocorrelation Function[/C][/ROW]
[ROW][C]Time lag k[/C][C]PACF(k)[/C][C]T-STAT[/C][C]P-value[/C][/ROW]
[ROW][C]1[/C][C]-0.074446[/C][C]-0.7701[/C][C]0.221477[/C][/ROW]
[ROW][C]2[/C][C]-0.115197[/C][C]-1.1916[/C][C]0.118026[/C][/ROW]
[ROW][C]3[/C][C]-0.178746[/C][C]-1.849[/C][C]0.033612[/C][/ROW]
[ROW][C]4[/C][C]-0.168918[/C][C]-1.7473[/C][C]0.041727[/C][/ROW]
[ROW][C]5[/C][C]0.076403[/C][C]0.7903[/C][C]0.215544[/C][/ROW]
[ROW][C]6[/C][C]-0.021915[/C][C]-0.2267[/C][C]0.410548[/C][/ROW]
[ROW][C]7[/C][C]-0.054203[/C][C]-0.5607[/C][C]0.288094[/C][/ROW]
[ROW][C]8[/C][C]0.096696[/C][C]1.0002[/C][C]0.159728[/C][/ROW]
[ROW][C]9[/C][C]0.079672[/C][C]0.8241[/C][C]0.205848[/C][/ROW]
[ROW][C]10[/C][C]-0.301566[/C][C]-3.1194[/C][C]0.001164[/C][/ROW]
[ROW][C]11[/C][C]0.132098[/C][C]1.3664[/C][C]0.087334[/C][/ROW]
[ROW][C]12[/C][C]0.0315[/C][C]0.3258[/C][C]0.372592[/C][/ROW]
[ROW][C]13[/C][C]-0.167969[/C][C]-1.7375[/C][C]0.04259[/C][/ROW]
[ROW][C]14[/C][C]-0.08071[/C][C]-0.8349[/C][C]0.202826[/C][/ROW]
[ROW][C]15[/C][C]0.073029[/C][C]0.7554[/C][C]0.225829[/C][/ROW]
[ROW][C]16[/C][C]0.074062[/C][C]0.7661[/C][C]0.222649[/C][/ROW]
[ROW][C]17[/C][C]0.191742[/C][C]1.9834[/C][C]0.024943[/C][/ROW]
[ROW][C]18[/C][C]-0.054853[/C][C]-0.5674[/C][C]0.285815[/C][/ROW]
[ROW][C]19[/C][C]-0.041412[/C][C]-0.4284[/C][C]0.334622[/C][/ROW]
[ROW][C]20[/C][C]-0.028972[/C][C]-0.2997[/C][C]0.382496[/C][/ROW]
[ROW][C]21[/C][C]0.090829[/C][C]0.9395[/C][C]0.174783[/C][/ROW]
[ROW][C]22[/C][C]0.082545[/C][C]0.8539[/C][C]0.197546[/C][/ROW]
[ROW][C]23[/C][C]0.067645[/C][C]0.6997[/C][C]0.24281[/C][/ROW]
[ROW][C]24[/C][C]-0.055251[/C][C]-0.5715[/C][C]0.284422[/C][/ROW]
[ROW][C]25[/C][C]-0.052435[/C][C]-0.5424[/C][C]0.294337[/C][/ROW]
[ROW][C]26[/C][C]0.102013[/C][C]1.0552[/C][C]0.146848[/C][/ROW]
[ROW][C]27[/C][C]0.086855[/C][C]0.8984[/C][C]0.185485[/C][/ROW]
[ROW][C]28[/C][C]-0.099986[/C][C]-1.0343[/C][C]0.151671[/C][/ROW]
[ROW][C]29[/C][C]-0.108227[/C][C]-1.1195[/C][C]0.132715[/C][/ROW]
[ROW][C]30[/C][C]0.0467[/C][C]0.4831[/C][C]0.315018[/C][/ROW]
[ROW][C]31[/C][C]-0.00667[/C][C]-0.069[/C][C]0.472559[/C][/ROW]
[ROW][C]32[/C][C]0.059934[/C][C]0.62[/C][C]0.268301[/C][/ROW]
[ROW][C]33[/C][C]-0.010811[/C][C]-0.1118[/C][C]0.455584[/C][/ROW]
[ROW][C]34[/C][C]-0.005336[/C][C]-0.0552[/C][C]0.478043[/C][/ROW]
[ROW][C]35[/C][C]0.040762[/C][C]0.4216[/C][C]0.337065[/C][/ROW]
[ROW][C]36[/C][C]-0.147038[/C][C]-1.521[/C][C]0.065608[/C][/ROW]
[ROW][C]37[/C][C]0.028751[/C][C]0.2974[/C][C]0.383367[/C][/ROW]
[ROW][C]38[/C][C]-0.011781[/C][C]-0.1219[/C][C]0.451617[/C][/ROW]
[ROW][C]39[/C][C]-0.019361[/C][C]-0.2003[/C][C]0.420823[/C][/ROW]
[ROW][C]40[/C][C]-0.022661[/C][C]-0.2344[/C][C]0.407558[/C][/ROW]
[ROW][C]41[/C][C]0.033311[/C][C]0.3446[/C][C]0.365547[/C][/ROW]
[ROW][C]42[/C][C]-0.073309[/C][C]-0.7583[/C][C]0.224964[/C][/ROW]
[ROW][C]43[/C][C]0.068216[/C][C]0.7056[/C][C]0.240976[/C][/ROW]
[ROW][C]44[/C][C]0.073898[/C][C]0.7644[/C][C]0.223153[/C][/ROW]
[ROW][C]45[/C][C]0.028532[/C][C]0.2951[/C][C]0.384229[/C][/ROW]
[ROW][C]46[/C][C]0.05542[/C][C]0.5733[/C][C]0.283833[/C][/ROW]
[ROW][C]47[/C][C]-0.082159[/C][C]-0.8499[/C][C]0.198651[/C][/ROW]
[ROW][C]48[/C][C]-0.098515[/C][C]-1.019[/C][C]0.15524[/C][/ROW]
[/TABLE]
Source: https://freestatistics.org/blog/index.php?pk=123985&T=2

Globally Unique Identifier (entire table): ba.freestatistics.org/blog/index.php?pk=123985&T=2

As an alternative you can also use a QR Code:  

The GUIDs for individual cells are displayed in the table below:

Partial Autocorrelation Function
Time lag kPACF(k)T-STATP-value
1-0.074446-0.77010.221477
2-0.115197-1.19160.118026
3-0.178746-1.8490.033612
4-0.168918-1.74730.041727
50.0764030.79030.215544
6-0.021915-0.22670.410548
7-0.054203-0.56070.288094
80.0966961.00020.159728
90.0796720.82410.205848
10-0.301566-3.11940.001164
110.1320981.36640.087334
120.03150.32580.372592
13-0.167969-1.73750.04259
14-0.08071-0.83490.202826
150.0730290.75540.225829
160.0740620.76610.222649
170.1917421.98340.024943
18-0.054853-0.56740.285815
19-0.041412-0.42840.334622
20-0.028972-0.29970.382496
210.0908290.93950.174783
220.0825450.85390.197546
230.0676450.69970.24281
24-0.055251-0.57150.284422
25-0.052435-0.54240.294337
260.1020131.05520.146848
270.0868550.89840.185485
28-0.099986-1.03430.151671
29-0.108227-1.11950.132715
300.04670.48310.315018
31-0.00667-0.0690.472559
320.0599340.620.268301
33-0.010811-0.11180.455584
34-0.005336-0.05520.478043
350.0407620.42160.337065
36-0.147038-1.5210.065608
370.0287510.29740.383367
38-0.011781-0.12190.451617
39-0.019361-0.20030.420823
40-0.022661-0.23440.407558
410.0333110.34460.365547
42-0.073309-0.75830.224964
430.0682160.70560.240976
440.0738980.76440.223153
450.0285320.29510.384229
460.055420.57330.283833
47-0.082159-0.84990.198651
48-0.098515-1.0190.15524


Parameters (Session):
par1 = 48 ; par2 = 1 ; par3 = 1 ; par4 = 1 ; par5 = 12 ; par6 = White Noise ; par7 = 0.95 ;
Parameters (R input):
par1 = 48 ; par2 = 1 ; par3 = 1 ; par4 = 1 ; par5 = 12 ; par6 = White Noise ; par7 = 0.95 ; par8 = ;
R code (references can be found in the software module):
if (par1 == 'Default') {
par1 = 10*log10(length(x))
} else {
par1 <- as.numeric(par1)
}
par2 <- as.numeric(par2)
par3 <- as.numeric(par3)
par4 <- as.numeric(par4)
par5 <- as.numeric(par5)
if (par6 == 'White Noise') par6 <- 'white' else par6 <- 'ma'
par7 <- as.numeric(par7)
if (par8 != '') par8 <- as.numeric(par8)
ox <- x
if (par8 == '') {
if (par2 == 0) {
x <- log(x)
} else {
x <- (x ^ par2 - 1) / par2
}
} else {
x <- log(x,base=par8)
}
if (par3 > 0) x <- diff(x,lag=1,difference=par3)
if (par4 > 0) x <- diff(x,lag=par5,difference=par4)
bitmap(file='picts.png')
op <- par(mfrow=c(2,1))
plot(ox,type='l',main='Original Time Series',xlab='time',ylab='value')
if (par8=='') {
mytitle <- paste('Working Time Series (lambda=',par2,', d=',par3,', D=',par4,')',sep='')
mysub <- paste('(lambda=',par2,', d=',par3,', D=',par4,', CI=', par7, ', CI type=',par6,')',sep='')
} else {
mytitle <- paste('Working Time Series (base=',par8,', d=',par3,', D=',par4,')',sep='')
mysub <- paste('(base=',par8,', d=',par3,', D=',par4,', CI=', par7, ', CI type=',par6,')',sep='')
}
plot(x,type='l', main=mytitle,xlab='time',ylab='value')
par(op)
dev.off()
bitmap(file='pic1.png')
racf <- acf(x, par1, main='Autocorrelation', xlab='time lag', ylab='ACF', ci.type=par6, ci=par7, sub=mysub)
dev.off()
bitmap(file='pic2.png')
rpacf <- pacf(x,par1,main='Partial Autocorrelation',xlab='lags',ylab='PACF',sub=mysub)
dev.off()
(myacf <- c(racf$acf))
(mypacf <- c(rpacf$acf))
lengthx <- length(x)
sqrtn <- sqrt(lengthx)
load(file='createtable')
a<-table.start()
a<-table.row.start(a)
a<-table.element(a,'Autocorrelation Function',4,TRUE)
a<-table.row.end(a)
a<-table.row.start(a)
a<-table.element(a,'Time lag k',header=TRUE)
a<-table.element(a,hyperlink('basics.htm','ACF(k)','click here for more information about the Autocorrelation Function'),header=TRUE)
a<-table.element(a,'T-STAT',header=TRUE)
a<-table.element(a,'P-value',header=TRUE)
a<-table.row.end(a)
for (i in 2:(par1+1)) {
a<-table.row.start(a)
a<-table.element(a,i-1,header=TRUE)
a<-table.element(a,round(myacf[i],6))
mytstat <- myacf[i]*sqrtn
a<-table.element(a,round(mytstat,4))
a<-table.element(a,round(1-pt(abs(mytstat),lengthx),6))
a<-table.row.end(a)
}
a<-table.end(a)
table.save(a,file='mytable.tab')
a<-table.start()
a<-table.row.start(a)
a<-table.element(a,'Partial Autocorrelation Function',4,TRUE)
a<-table.row.end(a)
a<-table.row.start(a)
a<-table.element(a,'Time lag k',header=TRUE)
a<-table.element(a,hyperlink('basics.htm','PACF(k)','click here for more information about the Partial Autocorrelation Function'),header=TRUE)
a<-table.element(a,'T-STAT',header=TRUE)
a<-table.element(a,'P-value',header=TRUE)
a<-table.row.end(a)
for (i in 1:par1) {
a<-table.row.start(a)
a<-table.element(a,i,header=TRUE)
a<-table.element(a,round(mypacf[i],6))
mytstat <- mypacf[i]*sqrtn
a<-table.element(a,round(mytstat,4))
a<-table.element(a,round(1-pt(abs(mytstat),lengthx),6))
a<-table.row.end(a)
}
a<-table.end(a)
table.save(a,file='mytable1.tab')