Free Statistics

of Irreproducible Research!

Author's title

Author*Unverified author*
R Software Modulerwasp_autocorrelation.wasp
Title produced by software(Partial) Autocorrelation Function
Date of computationTue, 16 Aug 2011 16:11:55 -0400
Cite this page as followsStatistical Computations at FreeStatistics.org, Office for Research Development and Education, URL https://freestatistics.org/blog/index.php?v=date/2011/Aug/16/t13135255505xs8ve1h9prf06x.htm/, Retrieved Mon, 13 May 2024 23:55:23 +0000
Statistical Computations at FreeStatistics.org, Office for Research Development and Education, URL https://freestatistics.org/blog/index.php?pk=123906, Retrieved Mon, 13 May 2024 23:55:23 +0000
QR Codes:

Original text written by user:
IsPrivate?No (this computation is public)
User-defined keywordsmattias debbaut
Estimated Impact164
Family? (F = Feedback message, R = changed R code, M = changed R Module, P = changed Parameters, D = changed Data)
-       [(Partial) Autocorrelation Function] [tijdreeks B - aut...] [2011-08-16 20:11:55] [d41d8cd98f00b204e9800998ecf8427e] [Current]
Feedback Forum

Post a new message
Dataseries X:
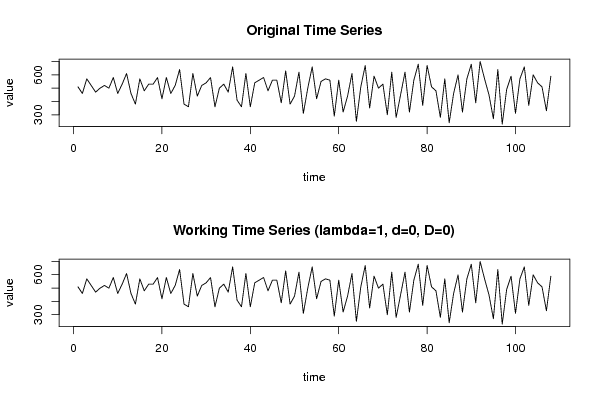
510
460
570
520
470
500
520
500
580
460
530
610
460
380
570
480
530
530
580
420
580
460
520
640
380
360
610
440
520
540
580
360
500
530
470
660
410
360
610
360
540
560
580
480
560
560
390
630
380
440
620
310
500
660
420
550
570
560
290
560
320
440
610
250
510
670
350
590
500
530
300
620
280
450
620
320
560
680
370
670
510
480
280
570
240
460
600
320
570
680
390
700
570
450
270
640
230
490
590
310
570
660
370
600
540
510
330
590


Summary of computational transaction
Raw Inputview raw input (R code)
Raw Outputview raw output of R engine
Computing time2 seconds
R Server'AstonUniversity' @ aston.wessa.net

\begin{tabular}{lllllllll}
\hline
Summary of computational transaction \tabularnewline
Raw Input & view raw input (R code)  \tabularnewline
Raw Output & view raw output of R engine  \tabularnewline
Computing time & 2 seconds \tabularnewline
R Server & 'AstonUniversity' @ aston.wessa.net \tabularnewline
\hline
\end{tabular}
%Source: https://freestatistics.org/blog/index.php?pk=123906&T=0

[TABLE]
[ROW][C]Summary of computational transaction[/C][/ROW]
[ROW][C]Raw Input[/C][C]view raw input (R code) [/C][/ROW]
[ROW][C]Raw Output[/C][C]view raw output of R engine [/C][/ROW]
[ROW][C]Computing time[/C][C]2 seconds[/C][/ROW]
[ROW][C]R Server[/C][C]'AstonUniversity' @ aston.wessa.net[/C][/ROW]
[/TABLE]
Source: https://freestatistics.org/blog/index.php?pk=123906&T=0

Globally Unique Identifier (entire table): ba.freestatistics.org/blog/index.php?pk=123906&T=0

As an alternative you can also use a QR Code:  

The GUIDs for individual cells are displayed in the table below:

Summary of computational transaction
Raw Inputview raw input (R code)
Raw Outputview raw output of R engine
Computing time2 seconds
R Server'AstonUniversity' @ aston.wessa.net


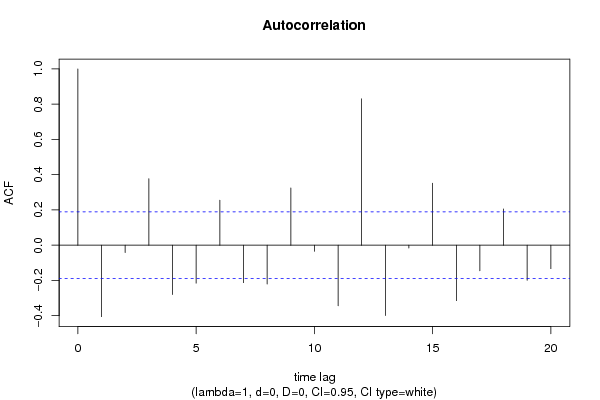
Autocorrelation Function
Time lag kACF(k)T-STATP-value
1-0.405358-4.21262.6e-05
2-0.041274-0.42890.334415
30.376793.91577.9e-05
4-0.279674-2.90650.002218
5-0.215225-2.23670.013681
60.2547142.64710.004667
7-0.212501-2.20840.014666
8-0.220791-2.29450.011847
90.3247763.37520.000513
10-0.034898-0.36270.358781
11-0.343344-3.56810.000269
120.8304928.63070
13-0.399276-4.14943.3e-05
14-0.015546-0.16160.435976
150.3521443.65960.000196
16-0.31446-3.2680.000726
17-0.14497-1.50660.067419
180.2059422.14020.017294
19-0.198609-2.0640.020707
20-0.132993-1.38210.084896

\begin{tabular}{lllllllll}
\hline
Autocorrelation Function \tabularnewline
Time lag k & ACF(k) & T-STAT & P-value \tabularnewline
1 & -0.405358 & -4.2126 & 2.6e-05 \tabularnewline
2 & -0.041274 & -0.4289 & 0.334415 \tabularnewline
3 & 0.37679 & 3.9157 & 7.9e-05 \tabularnewline
4 & -0.279674 & -2.9065 & 0.002218 \tabularnewline
5 & -0.215225 & -2.2367 & 0.013681 \tabularnewline
6 & 0.254714 & 2.6471 & 0.004667 \tabularnewline
7 & -0.212501 & -2.2084 & 0.014666 \tabularnewline
8 & -0.220791 & -2.2945 & 0.011847 \tabularnewline
9 & 0.324776 & 3.3752 & 0.000513 \tabularnewline
10 & -0.034898 & -0.3627 & 0.358781 \tabularnewline
11 & -0.343344 & -3.5681 & 0.000269 \tabularnewline
12 & 0.830492 & 8.6307 & 0 \tabularnewline
13 & -0.399276 & -4.1494 & 3.3e-05 \tabularnewline
14 & -0.015546 & -0.1616 & 0.435976 \tabularnewline
15 & 0.352144 & 3.6596 & 0.000196 \tabularnewline
16 & -0.31446 & -3.268 & 0.000726 \tabularnewline
17 & -0.14497 & -1.5066 & 0.067419 \tabularnewline
18 & 0.205942 & 2.1402 & 0.017294 \tabularnewline
19 & -0.198609 & -2.064 & 0.020707 \tabularnewline
20 & -0.132993 & -1.3821 & 0.084896 \tabularnewline
\hline
\end{tabular}
%Source: https://freestatistics.org/blog/index.php?pk=123906&T=1

[TABLE]
[ROW][C]Autocorrelation Function[/C][/ROW]
[ROW][C]Time lag k[/C][C]ACF(k)[/C][C]T-STAT[/C][C]P-value[/C][/ROW]
[ROW][C]1[/C][C]-0.405358[/C][C]-4.2126[/C][C]2.6e-05[/C][/ROW]
[ROW][C]2[/C][C]-0.041274[/C][C]-0.4289[/C][C]0.334415[/C][/ROW]
[ROW][C]3[/C][C]0.37679[/C][C]3.9157[/C][C]7.9e-05[/C][/ROW]
[ROW][C]4[/C][C]-0.279674[/C][C]-2.9065[/C][C]0.002218[/C][/ROW]
[ROW][C]5[/C][C]-0.215225[/C][C]-2.2367[/C][C]0.013681[/C][/ROW]
[ROW][C]6[/C][C]0.254714[/C][C]2.6471[/C][C]0.004667[/C][/ROW]
[ROW][C]7[/C][C]-0.212501[/C][C]-2.2084[/C][C]0.014666[/C][/ROW]
[ROW][C]8[/C][C]-0.220791[/C][C]-2.2945[/C][C]0.011847[/C][/ROW]
[ROW][C]9[/C][C]0.324776[/C][C]3.3752[/C][C]0.000513[/C][/ROW]
[ROW][C]10[/C][C]-0.034898[/C][C]-0.3627[/C][C]0.358781[/C][/ROW]
[ROW][C]11[/C][C]-0.343344[/C][C]-3.5681[/C][C]0.000269[/C][/ROW]
[ROW][C]12[/C][C]0.830492[/C][C]8.6307[/C][C]0[/C][/ROW]
[ROW][C]13[/C][C]-0.399276[/C][C]-4.1494[/C][C]3.3e-05[/C][/ROW]
[ROW][C]14[/C][C]-0.015546[/C][C]-0.1616[/C][C]0.435976[/C][/ROW]
[ROW][C]15[/C][C]0.352144[/C][C]3.6596[/C][C]0.000196[/C][/ROW]
[ROW][C]16[/C][C]-0.31446[/C][C]-3.268[/C][C]0.000726[/C][/ROW]
[ROW][C]17[/C][C]-0.14497[/C][C]-1.5066[/C][C]0.067419[/C][/ROW]
[ROW][C]18[/C][C]0.205942[/C][C]2.1402[/C][C]0.017294[/C][/ROW]
[ROW][C]19[/C][C]-0.198609[/C][C]-2.064[/C][C]0.020707[/C][/ROW]
[ROW][C]20[/C][C]-0.132993[/C][C]-1.3821[/C][C]0.084896[/C][/ROW]
[/TABLE]
Source: https://freestatistics.org/blog/index.php?pk=123906&T=1

Globally Unique Identifier (entire table): ba.freestatistics.org/blog/index.php?pk=123906&T=1

As an alternative you can also use a QR Code:  

The GUIDs for individual cells are displayed in the table below:

Autocorrelation Function
Time lag kACF(k)T-STATP-value
1-0.405358-4.21262.6e-05
2-0.041274-0.42890.334415
30.376793.91577.9e-05
4-0.279674-2.90650.002218
5-0.215225-2.23670.013681
60.2547142.64710.004667
7-0.212501-2.20840.014666
8-0.220791-2.29450.011847
90.3247763.37520.000513
10-0.034898-0.36270.358781
11-0.343344-3.56810.000269
120.8304928.63070
13-0.399276-4.14943.3e-05
14-0.015546-0.16160.435976
150.3521443.65960.000196
16-0.31446-3.2680.000726
17-0.14497-1.50660.067419
180.2059422.14020.017294
19-0.198609-2.0640.020707
20-0.132993-1.38210.084896


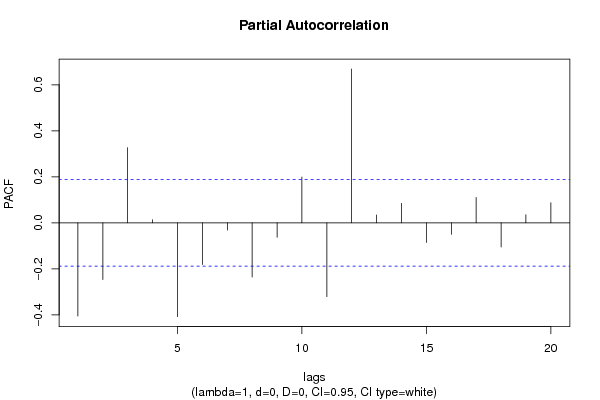
Partial Autocorrelation Function
Time lag kPACF(k)T-STATP-value
1-0.405358-4.21262.6e-05
2-0.246013-2.55660.005979
30.3263513.39150.000486
40.0132910.13810.445202
5-0.407736-4.23732.4e-05
6-0.180864-1.87960.031429
7-0.030911-0.32120.374325
8-0.235766-2.45020.007943
9-0.063048-0.65520.256862
100.1987922.06590.020615
11-0.320728-3.33310.000588
120.66876.94930
130.0339640.3530.3624
140.0845840.8790.190669
15-0.085996-0.89370.186736
16-0.050161-0.52130.301617
170.1100561.14370.12763
18-0.105444-1.09580.1378
190.0351120.36490.357954
200.0877470.91190.181929

\begin{tabular}{lllllllll}
\hline
Partial Autocorrelation Function \tabularnewline
Time lag k & PACF(k) & T-STAT & P-value \tabularnewline
1 & -0.405358 & -4.2126 & 2.6e-05 \tabularnewline
2 & -0.246013 & -2.5566 & 0.005979 \tabularnewline
3 & 0.326351 & 3.3915 & 0.000486 \tabularnewline
4 & 0.013291 & 0.1381 & 0.445202 \tabularnewline
5 & -0.407736 & -4.2373 & 2.4e-05 \tabularnewline
6 & -0.180864 & -1.8796 & 0.031429 \tabularnewline
7 & -0.030911 & -0.3212 & 0.374325 \tabularnewline
8 & -0.235766 & -2.4502 & 0.007943 \tabularnewline
9 & -0.063048 & -0.6552 & 0.256862 \tabularnewline
10 & 0.198792 & 2.0659 & 0.020615 \tabularnewline
11 & -0.320728 & -3.3331 & 0.000588 \tabularnewline
12 & 0.6687 & 6.9493 & 0 \tabularnewline
13 & 0.033964 & 0.353 & 0.3624 \tabularnewline
14 & 0.084584 & 0.879 & 0.190669 \tabularnewline
15 & -0.085996 & -0.8937 & 0.186736 \tabularnewline
16 & -0.050161 & -0.5213 & 0.301617 \tabularnewline
17 & 0.110056 & 1.1437 & 0.12763 \tabularnewline
18 & -0.105444 & -1.0958 & 0.1378 \tabularnewline
19 & 0.035112 & 0.3649 & 0.357954 \tabularnewline
20 & 0.087747 & 0.9119 & 0.181929 \tabularnewline
\hline
\end{tabular}
%Source: https://freestatistics.org/blog/index.php?pk=123906&T=2

[TABLE]
[ROW][C]Partial Autocorrelation Function[/C][/ROW]
[ROW][C]Time lag k[/C][C]PACF(k)[/C][C]T-STAT[/C][C]P-value[/C][/ROW]
[ROW][C]1[/C][C]-0.405358[/C][C]-4.2126[/C][C]2.6e-05[/C][/ROW]
[ROW][C]2[/C][C]-0.246013[/C][C]-2.5566[/C][C]0.005979[/C][/ROW]
[ROW][C]3[/C][C]0.326351[/C][C]3.3915[/C][C]0.000486[/C][/ROW]
[ROW][C]4[/C][C]0.013291[/C][C]0.1381[/C][C]0.445202[/C][/ROW]
[ROW][C]5[/C][C]-0.407736[/C][C]-4.2373[/C][C]2.4e-05[/C][/ROW]
[ROW][C]6[/C][C]-0.180864[/C][C]-1.8796[/C][C]0.031429[/C][/ROW]
[ROW][C]7[/C][C]-0.030911[/C][C]-0.3212[/C][C]0.374325[/C][/ROW]
[ROW][C]8[/C][C]-0.235766[/C][C]-2.4502[/C][C]0.007943[/C][/ROW]
[ROW][C]9[/C][C]-0.063048[/C][C]-0.6552[/C][C]0.256862[/C][/ROW]
[ROW][C]10[/C][C]0.198792[/C][C]2.0659[/C][C]0.020615[/C][/ROW]
[ROW][C]11[/C][C]-0.320728[/C][C]-3.3331[/C][C]0.000588[/C][/ROW]
[ROW][C]12[/C][C]0.6687[/C][C]6.9493[/C][C]0[/C][/ROW]
[ROW][C]13[/C][C]0.033964[/C][C]0.353[/C][C]0.3624[/C][/ROW]
[ROW][C]14[/C][C]0.084584[/C][C]0.879[/C][C]0.190669[/C][/ROW]
[ROW][C]15[/C][C]-0.085996[/C][C]-0.8937[/C][C]0.186736[/C][/ROW]
[ROW][C]16[/C][C]-0.050161[/C][C]-0.5213[/C][C]0.301617[/C][/ROW]
[ROW][C]17[/C][C]0.110056[/C][C]1.1437[/C][C]0.12763[/C][/ROW]
[ROW][C]18[/C][C]-0.105444[/C][C]-1.0958[/C][C]0.1378[/C][/ROW]
[ROW][C]19[/C][C]0.035112[/C][C]0.3649[/C][C]0.357954[/C][/ROW]
[ROW][C]20[/C][C]0.087747[/C][C]0.9119[/C][C]0.181929[/C][/ROW]
[/TABLE]
Source: https://freestatistics.org/blog/index.php?pk=123906&T=2

Globally Unique Identifier (entire table): ba.freestatistics.org/blog/index.php?pk=123906&T=2

As an alternative you can also use a QR Code:  

The GUIDs for individual cells are displayed in the table below:

Partial Autocorrelation Function
Time lag kPACF(k)T-STATP-value
1-0.405358-4.21262.6e-05
2-0.246013-2.55660.005979
30.3263513.39150.000486
40.0132910.13810.445202
5-0.407736-4.23732.4e-05
6-0.180864-1.87960.031429
7-0.030911-0.32120.374325
8-0.235766-2.45020.007943
9-0.063048-0.65520.256862
100.1987922.06590.020615
11-0.320728-3.33310.000588
120.66876.94930
130.0339640.3530.3624
140.0845840.8790.190669
15-0.085996-0.89370.186736
16-0.050161-0.52130.301617
170.1100561.14370.12763
18-0.105444-1.09580.1378
190.0351120.36490.357954
200.0877470.91190.181929


Parameters (Session):
par1 = Default ; par2 = 1 ; par3 = 0 ; par4 = 0 ; par5 = 12 ; par6 = White Noise ; par7 = 0.95 ;
Parameters (R input):
par1 = Default ; par2 = 1 ; par3 = 0 ; par4 = 0 ; par5 = 12 ; par6 = White Noise ; par7 = 0.95 ; par8 = ;
R code (references can be found in the software module):
if (par1 == 'Default') {
par1 = 10*log10(length(x))
} else {
par1 <- as.numeric(par1)
}
par2 <- as.numeric(par2)
par3 <- as.numeric(par3)
par4 <- as.numeric(par4)
par5 <- as.numeric(par5)
if (par6 == 'White Noise') par6 <- 'white' else par6 <- 'ma'
par7 <- as.numeric(par7)
if (par8 != '') par8 <- as.numeric(par8)
ox <- x
if (par8 == '') {
if (par2 == 0) {
x <- log(x)
} else {
x <- (x ^ par2 - 1) / par2
}
} else {
x <- log(x,base=par8)
}
if (par3 > 0) x <- diff(x,lag=1,difference=par3)
if (par4 > 0) x <- diff(x,lag=par5,difference=par4)
bitmap(file='picts.png')
op <- par(mfrow=c(2,1))
plot(ox,type='l',main='Original Time Series',xlab='time',ylab='value')
if (par8=='') {
mytitle <- paste('Working Time Series (lambda=',par2,', d=',par3,', D=',par4,')',sep='')
mysub <- paste('(lambda=',par2,', d=',par3,', D=',par4,', CI=', par7, ', CI type=',par6,')',sep='')
} else {
mytitle <- paste('Working Time Series (base=',par8,', d=',par3,', D=',par4,')',sep='')
mysub <- paste('(base=',par8,', d=',par3,', D=',par4,', CI=', par7, ', CI type=',par6,')',sep='')
}
plot(x,type='l', main=mytitle,xlab='time',ylab='value')
par(op)
dev.off()
bitmap(file='pic1.png')
racf <- acf(x, par1, main='Autocorrelation', xlab='time lag', ylab='ACF', ci.type=par6, ci=par7, sub=mysub)
dev.off()
bitmap(file='pic2.png')
rpacf <- pacf(x,par1,main='Partial Autocorrelation',xlab='lags',ylab='PACF',sub=mysub)
dev.off()
(myacf <- c(racf$acf))
(mypacf <- c(rpacf$acf))
lengthx <- length(x)
sqrtn <- sqrt(lengthx)
load(file='createtable')
a<-table.start()
a<-table.row.start(a)
a<-table.element(a,'Autocorrelation Function',4,TRUE)
a<-table.row.end(a)
a<-table.row.start(a)
a<-table.element(a,'Time lag k',header=TRUE)
a<-table.element(a,hyperlink('basics.htm','ACF(k)','click here for more information about the Autocorrelation Function'),header=TRUE)
a<-table.element(a,'T-STAT',header=TRUE)
a<-table.element(a,'P-value',header=TRUE)
a<-table.row.end(a)
for (i in 2:(par1+1)) {
a<-table.row.start(a)
a<-table.element(a,i-1,header=TRUE)
a<-table.element(a,round(myacf[i],6))
mytstat <- myacf[i]*sqrtn
a<-table.element(a,round(mytstat,4))
a<-table.element(a,round(1-pt(abs(mytstat),lengthx),6))
a<-table.row.end(a)
}
a<-table.end(a)
table.save(a,file='mytable.tab')
a<-table.start()
a<-table.row.start(a)
a<-table.element(a,'Partial Autocorrelation Function',4,TRUE)
a<-table.row.end(a)
a<-table.row.start(a)
a<-table.element(a,'Time lag k',header=TRUE)
a<-table.element(a,hyperlink('basics.htm','PACF(k)','click here for more information about the Partial Autocorrelation Function'),header=TRUE)
a<-table.element(a,'T-STAT',header=TRUE)
a<-table.element(a,'P-value',header=TRUE)
a<-table.row.end(a)
for (i in 1:par1) {
a<-table.row.start(a)
a<-table.element(a,i,header=TRUE)
a<-table.element(a,round(mypacf[i],6))
mytstat <- mypacf[i]*sqrtn
a<-table.element(a,round(mytstat,4))
a<-table.element(a,round(1-pt(abs(mytstat),lengthx),6))
a<-table.row.end(a)
}
a<-table.end(a)
table.save(a,file='mytable1.tab')