Free Statistics

of Irreproducible Research!

Author's title

Author*Unverified author*
R Software Modulerwasp_smp.wasp
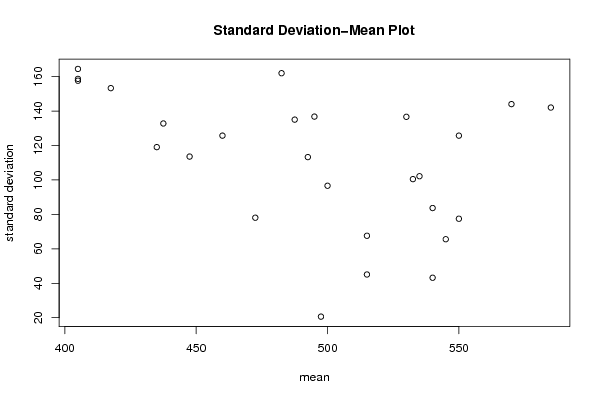
Title produced by softwareStandard Deviation-Mean Plot
Date of computationTue, 16 Aug 2011 12:24:29 -0400
Cite this page as followsStatistical Computations at FreeStatistics.org, Office for Research Development and Education, URL https://freestatistics.org/blog/index.php?v=date/2011/Aug/16/t1313511989mgl1m6uwrr0o01c.htm/, Retrieved Tue, 14 May 2024 13:46:14 +0000
Statistical Computations at FreeStatistics.org, Office for Research Development and Education, URL https://freestatistics.org/blog/index.php?pk=123890, Retrieved Tue, 14 May 2024 13:46:14 +0000
QR Codes:

Original text written by user:
IsPrivate?No (this computation is public)
User-defined keywordsmattias debbaut
Estimated Impact80
Family? (F = Feedback message, R = changed R code, M = changed R Module, P = changed Parameters, D = changed Data)
-       [Standard Deviation-Mean Plot] [tijdreeks B - SD ...] [2011-08-16 16:24:29] [d41d8cd98f00b204e9800998ecf8427e] [Current]
Feedback Forum

Post a new message
Dataseries X:
510
460
570
520
470
500
520
500
580
460
530
610
460
380
570
480
530
530
580
420
580
460
520
640
380
360
610
440
520
540
580
360
500
530
470
660
410
360
610
360
540
560
580
480
560
560
390
630
380
440
620
310
500
660
420
550
570
560
290
560
320
440
610
250
510
670
350
590
500
530
300
620
280
450
620
320
560
680
370
670
510
480
280
570
240
460
600
320
570
680
390
700
570
450
270
640
230
490
590
310
570
660
370
600
540
510
330
590


Summary of computational transaction
Raw Inputview raw input (R code)
Raw Outputview raw output of R engine
Computing time1 seconds
R Server'AstonUniversity' @ aston.wessa.net

\begin{tabular}{lllllllll}
\hline
Summary of computational transaction \tabularnewline
Raw Input & view raw input (R code)  \tabularnewline
Raw Output & view raw output of R engine  \tabularnewline
Computing time & 1 seconds \tabularnewline
R Server & 'AstonUniversity' @ aston.wessa.net \tabularnewline
\hline
\end{tabular}
%Source: https://freestatistics.org/blog/index.php?pk=123890&T=0

[TABLE]
[ROW][C]Summary of computational transaction[/C][/ROW]
[ROW][C]Raw Input[/C][C]view raw input (R code) [/C][/ROW]
[ROW][C]Raw Output[/C][C]view raw output of R engine [/C][/ROW]
[ROW][C]Computing time[/C][C]1 seconds[/C][/ROW]
[ROW][C]R Server[/C][C]'AstonUniversity' @ aston.wessa.net[/C][/ROW]
[/TABLE]
Source: https://freestatistics.org/blog/index.php?pk=123890&T=0

Globally Unique Identifier (entire table): ba.freestatistics.org/blog/index.php?pk=123890&T=0

As an alternative you can also use a QR Code:  

The GUIDs for individual cells are displayed in the table below:

Summary of computational transaction
Raw Inputview raw input (R code)
Raw Outputview raw output of R engine
Computing time1 seconds
R Server'AstonUniversity' @ aston.wessa.net


Standard Deviation-Mean Plot
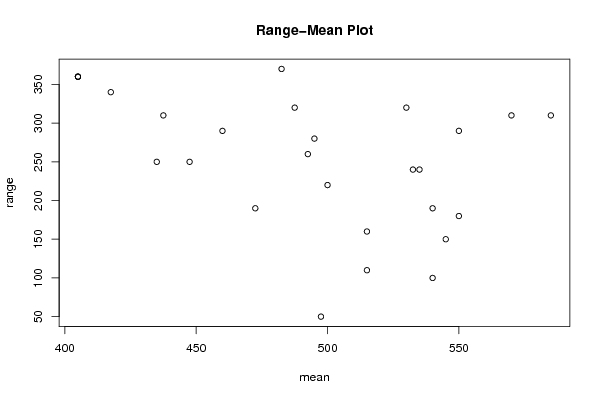
SectionMeanStandard DeviationRange
151545.0924975282289110
2497.520.615528128088350
354565.57438524302150
4472.578.049129826454190
551567.5771164423776160
655077.4596669241483180
7447.5113.541475535007250
850096.6091783079296220
954083.6660026534076190
10435119.023807142381250
1154043.2049379893857100
12535102.143689640297240
13437.5132.759180473518310
14532.5100.457287772798240
15495136.747943311773280
16405157.585955380971360
17530136.626010212795320
18487.5135320
19417.5153.26991442115340
20570143.990740443034310
21460125.698050899765290
22405158.640053790544360
23585142.009389360939310
24482.5161.941347407016370
25405164.418166068514360
26550125.698050899765290
27492.5113.247516529061260

\begin{tabular}{lllllllll}
\hline
Standard Deviation-Mean Plot \tabularnewline
Section & Mean & Standard Deviation & Range \tabularnewline
1 & 515 & 45.0924975282289 & 110 \tabularnewline
2 & 497.5 & 20.6155281280883 & 50 \tabularnewline
3 & 545 & 65.57438524302 & 150 \tabularnewline
4 & 472.5 & 78.049129826454 & 190 \tabularnewline
5 & 515 & 67.5771164423776 & 160 \tabularnewline
6 & 550 & 77.4596669241483 & 180 \tabularnewline
7 & 447.5 & 113.541475535007 & 250 \tabularnewline
8 & 500 & 96.6091783079296 & 220 \tabularnewline
9 & 540 & 83.6660026534076 & 190 \tabularnewline
10 & 435 & 119.023807142381 & 250 \tabularnewline
11 & 540 & 43.2049379893857 & 100 \tabularnewline
12 & 535 & 102.143689640297 & 240 \tabularnewline
13 & 437.5 & 132.759180473518 & 310 \tabularnewline
14 & 532.5 & 100.457287772798 & 240 \tabularnewline
15 & 495 & 136.747943311773 & 280 \tabularnewline
16 & 405 & 157.585955380971 & 360 \tabularnewline
17 & 530 & 136.626010212795 & 320 \tabularnewline
18 & 487.5 & 135 & 320 \tabularnewline
19 & 417.5 & 153.26991442115 & 340 \tabularnewline
20 & 570 & 143.990740443034 & 310 \tabularnewline
21 & 460 & 125.698050899765 & 290 \tabularnewline
22 & 405 & 158.640053790544 & 360 \tabularnewline
23 & 585 & 142.009389360939 & 310 \tabularnewline
24 & 482.5 & 161.941347407016 & 370 \tabularnewline
25 & 405 & 164.418166068514 & 360 \tabularnewline
26 & 550 & 125.698050899765 & 290 \tabularnewline
27 & 492.5 & 113.247516529061 & 260 \tabularnewline
\hline
\end{tabular}
%Source: https://freestatistics.org/blog/index.php?pk=123890&T=1

[TABLE]
[ROW][C]Standard Deviation-Mean Plot[/C][/ROW]
[ROW][C]Section[/C][C]Mean[/C][C]Standard Deviation[/C][C]Range[/C][/ROW]
[ROW][C]1[/C][C]515[/C][C]45.0924975282289[/C][C]110[/C][/ROW]
[ROW][C]2[/C][C]497.5[/C][C]20.6155281280883[/C][C]50[/C][/ROW]
[ROW][C]3[/C][C]545[/C][C]65.57438524302[/C][C]150[/C][/ROW]
[ROW][C]4[/C][C]472.5[/C][C]78.049129826454[/C][C]190[/C][/ROW]
[ROW][C]5[/C][C]515[/C][C]67.5771164423776[/C][C]160[/C][/ROW]
[ROW][C]6[/C][C]550[/C][C]77.4596669241483[/C][C]180[/C][/ROW]
[ROW][C]7[/C][C]447.5[/C][C]113.541475535007[/C][C]250[/C][/ROW]
[ROW][C]8[/C][C]500[/C][C]96.6091783079296[/C][C]220[/C][/ROW]
[ROW][C]9[/C][C]540[/C][C]83.6660026534076[/C][C]190[/C][/ROW]
[ROW][C]10[/C][C]435[/C][C]119.023807142381[/C][C]250[/C][/ROW]
[ROW][C]11[/C][C]540[/C][C]43.2049379893857[/C][C]100[/C][/ROW]
[ROW][C]12[/C][C]535[/C][C]102.143689640297[/C][C]240[/C][/ROW]
[ROW][C]13[/C][C]437.5[/C][C]132.759180473518[/C][C]310[/C][/ROW]
[ROW][C]14[/C][C]532.5[/C][C]100.457287772798[/C][C]240[/C][/ROW]
[ROW][C]15[/C][C]495[/C][C]136.747943311773[/C][C]280[/C][/ROW]
[ROW][C]16[/C][C]405[/C][C]157.585955380971[/C][C]360[/C][/ROW]
[ROW][C]17[/C][C]530[/C][C]136.626010212795[/C][C]320[/C][/ROW]
[ROW][C]18[/C][C]487.5[/C][C]135[/C][C]320[/C][/ROW]
[ROW][C]19[/C][C]417.5[/C][C]153.26991442115[/C][C]340[/C][/ROW]
[ROW][C]20[/C][C]570[/C][C]143.990740443034[/C][C]310[/C][/ROW]
[ROW][C]21[/C][C]460[/C][C]125.698050899765[/C][C]290[/C][/ROW]
[ROW][C]22[/C][C]405[/C][C]158.640053790544[/C][C]360[/C][/ROW]
[ROW][C]23[/C][C]585[/C][C]142.009389360939[/C][C]310[/C][/ROW]
[ROW][C]24[/C][C]482.5[/C][C]161.941347407016[/C][C]370[/C][/ROW]
[ROW][C]25[/C][C]405[/C][C]164.418166068514[/C][C]360[/C][/ROW]
[ROW][C]26[/C][C]550[/C][C]125.698050899765[/C][C]290[/C][/ROW]
[ROW][C]27[/C][C]492.5[/C][C]113.247516529061[/C][C]260[/C][/ROW]
[/TABLE]
Source: https://freestatistics.org/blog/index.php?pk=123890&T=1

Globally Unique Identifier (entire table): ba.freestatistics.org/blog/index.php?pk=123890&T=1

As an alternative you can also use a QR Code:  

The GUIDs for individual cells are displayed in the table below:

Standard Deviation-Mean Plot
SectionMeanStandard DeviationRange
151545.0924975282289110
2497.520.615528128088350
354565.57438524302150
4472.578.049129826454190
551567.5771164423776160
655077.4596669241483180
7447.5113.541475535007250
850096.6091783079296220
954083.6660026534076190
10435119.023807142381250
1154043.2049379893857100
12535102.143689640297240
13437.5132.759180473518310
14532.5100.457287772798240
15495136.747943311773280
16405157.585955380971360
17530136.626010212795320
18487.5135320
19417.5153.26991442115340
20570143.990740443034310
21460125.698050899765290
22405158.640053790544360
23585142.009389360939310
24482.5161.941347407016370
25405164.418166068514360
26550125.698050899765290
27492.5113.247516529061260


Regression: S.E.(k) = alpha + beta * Mean(k)
alpha271.883566016065
beta-0.325170201168863
S.D.0.135305613290421
T-STAT-2.40322772471321
p-value0.0239947047550262

\begin{tabular}{lllllllll}
\hline
Regression: S.E.(k) = alpha + beta * Mean(k) \tabularnewline
alpha & 271.883566016065 \tabularnewline
beta & -0.325170201168863 \tabularnewline
S.D. & 0.135305613290421 \tabularnewline
T-STAT & -2.40322772471321 \tabularnewline
p-value & 0.0239947047550262 \tabularnewline
\hline
\end{tabular}
%Source: https://freestatistics.org/blog/index.php?pk=123890&T=2

[TABLE]
[ROW][C]Regression: S.E.(k) = alpha + beta * Mean(k)[/C][/ROW]
[ROW][C]alpha[/C][C]271.883566016065[/C][/ROW]
[ROW][C]beta[/C][C]-0.325170201168863[/C][/ROW]
[ROW][C]S.D.[/C][C]0.135305613290421[/C][/ROW]
[ROW][C]T-STAT[/C][C]-2.40322772471321[/C][/ROW]
[ROW][C]p-value[/C][C]0.0239947047550262[/C][/ROW]
[/TABLE]
Source: https://freestatistics.org/blog/index.php?pk=123890&T=2

Globally Unique Identifier (entire table): ba.freestatistics.org/blog/index.php?pk=123890&T=2

As an alternative you can also use a QR Code:  

The GUIDs for individual cells are displayed in the table below:

Regression: S.E.(k) = alpha + beta * Mean(k)
alpha271.883566016065
beta-0.325170201168863
S.D.0.135305613290421
T-STAT-2.40322772471321
p-value0.0239947047550262


Regression: ln S.E.(k) = alpha + beta * ln Mean(k)
alpha14.5395253643031
beta-1.60049553974576
S.D.0.82999895781561
T-STAT-1.92831030048272
p-value0.0652472496002418
Lambda2.60049553974576

\begin{tabular}{lllllllll}
\hline
Regression: ln S.E.(k) = alpha + beta * ln Mean(k) \tabularnewline
alpha & 14.5395253643031 \tabularnewline
beta & -1.60049553974576 \tabularnewline
S.D. & 0.82999895781561 \tabularnewline
T-STAT & -1.92831030048272 \tabularnewline
p-value & 0.0652472496002418 \tabularnewline
Lambda & 2.60049553974576 \tabularnewline
\hline
\end{tabular}
%Source: https://freestatistics.org/blog/index.php?pk=123890&T=3

[TABLE]
[ROW][C]Regression: ln S.E.(k) = alpha + beta * ln Mean(k)[/C][/ROW]
[ROW][C]alpha[/C][C]14.5395253643031[/C][/ROW]
[ROW][C]beta[/C][C]-1.60049553974576[/C][/ROW]
[ROW][C]S.D.[/C][C]0.82999895781561[/C][/ROW]
[ROW][C]T-STAT[/C][C]-1.92831030048272[/C][/ROW]
[ROW][C]p-value[/C][C]0.0652472496002418[/C][/ROW]
[ROW][C]Lambda[/C][C]2.60049553974576[/C][/ROW]
[/TABLE]
Source: https://freestatistics.org/blog/index.php?pk=123890&T=3

Globally Unique Identifier (entire table): ba.freestatistics.org/blog/index.php?pk=123890&T=3

As an alternative you can also use a QR Code:  

The GUIDs for individual cells are displayed in the table below:

Regression: ln S.E.(k) = alpha + beta * ln Mean(k)
alpha14.5395253643031
beta-1.60049553974576
S.D.0.82999895781561
T-STAT-1.92831030048272
p-value0.0652472496002418
Lambda2.60049553974576


Parameters (Session):
Parameters (R input):
par1 = 4 ;
R code (references can be found in the software module):
par1 <- as.numeric(par1)
(n <- length(x))
(np <- floor(n / par1))
arr <- array(NA,dim=c(par1,np))
j <- 0
k <- 1
for (i in 1:(np*par1))
{
j = j + 1
arr[j,k] <- x[i]
if (j == par1) {
j = 0
k=k+1
}
}
arr
arr.mean <- array(NA,dim=np)
arr.sd <- array(NA,dim=np)
arr.range <- array(NA,dim=np)
for (j in 1:np)
{
arr.mean[j] <- mean(arr[,j],na.rm=TRUE)
arr.sd[j] <- sd(arr[,j],na.rm=TRUE)
arr.range[j] <- max(arr[,j],na.rm=TRUE) - min(arr[,j],na.rm=TRUE)
}
arr.mean
arr.sd
arr.range
(lm1 <- lm(arr.sd~arr.mean))
(lnlm1 <- lm(log(arr.sd)~log(arr.mean)))
(lm2 <- lm(arr.range~arr.mean))
bitmap(file='test1.png')
plot(arr.mean,arr.sd,main='Standard Deviation-Mean Plot',xlab='mean',ylab='standard deviation')
dev.off()
bitmap(file='test2.png')
plot(arr.mean,arr.range,main='Range-Mean Plot',xlab='mean',ylab='range')
dev.off()
load(file='createtable')
a<-table.start()
a<-table.row.start(a)
a<-table.element(a,'Standard Deviation-Mean Plot',4,TRUE)
a<-table.row.end(a)
a<-table.row.start(a)
a<-table.element(a,'Section',header=TRUE)
a<-table.element(a,'Mean',header=TRUE)
a<-table.element(a,'Standard Deviation',header=TRUE)
a<-table.element(a,'Range',header=TRUE)
a<-table.row.end(a)
for (j in 1:np) {
a<-table.row.start(a)
a<-table.element(a,j,header=TRUE)
a<-table.element(a,arr.mean[j])
a<-table.element(a,arr.sd[j] )
a<-table.element(a,arr.range[j] )
a<-table.row.end(a)
}
a<-table.end(a)
table.save(a,file='mytable.tab')
a<-table.start()
a<-table.row.start(a)
a<-table.element(a,'Regression: S.E.(k) = alpha + beta * Mean(k)',2,TRUE)
a<-table.row.end(a)
a<-table.row.start(a)
a<-table.element(a,'alpha',header=TRUE)
a<-table.element(a,lm1$coefficients[[1]])
a<-table.row.end(a)
a<-table.row.start(a)
a<-table.element(a,'beta',header=TRUE)
a<-table.element(a,lm1$coefficients[[2]])
a<-table.row.end(a)
a<-table.row.start(a)
a<-table.element(a,'S.D.',header=TRUE)
a<-table.element(a,summary(lm1)$coefficients[2,2])
a<-table.row.end(a)
a<-table.row.start(a)
a<-table.element(a,'T-STAT',header=TRUE)
a<-table.element(a,summary(lm1)$coefficients[2,3])
a<-table.row.end(a)
a<-table.row.start(a)
a<-table.element(a,'p-value',header=TRUE)
a<-table.element(a,summary(lm1)$coefficients[2,4])
a<-table.row.end(a)
a<-table.end(a)
table.save(a,file='mytable1.tab')
a<-table.start()
a<-table.row.start(a)
a<-table.element(a,'Regression: ln S.E.(k) = alpha + beta * ln Mean(k)',2,TRUE)
a<-table.row.end(a)
a<-table.row.start(a)
a<-table.element(a,'alpha',header=TRUE)
a<-table.element(a,lnlm1$coefficients[[1]])
a<-table.row.end(a)
a<-table.row.start(a)
a<-table.element(a,'beta',header=TRUE)
a<-table.element(a,lnlm1$coefficients[[2]])
a<-table.row.end(a)
a<-table.row.start(a)
a<-table.element(a,'S.D.',header=TRUE)
a<-table.element(a,summary(lnlm1)$coefficients[2,2])
a<-table.row.end(a)
a<-table.row.start(a)
a<-table.element(a,'T-STAT',header=TRUE)
a<-table.element(a,summary(lnlm1)$coefficients[2,3])
a<-table.row.end(a)
a<-table.row.start(a)
a<-table.element(a,'p-value',header=TRUE)
a<-table.element(a,summary(lnlm1)$coefficients[2,4])
a<-table.row.end(a)
a<-table.row.start(a)
a<-table.element(a,'Lambda',header=TRUE)
a<-table.element(a,1-lnlm1$coefficients[[2]])
a<-table.row.end(a)
a<-table.end(a)
table.save(a,file='mytable2.tab')