Free Statistics

of Irreproducible Research!

Author's title

Author*Unverified author*
R Software Modulerwasp_smp.wasp
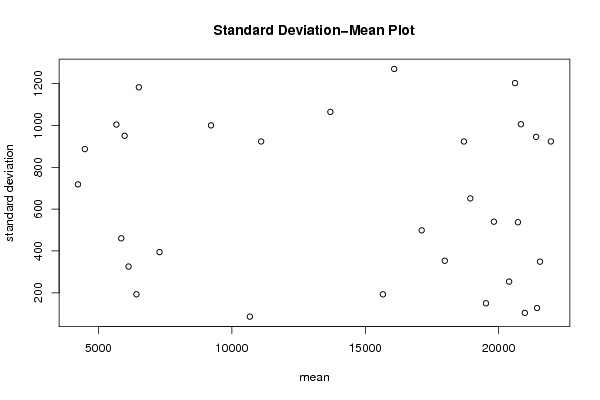
Title produced by softwareStandard Deviation-Mean Plot
Date of computationTue, 16 Aug 2011 08:19:58 -0400
Cite this page as followsStatistical Computations at FreeStatistics.org, Office for Research Development and Education, URL https://freestatistics.org/blog/index.php?v=date/2011/Aug/16/t1313497251wk8ej1nzrd4gzjc.htm/, Retrieved Mon, 13 May 2024 23:09:51 +0000
Statistical Computations at FreeStatistics.org, Office for Research Development and Education, URL https://freestatistics.org/blog/index.php?pk=123848, Retrieved Mon, 13 May 2024 23:09:51 +0000
QR Codes:

Original text written by user:
IsPrivate?No (this computation is public)
User-defined keywordsStandard deviation mean plot - Willem-Jan Carpels
Estimated Impact137
Family? (F = Feedback message, R = changed R code, M = changed R Module, P = changed Parameters, D = changed Data)
-       [Standard Deviation-Mean Plot] [Standard deviatio...] [2011-08-16 12:19:58] [49802af8bc65831d925aaf5d22a63767] [Current]
Feedback Forum

Post a new message
Dataseries X:
21571
21493
21422
21272
22747
22676
21571
20831
20909
20909
20980
21130
21051
21643
21864
21643
22455
21935
20759
20467
20467
20610
20026
20467
20097
20467
21051
21272
21792
21571
20246
19726
19506
19726
19363
19506
19064
19805
20168
20246
21643
21643
19805
19363
19363
19584
18622
18180
17668
17817
18480
17960
19363
19584
18180
17668
17375
17668
16855
16563
15388
15680
15751
15830
17226
17076
15388
14647
14355
14725
13322
12367
10601
10750
10750
10601
11854
11926
10451
10159
9568
10380
8905
8022
6333
6697
6255
6404
7509
7730
6996
6917
6917
7879
6184
5079
3163
4709
4488
4566
6333
6112
5300
5671
5671
6996
5450
4566
3163
5008
4859
4930
6476
6333
5813
5892
6255
7067
5813
4787


Summary of computational transaction
Raw Inputview raw input (R code)
Raw Outputview raw output of R engine
Computing time1 seconds
R Server'Gwilym Jenkins' @ jenkins.wessa.net

\begin{tabular}{lllllllll}
\hline
Summary of computational transaction \tabularnewline
Raw Input & view raw input (R code)  \tabularnewline
Raw Output & view raw output of R engine  \tabularnewline
Computing time & 1 seconds \tabularnewline
R Server & 'Gwilym Jenkins' @ jenkins.wessa.net \tabularnewline
\hline
\end{tabular}
%Source: https://freestatistics.org/blog/index.php?pk=123848&T=0

[TABLE]
[ROW][C]Summary of computational transaction[/C][/ROW]
[ROW][C]Raw Input[/C][C]view raw input (R code) [/C][/ROW]
[ROW][C]Raw Output[/C][C]view raw output of R engine [/C][/ROW]
[ROW][C]Computing time[/C][C]1 seconds[/C][/ROW]
[ROW][C]R Server[/C][C]'Gwilym Jenkins' @ jenkins.wessa.net[/C][/ROW]
[/TABLE]
Source: https://freestatistics.org/blog/index.php?pk=123848&T=0

Globally Unique Identifier (entire table): ba.freestatistics.org/blog/index.php?pk=123848&T=0

As an alternative you can also use a QR Code:  

The GUIDs for individual cells are displayed in the table below:

Summary of computational transaction
Raw Inputview raw input (R code)
Raw Outputview raw output of R engine
Computing time1 seconds
R Server'Gwilym Jenkins' @ jenkins.wessa.net


Standard Deviation-Mean Plot
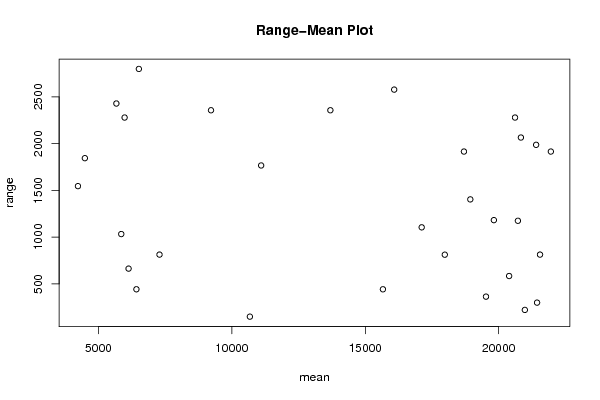
SectionMeanStandard DeviationRange
121439.5127.170489239184299
221956.25923.3870170916061916
320982104.188930953981221
421550.25348.757198253073813
521404945.2611632065851988
620392.5253.462028714362584
720721.75537.3982849495021175
820833.751005.707172424792066
919525.25149.851871304076363
1019820.75539.857620118491182
1120613.51202.381387081492280
1218937.25651.2446416926081404
1317981.25353.226438232852812
1418698.75923.1184015787651916
1517115.25498.568868529381105
1615662.25192.825266325068442
1716084.251269.857308256852579
1813692.251064.453341704872358
1910675.586.0251901092542149
2011097.5923.3000595689361767
219218.751000.187774037122358
226422.25193.01014653812442
237288394.592616927045813
246514.751182.336211348812800
254231.5718.1877656063681546
265854460.5829639344761033
275670.751004.239471772882430
284490886.7570129409751845
296128.5325.601494673064663
305980.5950.1457782887852280

\begin{tabular}{lllllllll}
\hline
Standard Deviation-Mean Plot \tabularnewline
Section & Mean & Standard Deviation & Range \tabularnewline
1 & 21439.5 & 127.170489239184 & 299 \tabularnewline
2 & 21956.25 & 923.387017091606 & 1916 \tabularnewline
3 & 20982 & 104.188930953981 & 221 \tabularnewline
4 & 21550.25 & 348.757198253073 & 813 \tabularnewline
5 & 21404 & 945.261163206585 & 1988 \tabularnewline
6 & 20392.5 & 253.462028714362 & 584 \tabularnewline
7 & 20721.75 & 537.398284949502 & 1175 \tabularnewline
8 & 20833.75 & 1005.70717242479 & 2066 \tabularnewline
9 & 19525.25 & 149.851871304076 & 363 \tabularnewline
10 & 19820.75 & 539.85762011849 & 1182 \tabularnewline
11 & 20613.5 & 1202.38138708149 & 2280 \tabularnewline
12 & 18937.25 & 651.244641692608 & 1404 \tabularnewline
13 & 17981.25 & 353.226438232852 & 812 \tabularnewline
14 & 18698.75 & 923.118401578765 & 1916 \tabularnewline
15 & 17115.25 & 498.56886852938 & 1105 \tabularnewline
16 & 15662.25 & 192.825266325068 & 442 \tabularnewline
17 & 16084.25 & 1269.85730825685 & 2579 \tabularnewline
18 & 13692.25 & 1064.45334170487 & 2358 \tabularnewline
19 & 10675.5 & 86.0251901092542 & 149 \tabularnewline
20 & 11097.5 & 923.300059568936 & 1767 \tabularnewline
21 & 9218.75 & 1000.18777403712 & 2358 \tabularnewline
22 & 6422.25 & 193.01014653812 & 442 \tabularnewline
23 & 7288 & 394.592616927045 & 813 \tabularnewline
24 & 6514.75 & 1182.33621134881 & 2800 \tabularnewline
25 & 4231.5 & 718.187765606368 & 1546 \tabularnewline
26 & 5854 & 460.582963934476 & 1033 \tabularnewline
27 & 5670.75 & 1004.23947177288 & 2430 \tabularnewline
28 & 4490 & 886.757012940975 & 1845 \tabularnewline
29 & 6128.5 & 325.601494673064 & 663 \tabularnewline
30 & 5980.5 & 950.145778288785 & 2280 \tabularnewline
\hline
\end{tabular}
%Source: https://freestatistics.org/blog/index.php?pk=123848&T=1

[TABLE]
[ROW][C]Standard Deviation-Mean Plot[/C][/ROW]
[ROW][C]Section[/C][C]Mean[/C][C]Standard Deviation[/C][C]Range[/C][/ROW]
[ROW][C]1[/C][C]21439.5[/C][C]127.170489239184[/C][C]299[/C][/ROW]
[ROW][C]2[/C][C]21956.25[/C][C]923.387017091606[/C][C]1916[/C][/ROW]
[ROW][C]3[/C][C]20982[/C][C]104.188930953981[/C][C]221[/C][/ROW]
[ROW][C]4[/C][C]21550.25[/C][C]348.757198253073[/C][C]813[/C][/ROW]
[ROW][C]5[/C][C]21404[/C][C]945.261163206585[/C][C]1988[/C][/ROW]
[ROW][C]6[/C][C]20392.5[/C][C]253.462028714362[/C][C]584[/C][/ROW]
[ROW][C]7[/C][C]20721.75[/C][C]537.398284949502[/C][C]1175[/C][/ROW]
[ROW][C]8[/C][C]20833.75[/C][C]1005.70717242479[/C][C]2066[/C][/ROW]
[ROW][C]9[/C][C]19525.25[/C][C]149.851871304076[/C][C]363[/C][/ROW]
[ROW][C]10[/C][C]19820.75[/C][C]539.85762011849[/C][C]1182[/C][/ROW]
[ROW][C]11[/C][C]20613.5[/C][C]1202.38138708149[/C][C]2280[/C][/ROW]
[ROW][C]12[/C][C]18937.25[/C][C]651.244641692608[/C][C]1404[/C][/ROW]
[ROW][C]13[/C][C]17981.25[/C][C]353.226438232852[/C][C]812[/C][/ROW]
[ROW][C]14[/C][C]18698.75[/C][C]923.118401578765[/C][C]1916[/C][/ROW]
[ROW][C]15[/C][C]17115.25[/C][C]498.56886852938[/C][C]1105[/C][/ROW]
[ROW][C]16[/C][C]15662.25[/C][C]192.825266325068[/C][C]442[/C][/ROW]
[ROW][C]17[/C][C]16084.25[/C][C]1269.85730825685[/C][C]2579[/C][/ROW]
[ROW][C]18[/C][C]13692.25[/C][C]1064.45334170487[/C][C]2358[/C][/ROW]
[ROW][C]19[/C][C]10675.5[/C][C]86.0251901092542[/C][C]149[/C][/ROW]
[ROW][C]20[/C][C]11097.5[/C][C]923.300059568936[/C][C]1767[/C][/ROW]
[ROW][C]21[/C][C]9218.75[/C][C]1000.18777403712[/C][C]2358[/C][/ROW]
[ROW][C]22[/C][C]6422.25[/C][C]193.01014653812[/C][C]442[/C][/ROW]
[ROW][C]23[/C][C]7288[/C][C]394.592616927045[/C][C]813[/C][/ROW]
[ROW][C]24[/C][C]6514.75[/C][C]1182.33621134881[/C][C]2800[/C][/ROW]
[ROW][C]25[/C][C]4231.5[/C][C]718.187765606368[/C][C]1546[/C][/ROW]
[ROW][C]26[/C][C]5854[/C][C]460.582963934476[/C][C]1033[/C][/ROW]
[ROW][C]27[/C][C]5670.75[/C][C]1004.23947177288[/C][C]2430[/C][/ROW]
[ROW][C]28[/C][C]4490[/C][C]886.757012940975[/C][C]1845[/C][/ROW]
[ROW][C]29[/C][C]6128.5[/C][C]325.601494673064[/C][C]663[/C][/ROW]
[ROW][C]30[/C][C]5980.5[/C][C]950.145778288785[/C][C]2280[/C][/ROW]
[/TABLE]
Source: https://freestatistics.org/blog/index.php?pk=123848&T=1

Globally Unique Identifier (entire table): ba.freestatistics.org/blog/index.php?pk=123848&T=1

As an alternative you can also use a QR Code:  

The GUIDs for individual cells are displayed in the table below:

Standard Deviation-Mean Plot
SectionMeanStandard DeviationRange
121439.5127.170489239184299
221956.25923.3870170916061916
320982104.188930953981221
421550.25348.757198253073813
521404945.2611632065851988
620392.5253.462028714362584
720721.75537.3982849495021175
820833.751005.707172424792066
919525.25149.851871304076363
1019820.75539.857620118491182
1120613.51202.381387081492280
1218937.25651.2446416926081404
1317981.25353.226438232852812
1418698.75923.1184015787651916
1517115.25498.568868529381105
1615662.25192.825266325068442
1716084.251269.857308256852579
1813692.251064.453341704872358
1910675.586.0251901092542149
2011097.5923.3000595689361767
219218.751000.187774037122358
226422.25193.01014653812442
237288394.592616927045813
246514.751182.336211348812800
254231.5718.1877656063681546
265854460.5829639344761033
275670.751004.239471772882430
284490886.7570129409751845
296128.5325.601494673064663
305980.5950.1457782887852280


Regression: S.E.(k) = alpha + beta * Mean(k)
alpha752.078487651688
beta-0.00776520803709032
S.D.0.0107841138595858
T-STAT-0.720059908324126
p-value0.477456378585242

\begin{tabular}{lllllllll}
\hline
Regression: S.E.(k) = alpha + beta * Mean(k) \tabularnewline
alpha & 752.078487651688 \tabularnewline
beta & -0.00776520803709032 \tabularnewline
S.D. & 0.0107841138595858 \tabularnewline
T-STAT & -0.720059908324126 \tabularnewline
p-value & 0.477456378585242 \tabularnewline
\hline
\end{tabular}
%Source: https://freestatistics.org/blog/index.php?pk=123848&T=2

[TABLE]
[ROW][C]Regression: S.E.(k) = alpha + beta * Mean(k)[/C][/ROW]
[ROW][C]alpha[/C][C]752.078487651688[/C][/ROW]
[ROW][C]beta[/C][C]-0.00776520803709032[/C][/ROW]
[ROW][C]S.D.[/C][C]0.0107841138595858[/C][/ROW]
[ROW][C]T-STAT[/C][C]-0.720059908324126[/C][/ROW]
[ROW][C]p-value[/C][C]0.477456378585242[/C][/ROW]
[/TABLE]
Source: https://freestatistics.org/blog/index.php?pk=123848&T=2

Globally Unique Identifier (entire table): ba.freestatistics.org/blog/index.php?pk=123848&T=2

As an alternative you can also use a QR Code:  

The GUIDs for individual cells are displayed in the table below:

Regression: S.E.(k) = alpha + beta * Mean(k)
alpha752.078487651688
beta-0.00776520803709032
S.D.0.0107841138595858
T-STAT-0.720059908324126
p-value0.477456378585242


Regression: ln S.E.(k) = alpha + beta * ln Mean(k)
alpha8.42460658823753
beta-0.234026730897555
S.D.0.262732568172009
T-STAT-0.890741229859023
p-value0.380658316329005
Lambda1.23402673089755

\begin{tabular}{lllllllll}
\hline
Regression: ln S.E.(k) = alpha + beta * ln Mean(k) \tabularnewline
alpha & 8.42460658823753 \tabularnewline
beta & -0.234026730897555 \tabularnewline
S.D. & 0.262732568172009 \tabularnewline
T-STAT & -0.890741229859023 \tabularnewline
p-value & 0.380658316329005 \tabularnewline
Lambda & 1.23402673089755 \tabularnewline
\hline
\end{tabular}
%Source: https://freestatistics.org/blog/index.php?pk=123848&T=3

[TABLE]
[ROW][C]Regression: ln S.E.(k) = alpha + beta * ln Mean(k)[/C][/ROW]
[ROW][C]alpha[/C][C]8.42460658823753[/C][/ROW]
[ROW][C]beta[/C][C]-0.234026730897555[/C][/ROW]
[ROW][C]S.D.[/C][C]0.262732568172009[/C][/ROW]
[ROW][C]T-STAT[/C][C]-0.890741229859023[/C][/ROW]
[ROW][C]p-value[/C][C]0.380658316329005[/C][/ROW]
[ROW][C]Lambda[/C][C]1.23402673089755[/C][/ROW]
[/TABLE]
Source: https://freestatistics.org/blog/index.php?pk=123848&T=3

Globally Unique Identifier (entire table): ba.freestatistics.org/blog/index.php?pk=123848&T=3

As an alternative you can also use a QR Code:  

The GUIDs for individual cells are displayed in the table below:

Regression: ln S.E.(k) = alpha + beta * ln Mean(k)
alpha8.42460658823753
beta-0.234026730897555
S.D.0.262732568172009
T-STAT-0.890741229859023
p-value0.380658316329005
Lambda1.23402673089755


Parameters (Session):
par1 = 4 ;
Parameters (R input):
par1 = 4 ;
R code (references can be found in the software module):
par1 <- as.numeric(par1)
(n <- length(x))
(np <- floor(n / par1))
arr <- array(NA,dim=c(par1,np))
j <- 0
k <- 1
for (i in 1:(np*par1))
{
j = j + 1
arr[j,k] <- x[i]
if (j == par1) {
j = 0
k=k+1
}
}
arr
arr.mean <- array(NA,dim=np)
arr.sd <- array(NA,dim=np)
arr.range <- array(NA,dim=np)
for (j in 1:np)
{
arr.mean[j] <- mean(arr[,j],na.rm=TRUE)
arr.sd[j] <- sd(arr[,j],na.rm=TRUE)
arr.range[j] <- max(arr[,j],na.rm=TRUE) - min(arr[,j],na.rm=TRUE)
}
arr.mean
arr.sd
arr.range
(lm1 <- lm(arr.sd~arr.mean))
(lnlm1 <- lm(log(arr.sd)~log(arr.mean)))
(lm2 <- lm(arr.range~arr.mean))
bitmap(file='test1.png')
plot(arr.mean,arr.sd,main='Standard Deviation-Mean Plot',xlab='mean',ylab='standard deviation')
dev.off()
bitmap(file='test2.png')
plot(arr.mean,arr.range,main='Range-Mean Plot',xlab='mean',ylab='range')
dev.off()
load(file='createtable')
a<-table.start()
a<-table.row.start(a)
a<-table.element(a,'Standard Deviation-Mean Plot',4,TRUE)
a<-table.row.end(a)
a<-table.row.start(a)
a<-table.element(a,'Section',header=TRUE)
a<-table.element(a,'Mean',header=TRUE)
a<-table.element(a,'Standard Deviation',header=TRUE)
a<-table.element(a,'Range',header=TRUE)
a<-table.row.end(a)
for (j in 1:np) {
a<-table.row.start(a)
a<-table.element(a,j,header=TRUE)
a<-table.element(a,arr.mean[j])
a<-table.element(a,arr.sd[j] )
a<-table.element(a,arr.range[j] )
a<-table.row.end(a)
}
a<-table.end(a)
table.save(a,file='mytable.tab')
a<-table.start()
a<-table.row.start(a)
a<-table.element(a,'Regression: S.E.(k) = alpha + beta * Mean(k)',2,TRUE)
a<-table.row.end(a)
a<-table.row.start(a)
a<-table.element(a,'alpha',header=TRUE)
a<-table.element(a,lm1$coefficients[[1]])
a<-table.row.end(a)
a<-table.row.start(a)
a<-table.element(a,'beta',header=TRUE)
a<-table.element(a,lm1$coefficients[[2]])
a<-table.row.end(a)
a<-table.row.start(a)
a<-table.element(a,'S.D.',header=TRUE)
a<-table.element(a,summary(lm1)$coefficients[2,2])
a<-table.row.end(a)
a<-table.row.start(a)
a<-table.element(a,'T-STAT',header=TRUE)
a<-table.element(a,summary(lm1)$coefficients[2,3])
a<-table.row.end(a)
a<-table.row.start(a)
a<-table.element(a,'p-value',header=TRUE)
a<-table.element(a,summary(lm1)$coefficients[2,4])
a<-table.row.end(a)
a<-table.end(a)
table.save(a,file='mytable1.tab')
a<-table.start()
a<-table.row.start(a)
a<-table.element(a,'Regression: ln S.E.(k) = alpha + beta * ln Mean(k)',2,TRUE)
a<-table.row.end(a)
a<-table.row.start(a)
a<-table.element(a,'alpha',header=TRUE)
a<-table.element(a,lnlm1$coefficients[[1]])
a<-table.row.end(a)
a<-table.row.start(a)
a<-table.element(a,'beta',header=TRUE)
a<-table.element(a,lnlm1$coefficients[[2]])
a<-table.row.end(a)
a<-table.row.start(a)
a<-table.element(a,'S.D.',header=TRUE)
a<-table.element(a,summary(lnlm1)$coefficients[2,2])
a<-table.row.end(a)
a<-table.row.start(a)
a<-table.element(a,'T-STAT',header=TRUE)
a<-table.element(a,summary(lnlm1)$coefficients[2,3])
a<-table.row.end(a)
a<-table.row.start(a)
a<-table.element(a,'p-value',header=TRUE)
a<-table.element(a,summary(lnlm1)$coefficients[2,4])
a<-table.row.end(a)
a<-table.row.start(a)
a<-table.element(a,'Lambda',header=TRUE)
a<-table.element(a,1-lnlm1$coefficients[[2]])
a<-table.row.end(a)
a<-table.end(a)
table.save(a,file='mytable2.tab')