Free Statistics

of Irreproducible Research!

Author's title

Author*Unverified author*
R Software Modulerwasp_autocorrelation.wasp
Title produced by software(Partial) Autocorrelation Function
Date of computationTue, 16 Aug 2011 06:32:40 -0400
Cite this page as followsStatistical Computations at FreeStatistics.org, Office for Research Development and Education, URL https://freestatistics.org/blog/index.php?v=date/2011/Aug/16/t1313490828i1b7xed257a9v2h.htm/, Retrieved Mon, 13 May 2024 23:35:20 +0000
Statistical Computations at FreeStatistics.org, Office for Research Development and Education, URL https://freestatistics.org/blog/index.php?pk=123828, Retrieved Mon, 13 May 2024 23:35:20 +0000
QR Codes:

Original text written by user:
IsPrivate?No (this computation is public)
User-defined keywordsSébastien Delforge
Estimated Impact166
Family? (F = Feedback message, R = changed R code, M = changed R Module, P = changed Parameters, D = changed Data)
-       [(Partial) Autocorrelation Function] [Tijdreeks 2 - sta...] [2011-08-16 10:32:40] [923770d86edf74ed976a539eae527e37] [Current]
Feedback Forum

Post a new message
Dataseries X:
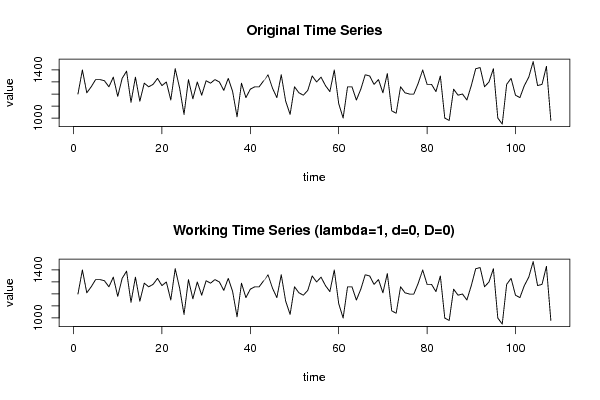
1200
1400
1210
1260
1320
1320
1310
1260
1340
1180
1330
1390
1130
1340
1140
1290
1260
1280
1330
1270
1300
1150
1410
1250
1030
1320
1160
1300
1190
1310
1290
1320
1300
1230
1330
1220
1010
1290
1170
1240
1260
1260
1310
1360
1250
1170
1360
1140
1030
1260
1210
1190
1230
1350
1300
1340
1270
1220
1400
1120
1000
1260
1260
1150
1240
1360
1350
1280
1320
1210
1370
1060
1040
1260
1210
1200
1200
1290
1400
1280
1280
1220
1350
1000
980
1240
1190
1200
1150
1270
1410
1420
1260
1300
1410
1000
950
1280
1330
1190
1170
1270
1340
1470
1270
1280
1430
980


Summary of computational transaction
Raw Inputview raw input (R code)
Raw Outputview raw output of R engine
Computing time2 seconds
R Server'George Udny Yule' @ yule.wessa.net

\begin{tabular}{lllllllll}
\hline
Summary of computational transaction \tabularnewline
Raw Input & view raw input (R code)  \tabularnewline
Raw Output & view raw output of R engine  \tabularnewline
Computing time & 2 seconds \tabularnewline
R Server & 'George Udny Yule' @ yule.wessa.net \tabularnewline
\hline
\end{tabular}
%Source: https://freestatistics.org/blog/index.php?pk=123828&T=0

[TABLE]
[ROW][C]Summary of computational transaction[/C][/ROW]
[ROW][C]Raw Input[/C][C]view raw input (R code) [/C][/ROW]
[ROW][C]Raw Output[/C][C]view raw output of R engine [/C][/ROW]
[ROW][C]Computing time[/C][C]2 seconds[/C][/ROW]
[ROW][C]R Server[/C][C]'George Udny Yule' @ yule.wessa.net[/C][/ROW]
[/TABLE]
Source: https://freestatistics.org/blog/index.php?pk=123828&T=0

Globally Unique Identifier (entire table): ba.freestatistics.org/blog/index.php?pk=123828&T=0

As an alternative you can also use a QR Code:  

The GUIDs for individual cells are displayed in the table below:

Summary of computational transaction
Raw Inputview raw input (R code)
Raw Outputview raw output of R engine
Computing time2 seconds
R Server'George Udny Yule' @ yule.wessa.net


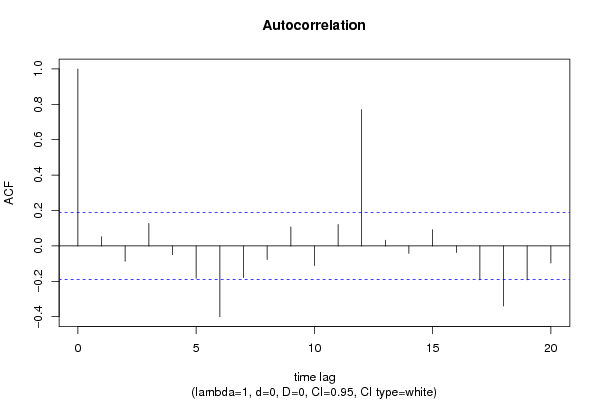
Autocorrelation Function
Time lag kACF(k)T-STATP-value
10.0519270.53960.295278
2-0.087052-0.90470.183826
30.1269411.31920.094944
4-0.049181-0.51110.305163
5-0.182339-1.89490.030388
6-0.399601-4.15283.3e-05
7-0.178583-1.85590.033098
8-0.077055-0.80080.21251
90.1068321.11020.134682
10-0.110436-1.14770.126817
110.1213561.26120.104982
120.778.00210
130.0324040.33670.36848
14-0.041925-0.43570.331961
150.0918130.95420.171069
16-0.037635-0.39110.348242
17-0.191177-1.98680.02474
18-0.339207-3.52510.000311
19-0.190921-1.98410.02489
20-0.096072-0.99840.160156

\begin{tabular}{lllllllll}
\hline
Autocorrelation Function \tabularnewline
Time lag k & ACF(k) & T-STAT & P-value \tabularnewline
1 & 0.051927 & 0.5396 & 0.295278 \tabularnewline
2 & -0.087052 & -0.9047 & 0.183826 \tabularnewline
3 & 0.126941 & 1.3192 & 0.094944 \tabularnewline
4 & -0.049181 & -0.5111 & 0.305163 \tabularnewline
5 & -0.182339 & -1.8949 & 0.030388 \tabularnewline
6 & -0.399601 & -4.1528 & 3.3e-05 \tabularnewline
7 & -0.178583 & -1.8559 & 0.033098 \tabularnewline
8 & -0.077055 & -0.8008 & 0.21251 \tabularnewline
9 & 0.106832 & 1.1102 & 0.134682 \tabularnewline
10 & -0.110436 & -1.1477 & 0.126817 \tabularnewline
11 & 0.121356 & 1.2612 & 0.104982 \tabularnewline
12 & 0.77 & 8.0021 & 0 \tabularnewline
13 & 0.032404 & 0.3367 & 0.36848 \tabularnewline
14 & -0.041925 & -0.4357 & 0.331961 \tabularnewline
15 & 0.091813 & 0.9542 & 0.171069 \tabularnewline
16 & -0.037635 & -0.3911 & 0.348242 \tabularnewline
17 & -0.191177 & -1.9868 & 0.02474 \tabularnewline
18 & -0.339207 & -3.5251 & 0.000311 \tabularnewline
19 & -0.190921 & -1.9841 & 0.02489 \tabularnewline
20 & -0.096072 & -0.9984 & 0.160156 \tabularnewline
\hline
\end{tabular}
%Source: https://freestatistics.org/blog/index.php?pk=123828&T=1

[TABLE]
[ROW][C]Autocorrelation Function[/C][/ROW]
[ROW][C]Time lag k[/C][C]ACF(k)[/C][C]T-STAT[/C][C]P-value[/C][/ROW]
[ROW][C]1[/C][C]0.051927[/C][C]0.5396[/C][C]0.295278[/C][/ROW]
[ROW][C]2[/C][C]-0.087052[/C][C]-0.9047[/C][C]0.183826[/C][/ROW]
[ROW][C]3[/C][C]0.126941[/C][C]1.3192[/C][C]0.094944[/C][/ROW]
[ROW][C]4[/C][C]-0.049181[/C][C]-0.5111[/C][C]0.305163[/C][/ROW]
[ROW][C]5[/C][C]-0.182339[/C][C]-1.8949[/C][C]0.030388[/C][/ROW]
[ROW][C]6[/C][C]-0.399601[/C][C]-4.1528[/C][C]3.3e-05[/C][/ROW]
[ROW][C]7[/C][C]-0.178583[/C][C]-1.8559[/C][C]0.033098[/C][/ROW]
[ROW][C]8[/C][C]-0.077055[/C][C]-0.8008[/C][C]0.21251[/C][/ROW]
[ROW][C]9[/C][C]0.106832[/C][C]1.1102[/C][C]0.134682[/C][/ROW]
[ROW][C]10[/C][C]-0.110436[/C][C]-1.1477[/C][C]0.126817[/C][/ROW]
[ROW][C]11[/C][C]0.121356[/C][C]1.2612[/C][C]0.104982[/C][/ROW]
[ROW][C]12[/C][C]0.77[/C][C]8.0021[/C][C]0[/C][/ROW]
[ROW][C]13[/C][C]0.032404[/C][C]0.3367[/C][C]0.36848[/C][/ROW]
[ROW][C]14[/C][C]-0.041925[/C][C]-0.4357[/C][C]0.331961[/C][/ROW]
[ROW][C]15[/C][C]0.091813[/C][C]0.9542[/C][C]0.171069[/C][/ROW]
[ROW][C]16[/C][C]-0.037635[/C][C]-0.3911[/C][C]0.348242[/C][/ROW]
[ROW][C]17[/C][C]-0.191177[/C][C]-1.9868[/C][C]0.02474[/C][/ROW]
[ROW][C]18[/C][C]-0.339207[/C][C]-3.5251[/C][C]0.000311[/C][/ROW]
[ROW][C]19[/C][C]-0.190921[/C][C]-1.9841[/C][C]0.02489[/C][/ROW]
[ROW][C]20[/C][C]-0.096072[/C][C]-0.9984[/C][C]0.160156[/C][/ROW]
[/TABLE]
Source: https://freestatistics.org/blog/index.php?pk=123828&T=1

Globally Unique Identifier (entire table): ba.freestatistics.org/blog/index.php?pk=123828&T=1

As an alternative you can also use a QR Code:  

The GUIDs for individual cells are displayed in the table below:

Autocorrelation Function
Time lag kACF(k)T-STATP-value
10.0519270.53960.295278
2-0.087052-0.90470.183826
30.1269411.31920.094944
4-0.049181-0.51110.305163
5-0.182339-1.89490.030388
6-0.399601-4.15283.3e-05
7-0.178583-1.85590.033098
8-0.077055-0.80080.21251
90.1068321.11020.134682
10-0.110436-1.14770.126817
110.1213561.26120.104982
120.778.00210
130.0324040.33670.36848
14-0.041925-0.43570.331961
150.0918130.95420.171069
16-0.037635-0.39110.348242
17-0.191177-1.98680.02474
18-0.339207-3.52510.000311
19-0.190921-1.98410.02489
20-0.096072-0.99840.160156


Partial Autocorrelation Function
Time lag kPACF(k)T-STATP-value
10.0519270.53960.295278
2-0.089991-0.93520.175881
30.1380281.43440.077169
4-0.075871-0.78850.216074
5-0.154086-1.60130.056115
6-0.42998-4.46851e-05
7-0.215059-2.2350.013739
8-0.176553-1.83480.034644
90.1976292.05380.021204
10-0.197499-2.05250.021271
110.0416470.43280.33301
120.6597586.85640
130.0368890.38340.351102
140.0075220.07820.468917
15-0.097105-1.00910.157582
16-0.052398-0.54450.293597
17-0.028618-0.29740.383364
180.0829640.86220.195248
19-0.034964-0.36340.358526
20-0.044103-0.45830.323816

\begin{tabular}{lllllllll}
\hline
Partial Autocorrelation Function \tabularnewline
Time lag k & PACF(k) & T-STAT & P-value \tabularnewline
1 & 0.051927 & 0.5396 & 0.295278 \tabularnewline
2 & -0.089991 & -0.9352 & 0.175881 \tabularnewline
3 & 0.138028 & 1.4344 & 0.077169 \tabularnewline
4 & -0.075871 & -0.7885 & 0.216074 \tabularnewline
5 & -0.154086 & -1.6013 & 0.056115 \tabularnewline
6 & -0.42998 & -4.4685 & 1e-05 \tabularnewline
7 & -0.215059 & -2.235 & 0.013739 \tabularnewline
8 & -0.176553 & -1.8348 & 0.034644 \tabularnewline
9 & 0.197629 & 2.0538 & 0.021204 \tabularnewline
10 & -0.197499 & -2.0525 & 0.021271 \tabularnewline
11 & 0.041647 & 0.4328 & 0.33301 \tabularnewline
12 & 0.659758 & 6.8564 & 0 \tabularnewline
13 & 0.036889 & 0.3834 & 0.351102 \tabularnewline
14 & 0.007522 & 0.0782 & 0.468917 \tabularnewline
15 & -0.097105 & -1.0091 & 0.157582 \tabularnewline
16 & -0.052398 & -0.5445 & 0.293597 \tabularnewline
17 & -0.028618 & -0.2974 & 0.383364 \tabularnewline
18 & 0.082964 & 0.8622 & 0.195248 \tabularnewline
19 & -0.034964 & -0.3634 & 0.358526 \tabularnewline
20 & -0.044103 & -0.4583 & 0.323816 \tabularnewline
\hline
\end{tabular}
%Source: https://freestatistics.org/blog/index.php?pk=123828&T=2

[TABLE]
[ROW][C]Partial Autocorrelation Function[/C][/ROW]
[ROW][C]Time lag k[/C][C]PACF(k)[/C][C]T-STAT[/C][C]P-value[/C][/ROW]
[ROW][C]1[/C][C]0.051927[/C][C]0.5396[/C][C]0.295278[/C][/ROW]
[ROW][C]2[/C][C]-0.089991[/C][C]-0.9352[/C][C]0.175881[/C][/ROW]
[ROW][C]3[/C][C]0.138028[/C][C]1.4344[/C][C]0.077169[/C][/ROW]
[ROW][C]4[/C][C]-0.075871[/C][C]-0.7885[/C][C]0.216074[/C][/ROW]
[ROW][C]5[/C][C]-0.154086[/C][C]-1.6013[/C][C]0.056115[/C][/ROW]
[ROW][C]6[/C][C]-0.42998[/C][C]-4.4685[/C][C]1e-05[/C][/ROW]
[ROW][C]7[/C][C]-0.215059[/C][C]-2.235[/C][C]0.013739[/C][/ROW]
[ROW][C]8[/C][C]-0.176553[/C][C]-1.8348[/C][C]0.034644[/C][/ROW]
[ROW][C]9[/C][C]0.197629[/C][C]2.0538[/C][C]0.021204[/C][/ROW]
[ROW][C]10[/C][C]-0.197499[/C][C]-2.0525[/C][C]0.021271[/C][/ROW]
[ROW][C]11[/C][C]0.041647[/C][C]0.4328[/C][C]0.33301[/C][/ROW]
[ROW][C]12[/C][C]0.659758[/C][C]6.8564[/C][C]0[/C][/ROW]
[ROW][C]13[/C][C]0.036889[/C][C]0.3834[/C][C]0.351102[/C][/ROW]
[ROW][C]14[/C][C]0.007522[/C][C]0.0782[/C][C]0.468917[/C][/ROW]
[ROW][C]15[/C][C]-0.097105[/C][C]-1.0091[/C][C]0.157582[/C][/ROW]
[ROW][C]16[/C][C]-0.052398[/C][C]-0.5445[/C][C]0.293597[/C][/ROW]
[ROW][C]17[/C][C]-0.028618[/C][C]-0.2974[/C][C]0.383364[/C][/ROW]
[ROW][C]18[/C][C]0.082964[/C][C]0.8622[/C][C]0.195248[/C][/ROW]
[ROW][C]19[/C][C]-0.034964[/C][C]-0.3634[/C][C]0.358526[/C][/ROW]
[ROW][C]20[/C][C]-0.044103[/C][C]-0.4583[/C][C]0.323816[/C][/ROW]
[/TABLE]
Source: https://freestatistics.org/blog/index.php?pk=123828&T=2

Globally Unique Identifier (entire table): ba.freestatistics.org/blog/index.php?pk=123828&T=2

As an alternative you can also use a QR Code:  

The GUIDs for individual cells are displayed in the table below:

Partial Autocorrelation Function
Time lag kPACF(k)T-STATP-value
10.0519270.53960.295278
2-0.089991-0.93520.175881
30.1380281.43440.077169
4-0.075871-0.78850.216074
5-0.154086-1.60130.056115
6-0.42998-4.46851e-05
7-0.215059-2.2350.013739
8-0.176553-1.83480.034644
90.1976292.05380.021204
10-0.197499-2.05250.021271
110.0416470.43280.33301
120.6597586.85640
130.0368890.38340.351102
140.0075220.07820.468917
15-0.097105-1.00910.157582
16-0.052398-0.54450.293597
17-0.028618-0.29740.383364
180.0829640.86220.195248
19-0.034964-0.36340.358526
20-0.044103-0.45830.323816


Parameters (Session):
Parameters (R input):
par1 = Default ; par2 = 1 ; par3 = 0 ; par4 = 0 ; par5 = 12 ; par6 = White Noise ; par7 = 0.95 ; par8 = ;
R code (references can be found in the software module):
if (par1 == 'Default') {
par1 = 10*log10(length(x))
} else {
par1 <- as.numeric(par1)
}
par2 <- as.numeric(par2)
par3 <- as.numeric(par3)
par4 <- as.numeric(par4)
par5 <- as.numeric(par5)
if (par6 == 'White Noise') par6 <- 'white' else par6 <- 'ma'
par7 <- as.numeric(par7)
if (par8 != '') par8 <- as.numeric(par8)
ox <- x
if (par8 == '') {
if (par2 == 0) {
x <- log(x)
} else {
x <- (x ^ par2 - 1) / par2
}
} else {
x <- log(x,base=par8)
}
if (par3 > 0) x <- diff(x,lag=1,difference=par3)
if (par4 > 0) x <- diff(x,lag=par5,difference=par4)
bitmap(file='picts.png')
op <- par(mfrow=c(2,1))
plot(ox,type='l',main='Original Time Series',xlab='time',ylab='value')
if (par8=='') {
mytitle <- paste('Working Time Series (lambda=',par2,', d=',par3,', D=',par4,')',sep='')
mysub <- paste('(lambda=',par2,', d=',par3,', D=',par4,', CI=', par7, ', CI type=',par6,')',sep='')
} else {
mytitle <- paste('Working Time Series (base=',par8,', d=',par3,', D=',par4,')',sep='')
mysub <- paste('(base=',par8,', d=',par3,', D=',par4,', CI=', par7, ', CI type=',par6,')',sep='')
}
plot(x,type='l', main=mytitle,xlab='time',ylab='value')
par(op)
dev.off()
bitmap(file='pic1.png')
racf <- acf(x, par1, main='Autocorrelation', xlab='time lag', ylab='ACF', ci.type=par6, ci=par7, sub=mysub)
dev.off()
bitmap(file='pic2.png')
rpacf <- pacf(x,par1,main='Partial Autocorrelation',xlab='lags',ylab='PACF',sub=mysub)
dev.off()
(myacf <- c(racf$acf))
(mypacf <- c(rpacf$acf))
lengthx <- length(x)
sqrtn <- sqrt(lengthx)
load(file='createtable')
a<-table.start()
a<-table.row.start(a)
a<-table.element(a,'Autocorrelation Function',4,TRUE)
a<-table.row.end(a)
a<-table.row.start(a)
a<-table.element(a,'Time lag k',header=TRUE)
a<-table.element(a,hyperlink('basics.htm','ACF(k)','click here for more information about the Autocorrelation Function'),header=TRUE)
a<-table.element(a,'T-STAT',header=TRUE)
a<-table.element(a,'P-value',header=TRUE)
a<-table.row.end(a)
for (i in 2:(par1+1)) {
a<-table.row.start(a)
a<-table.element(a,i-1,header=TRUE)
a<-table.element(a,round(myacf[i],6))
mytstat <- myacf[i]*sqrtn
a<-table.element(a,round(mytstat,4))
a<-table.element(a,round(1-pt(abs(mytstat),lengthx),6))
a<-table.row.end(a)
}
a<-table.end(a)
table.save(a,file='mytable.tab')
a<-table.start()
a<-table.row.start(a)
a<-table.element(a,'Partial Autocorrelation Function',4,TRUE)
a<-table.row.end(a)
a<-table.row.start(a)
a<-table.element(a,'Time lag k',header=TRUE)
a<-table.element(a,hyperlink('basics.htm','PACF(k)','click here for more information about the Partial Autocorrelation Function'),header=TRUE)
a<-table.element(a,'T-STAT',header=TRUE)
a<-table.element(a,'P-value',header=TRUE)
a<-table.row.end(a)
for (i in 1:par1) {
a<-table.row.start(a)
a<-table.element(a,i,header=TRUE)
a<-table.element(a,round(mypacf[i],6))
mytstat <- mypacf[i]*sqrtn
a<-table.element(a,round(mytstat,4))
a<-table.element(a,round(1-pt(abs(mytstat),lengthx),6))
a<-table.row.end(a)
}
a<-table.end(a)
table.save(a,file='mytable1.tab')