Free Statistics

of Irreproducible Research!

Author's title

Author*Unverified author*
R Software Modulerwasp_smp.wasp
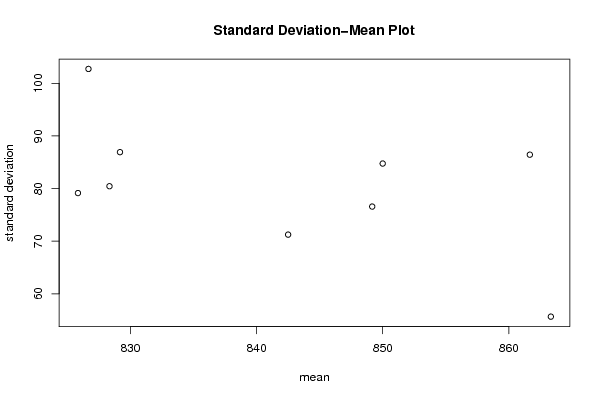
Title produced by softwareStandard Deviation-Mean Plot
Date of computationMon, 15 Aug 2011 12:44:46 -0400
Cite this page as followsStatistical Computations at FreeStatistics.org, Office for Research Development and Education, URL https://freestatistics.org/blog/index.php?v=date/2011/Aug/15/t1313426867sqyepn9hozf90db.htm/, Retrieved Tue, 14 May 2024 07:20:54 +0000
Statistical Computations at FreeStatistics.org, Office for Research Development and Education, URL https://freestatistics.org/blog/index.php?pk=123799, Retrieved Tue, 14 May 2024 07:20:54 +0000
QR Codes:

Original text written by user:
IsPrivate?No (this computation is public)
User-defined keywordsBerns Sophie
Estimated Impact85
Family? (F = Feedback message, R = changed R code, M = changed R Module, P = changed Parameters, D = changed Data)
-       [Standard Deviation-Mean Plot] [Tijdreeks B - Sta...] [2011-08-15 16:44:46] [adf65953347764930908a56f01d4e8ba] [Current]
Feedback Forum

Post a new message
Dataseries X:
860
950
780
840
840
900
860
810
870
930
790
930
820
930
730
860
800
890
850
890
850
1040
740
940
790
920
770
780
770
890
890
860
830
1020
740
940
780
860
820
760
780
900
820
980
830
930
770
960
750
850
850
820
730
960
760
940
880
890
830
850
850
860
800
840
760
910
650
990
780
910
820
780
890
810
830
890
760
860
670
940
740
920
800
800
920
810
790
850
780
900
710
960
760
920
740
800
870
740
710
900
740
880
700
1040
880
900
820
740


Summary of computational transaction
Raw Inputview raw input (R code)
Raw Outputview raw output of R engine
Computing time1 seconds
R Server'Gwilym Jenkins' @ jenkins.wessa.net

\begin{tabular}{lllllllll}
\hline
Summary of computational transaction \tabularnewline
Raw Input & view raw input (R code)  \tabularnewline
Raw Output & view raw output of R engine  \tabularnewline
Computing time & 1 seconds \tabularnewline
R Server & 'Gwilym Jenkins' @ jenkins.wessa.net \tabularnewline
\hline
\end{tabular}
%Source: https://freestatistics.org/blog/index.php?pk=123799&T=0

[TABLE]
[ROW][C]Summary of computational transaction[/C][/ROW]
[ROW][C]Raw Input[/C][C]view raw input (R code) [/C][/ROW]
[ROW][C]Raw Output[/C][C]view raw output of R engine [/C][/ROW]
[ROW][C]Computing time[/C][C]1 seconds[/C][/ROW]
[ROW][C]R Server[/C][C]'Gwilym Jenkins' @ jenkins.wessa.net[/C][/ROW]
[/TABLE]
Source: https://freestatistics.org/blog/index.php?pk=123799&T=0

Globally Unique Identifier (entire table): ba.freestatistics.org/blog/index.php?pk=123799&T=0

As an alternative you can also use a QR Code:  

The GUIDs for individual cells are displayed in the table below:

Summary of computational transaction
Raw Inputview raw input (R code)
Raw Outputview raw output of R engine
Computing time1 seconds
R Server'Gwilym Jenkins' @ jenkins.wessa.net


Standard Deviation-Mean Plot
SectionMeanStandard DeviationRange
1863.33333333333355.6504240502235170
2861.66666666666786.4274086716533310
385084.7456086285194280
4849.16666666666776.5694376881454220
5842.571.239034243875230
6829.16666666666786.9125300447978340
7825.83333333333379.1383521933505270
8828.33333333333380.4344265205948250
9826.666666666667102.720568298249340

\begin{tabular}{lllllllll}
\hline
Standard Deviation-Mean Plot \tabularnewline
Section & Mean & Standard Deviation & Range \tabularnewline
1 & 863.333333333333 & 55.6504240502235 & 170 \tabularnewline
2 & 861.666666666667 & 86.4274086716533 & 310 \tabularnewline
3 & 850 & 84.7456086285194 & 280 \tabularnewline
4 & 849.166666666667 & 76.5694376881454 & 220 \tabularnewline
5 & 842.5 & 71.239034243875 & 230 \tabularnewline
6 & 829.166666666667 & 86.9125300447978 & 340 \tabularnewline
7 & 825.833333333333 & 79.1383521933505 & 270 \tabularnewline
8 & 828.333333333333 & 80.4344265205948 & 250 \tabularnewline
9 & 826.666666666667 & 102.720568298249 & 340 \tabularnewline
\hline
\end{tabular}
%Source: https://freestatistics.org/blog/index.php?pk=123799&T=1

[TABLE]
[ROW][C]Standard Deviation-Mean Plot[/C][/ROW]
[ROW][C]Section[/C][C]Mean[/C][C]Standard Deviation[/C][C]Range[/C][/ROW]
[ROW][C]1[/C][C]863.333333333333[/C][C]55.6504240502235[/C][C]170[/C][/ROW]
[ROW][C]2[/C][C]861.666666666667[/C][C]86.4274086716533[/C][C]310[/C][/ROW]
[ROW][C]3[/C][C]850[/C][C]84.7456086285194[/C][C]280[/C][/ROW]
[ROW][C]4[/C][C]849.166666666667[/C][C]76.5694376881454[/C][C]220[/C][/ROW]
[ROW][C]5[/C][C]842.5[/C][C]71.239034243875[/C][C]230[/C][/ROW]
[ROW][C]6[/C][C]829.166666666667[/C][C]86.9125300447978[/C][C]340[/C][/ROW]
[ROW][C]7[/C][C]825.833333333333[/C][C]79.1383521933505[/C][C]270[/C][/ROW]
[ROW][C]8[/C][C]828.333333333333[/C][C]80.4344265205948[/C][C]250[/C][/ROW]
[ROW][C]9[/C][C]826.666666666667[/C][C]102.720568298249[/C][C]340[/C][/ROW]
[/TABLE]
Source: https://freestatistics.org/blog/index.php?pk=123799&T=1

Globally Unique Identifier (entire table): ba.freestatistics.org/blog/index.php?pk=123799&T=1

As an alternative you can also use a QR Code:  

The GUIDs for individual cells are displayed in the table below:

Standard Deviation-Mean Plot
SectionMeanStandard DeviationRange
1863.33333333333355.6504240502235170
2861.66666666666786.4274086716533310
385084.7456086285194280
4849.16666666666776.5694376881454220
5842.571.239034243875230
6829.16666666666786.9125300447978340
7825.83333333333379.1383521933505270
8828.33333333333380.4344265205948250
9826.666666666667102.720568298249340


Regression: S.E.(k) = alpha + beta * Mean(k)
alpha459.364024076604
beta-0.450123857415314
S.D.0.273143876965764
T-STAT-1.64793683979134
p-value0.14335661277268

\begin{tabular}{lllllllll}
\hline
Regression: S.E.(k) = alpha + beta * Mean(k) \tabularnewline
alpha & 459.364024076604 \tabularnewline
beta & -0.450123857415314 \tabularnewline
S.D. & 0.273143876965764 \tabularnewline
T-STAT & -1.64793683979134 \tabularnewline
p-value & 0.14335661277268 \tabularnewline
\hline
\end{tabular}
%Source: https://freestatistics.org/blog/index.php?pk=123799&T=2

[TABLE]
[ROW][C]Regression: S.E.(k) = alpha + beta * Mean(k)[/C][/ROW]
[ROW][C]alpha[/C][C]459.364024076604[/C][/ROW]
[ROW][C]beta[/C][C]-0.450123857415314[/C][/ROW]
[ROW][C]S.D.[/C][C]0.273143876965764[/C][/ROW]
[ROW][C]T-STAT[/C][C]-1.64793683979134[/C][/ROW]
[ROW][C]p-value[/C][C]0.14335661277268[/C][/ROW]
[/TABLE]
Source: https://freestatistics.org/blog/index.php?pk=123799&T=2

Globally Unique Identifier (entire table): ba.freestatistics.org/blog/index.php?pk=123799&T=2

As an alternative you can also use a QR Code:  

The GUIDs for individual cells are displayed in the table below:

Regression: S.E.(k) = alpha + beta * Mean(k)
alpha459.364024076604
beta-0.450123857415314
S.D.0.273143876965764
T-STAT-1.64793683979134
p-value0.14335661277268


Regression: ln S.E.(k) = alpha + beta * ln Mean(k)
alpha38.7734350158236
beta-5.10701635515207
S.D.2.99511661696236
T-STAT-1.7051143605659
p-value0.131944086656216
Lambda6.10701635515207

\begin{tabular}{lllllllll}
\hline
Regression: ln S.E.(k) = alpha + beta * ln Mean(k) \tabularnewline
alpha & 38.7734350158236 \tabularnewline
beta & -5.10701635515207 \tabularnewline
S.D. & 2.99511661696236 \tabularnewline
T-STAT & -1.7051143605659 \tabularnewline
p-value & 0.131944086656216 \tabularnewline
Lambda & 6.10701635515207 \tabularnewline
\hline
\end{tabular}
%Source: https://freestatistics.org/blog/index.php?pk=123799&T=3

[TABLE]
[ROW][C]Regression: ln S.E.(k) = alpha + beta * ln Mean(k)[/C][/ROW]
[ROW][C]alpha[/C][C]38.7734350158236[/C][/ROW]
[ROW][C]beta[/C][C]-5.10701635515207[/C][/ROW]
[ROW][C]S.D.[/C][C]2.99511661696236[/C][/ROW]
[ROW][C]T-STAT[/C][C]-1.7051143605659[/C][/ROW]
[ROW][C]p-value[/C][C]0.131944086656216[/C][/ROW]
[ROW][C]Lambda[/C][C]6.10701635515207[/C][/ROW]
[/TABLE]
Source: https://freestatistics.org/blog/index.php?pk=123799&T=3

Globally Unique Identifier (entire table): ba.freestatistics.org/blog/index.php?pk=123799&T=3

As an alternative you can also use a QR Code:  

The GUIDs for individual cells are displayed in the table below:

Regression: ln S.E.(k) = alpha + beta * ln Mean(k)
alpha38.7734350158236
beta-5.10701635515207
S.D.2.99511661696236
T-STAT-1.7051143605659
p-value0.131944086656216
Lambda6.10701635515207


Parameters (Session):
par1 = 48 ; par2 = 1 ; par3 = 0 ; par4 = 0 ; par5 = 12 ; par6 = White Noise ; par7 = 0.95 ;
Parameters (R input):
par1 = 12 ;
R code (references can be found in the software module):
par1 <- as.numeric(par1)
(n <- length(x))
(np <- floor(n / par1))
arr <- array(NA,dim=c(par1,np))
j <- 0
k <- 1
for (i in 1:(np*par1))
{
j = j + 1
arr[j,k] <- x[i]
if (j == par1) {
j = 0
k=k+1
}
}
arr
arr.mean <- array(NA,dim=np)
arr.sd <- array(NA,dim=np)
arr.range <- array(NA,dim=np)
for (j in 1:np)
{
arr.mean[j] <- mean(arr[,j],na.rm=TRUE)
arr.sd[j] <- sd(arr[,j],na.rm=TRUE)
arr.range[j] <- max(arr[,j],na.rm=TRUE) - min(arr[,j],na.rm=TRUE)
}
arr.mean
arr.sd
arr.range
(lm1 <- lm(arr.sd~arr.mean))
(lnlm1 <- lm(log(arr.sd)~log(arr.mean)))
(lm2 <- lm(arr.range~arr.mean))
bitmap(file='test1.png')
plot(arr.mean,arr.sd,main='Standard Deviation-Mean Plot',xlab='mean',ylab='standard deviation')
dev.off()
bitmap(file='test2.png')
plot(arr.mean,arr.range,main='Range-Mean Plot',xlab='mean',ylab='range')
dev.off()
load(file='createtable')
a<-table.start()
a<-table.row.start(a)
a<-table.element(a,'Standard Deviation-Mean Plot',4,TRUE)
a<-table.row.end(a)
a<-table.row.start(a)
a<-table.element(a,'Section',header=TRUE)
a<-table.element(a,'Mean',header=TRUE)
a<-table.element(a,'Standard Deviation',header=TRUE)
a<-table.element(a,'Range',header=TRUE)
a<-table.row.end(a)
for (j in 1:np) {
a<-table.row.start(a)
a<-table.element(a,j,header=TRUE)
a<-table.element(a,arr.mean[j])
a<-table.element(a,arr.sd[j] )
a<-table.element(a,arr.range[j] )
a<-table.row.end(a)
}
a<-table.end(a)
table.save(a,file='mytable.tab')
a<-table.start()
a<-table.row.start(a)
a<-table.element(a,'Regression: S.E.(k) = alpha + beta * Mean(k)',2,TRUE)
a<-table.row.end(a)
a<-table.row.start(a)
a<-table.element(a,'alpha',header=TRUE)
a<-table.element(a,lm1$coefficients[[1]])
a<-table.row.end(a)
a<-table.row.start(a)
a<-table.element(a,'beta',header=TRUE)
a<-table.element(a,lm1$coefficients[[2]])
a<-table.row.end(a)
a<-table.row.start(a)
a<-table.element(a,'S.D.',header=TRUE)
a<-table.element(a,summary(lm1)$coefficients[2,2])
a<-table.row.end(a)
a<-table.row.start(a)
a<-table.element(a,'T-STAT',header=TRUE)
a<-table.element(a,summary(lm1)$coefficients[2,3])
a<-table.row.end(a)
a<-table.row.start(a)
a<-table.element(a,'p-value',header=TRUE)
a<-table.element(a,summary(lm1)$coefficients[2,4])
a<-table.row.end(a)
a<-table.end(a)
table.save(a,file='mytable1.tab')
a<-table.start()
a<-table.row.start(a)
a<-table.element(a,'Regression: ln S.E.(k) = alpha + beta * ln Mean(k)',2,TRUE)
a<-table.row.end(a)
a<-table.row.start(a)
a<-table.element(a,'alpha',header=TRUE)
a<-table.element(a,lnlm1$coefficients[[1]])
a<-table.row.end(a)
a<-table.row.start(a)
a<-table.element(a,'beta',header=TRUE)
a<-table.element(a,lnlm1$coefficients[[2]])
a<-table.row.end(a)
a<-table.row.start(a)
a<-table.element(a,'S.D.',header=TRUE)
a<-table.element(a,summary(lnlm1)$coefficients[2,2])
a<-table.row.end(a)
a<-table.row.start(a)
a<-table.element(a,'T-STAT',header=TRUE)
a<-table.element(a,summary(lnlm1)$coefficients[2,3])
a<-table.row.end(a)
a<-table.row.start(a)
a<-table.element(a,'p-value',header=TRUE)
a<-table.element(a,summary(lnlm1)$coefficients[2,4])
a<-table.row.end(a)
a<-table.row.start(a)
a<-table.element(a,'Lambda',header=TRUE)
a<-table.element(a,1-lnlm1$coefficients[[2]])
a<-table.row.end(a)
a<-table.end(a)
table.save(a,file='mytable2.tab')