Free Statistics

of Irreproducible Research!

Author's title

Author*Unverified author*
R Software Modulerwasp_autocorrelation.wasp
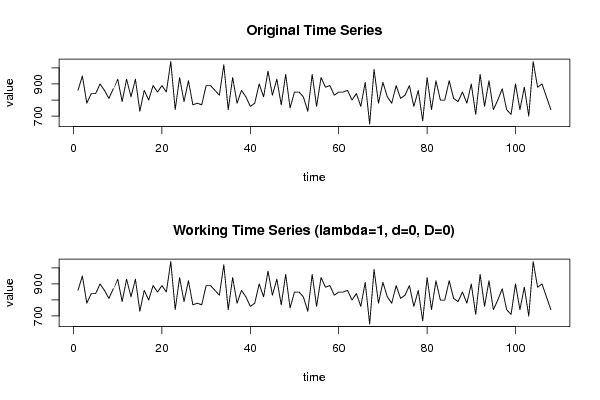
Title produced by software(Partial) Autocorrelation Function
Date of computationMon, 15 Aug 2011 12:27:16 -0400
Cite this page as followsStatistical Computations at FreeStatistics.org, Office for Research Development and Education, URL https://freestatistics.org/blog/index.php?v=date/2011/Aug/15/t1313425697x7q361wx9hx5ogf.htm/, Retrieved Tue, 14 May 2024 11:42:19 +0000
Statistical Computations at FreeStatistics.org, Office for Research Development and Education, URL https://freestatistics.org/blog/index.php?pk=123797, Retrieved Tue, 14 May 2024 11:42:19 +0000
QR Codes:

Original text written by user:
IsPrivate?No (this computation is public)
User-defined keywordsberns Sophie
Estimated Impact106
Family? (F = Feedback message, R = changed R code, M = changed R Module, P = changed Parameters, D = changed Data)
-       [(Partial) Autocorrelation Function] [Tijdreeks B - Sta...] [2011-08-15 16:27:16] [adf65953347764930908a56f01d4e8ba] [Current]
Feedback Forum

Post a new message
Dataseries X:
860
950
780
840
840
900
860
810
870
930
790
930
820
930
730
860
800
890
850
890
850
1040
740
940
790
920
770
780
770
890
890
860
830
1020
740
940
780
860
820
760
780
900
820
980
830
930
770
960
750
850
850
820
730
960
760
940
880
890
830
850
850
860
800
840
760
910
650
990
780
910
820
780
890
810
830
890
760
860
670
940
740
920
800
800
920
810
790
850
780
900
710
960
760
920
740
800
870
740
710
900
740
880
700
1040
880
900
820
740


Summary of computational transaction
Raw Inputview raw input (R code)
Raw Outputview raw output of R engine
Computing time1 seconds
R Server'Herman Ole Andreas Wold' @ wold.wessa.net

\begin{tabular}{lllllllll}
\hline
Summary of computational transaction \tabularnewline
Raw Input & view raw input (R code)  \tabularnewline
Raw Output & view raw output of R engine  \tabularnewline
Computing time & 1 seconds \tabularnewline
R Server & 'Herman Ole Andreas Wold' @ wold.wessa.net \tabularnewline
\hline
\end{tabular}
%Source: https://freestatistics.org/blog/index.php?pk=123797&T=0

[TABLE]
[ROW][C]Summary of computational transaction[/C][/ROW]
[ROW][C]Raw Input[/C][C]view raw input (R code) [/C][/ROW]
[ROW][C]Raw Output[/C][C]view raw output of R engine [/C][/ROW]
[ROW][C]Computing time[/C][C]1 seconds[/C][/ROW]
[ROW][C]R Server[/C][C]'Herman Ole Andreas Wold' @ wold.wessa.net[/C][/ROW]
[/TABLE]
Source: https://freestatistics.org/blog/index.php?pk=123797&T=0

Globally Unique Identifier (entire table): ba.freestatistics.org/blog/index.php?pk=123797&T=0

As an alternative you can also use a QR Code:  

The GUIDs for individual cells are displayed in the table below:

Summary of computational transaction
Raw Inputview raw input (R code)
Raw Outputview raw output of R engine
Computing time1 seconds
R Server'Herman Ole Andreas Wold' @ wold.wessa.net


Autocorrelation Function
Time lag kACF(k)T-STATP-value
1-0.515533-5.35760
20.4468194.64355e-06
3-0.29724-3.0890.001277
40.190721.9820.025009
5-0.158072-1.64270.051673
60.0167410.1740.431106
7-0.195539-2.03210.022299
80.2576582.67770.004286
9-0.317771-3.30240.00065
100.4470134.64555e-06
11-0.455344-4.73213e-06
120.7077027.35470
13-0.421779-4.38331.4e-05
140.3844813.99565.9e-05
15-0.240505-2.49940.006972
160.1132431.17690.120921
17-0.112288-1.16690.122905
180.0733170.76190.22388
19-0.23015-2.39180.009248
200.3284873.41370.000452
21-0.329182-3.4210.000441
220.3805363.95466.9e-05
23-0.371714-3.8639.6e-05
240.4822265.01141e-06
25-0.29963-3.11380.001182
260.2711182.81750.002878
27-0.222924-2.31670.011204
280.1278891.32910.093315
29-0.131633-1.3680.087081
300.1231971.28030.101591
31-0.236447-2.45720.007796
320.3324013.45440.000395
33-0.379912-3.94827e-05
340.3408013.54170.000294
35-0.257996-2.68120.004244
360.2923563.03820.001492
37-0.183859-1.91070.029346
380.1863151.93620.027726
39-0.164366-1.70810.045242
400.1195331.24220.108423
41-0.201324-2.09220.019381
420.1677551.74340.042058
43-0.234816-2.44030.008151
440.2629562.73270.00367
45-0.32206-3.34690.000563
460.2753262.86130.002534
47-0.201141-2.09030.019468
480.1779641.84950.033564

\begin{tabular}{lllllllll}
\hline
Autocorrelation Function \tabularnewline
Time lag k & ACF(k) & T-STAT & P-value \tabularnewline
1 & -0.515533 & -5.3576 & 0 \tabularnewline
2 & 0.446819 & 4.6435 & 5e-06 \tabularnewline
3 & -0.29724 & -3.089 & 0.001277 \tabularnewline
4 & 0.19072 & 1.982 & 0.025009 \tabularnewline
5 & -0.158072 & -1.6427 & 0.051673 \tabularnewline
6 & 0.016741 & 0.174 & 0.431106 \tabularnewline
7 & -0.195539 & -2.0321 & 0.022299 \tabularnewline
8 & 0.257658 & 2.6777 & 0.004286 \tabularnewline
9 & -0.317771 & -3.3024 & 0.00065 \tabularnewline
10 & 0.447013 & 4.6455 & 5e-06 \tabularnewline
11 & -0.455344 & -4.7321 & 3e-06 \tabularnewline
12 & 0.707702 & 7.3547 & 0 \tabularnewline
13 & -0.421779 & -4.3833 & 1.4e-05 \tabularnewline
14 & 0.384481 & 3.9956 & 5.9e-05 \tabularnewline
15 & -0.240505 & -2.4994 & 0.006972 \tabularnewline
16 & 0.113243 & 1.1769 & 0.120921 \tabularnewline
17 & -0.112288 & -1.1669 & 0.122905 \tabularnewline
18 & 0.073317 & 0.7619 & 0.22388 \tabularnewline
19 & -0.23015 & -2.3918 & 0.009248 \tabularnewline
20 & 0.328487 & 3.4137 & 0.000452 \tabularnewline
21 & -0.329182 & -3.421 & 0.000441 \tabularnewline
22 & 0.380536 & 3.9546 & 6.9e-05 \tabularnewline
23 & -0.371714 & -3.863 & 9.6e-05 \tabularnewline
24 & 0.482226 & 5.0114 & 1e-06 \tabularnewline
25 & -0.29963 & -3.1138 & 0.001182 \tabularnewline
26 & 0.271118 & 2.8175 & 0.002878 \tabularnewline
27 & -0.222924 & -2.3167 & 0.011204 \tabularnewline
28 & 0.127889 & 1.3291 & 0.093315 \tabularnewline
29 & -0.131633 & -1.368 & 0.087081 \tabularnewline
30 & 0.123197 & 1.2803 & 0.101591 \tabularnewline
31 & -0.236447 & -2.4572 & 0.007796 \tabularnewline
32 & 0.332401 & 3.4544 & 0.000395 \tabularnewline
33 & -0.379912 & -3.9482 & 7e-05 \tabularnewline
34 & 0.340801 & 3.5417 & 0.000294 \tabularnewline
35 & -0.257996 & -2.6812 & 0.004244 \tabularnewline
36 & 0.292356 & 3.0382 & 0.001492 \tabularnewline
37 & -0.183859 & -1.9107 & 0.029346 \tabularnewline
38 & 0.186315 & 1.9362 & 0.027726 \tabularnewline
39 & -0.164366 & -1.7081 & 0.045242 \tabularnewline
40 & 0.119533 & 1.2422 & 0.108423 \tabularnewline
41 & -0.201324 & -2.0922 & 0.019381 \tabularnewline
42 & 0.167755 & 1.7434 & 0.042058 \tabularnewline
43 & -0.234816 & -2.4403 & 0.008151 \tabularnewline
44 & 0.262956 & 2.7327 & 0.00367 \tabularnewline
45 & -0.32206 & -3.3469 & 0.000563 \tabularnewline
46 & 0.275326 & 2.8613 & 0.002534 \tabularnewline
47 & -0.201141 & -2.0903 & 0.019468 \tabularnewline
48 & 0.177964 & 1.8495 & 0.033564 \tabularnewline
\hline
\end{tabular}
%Source: https://freestatistics.org/blog/index.php?pk=123797&T=1

[TABLE]
[ROW][C]Autocorrelation Function[/C][/ROW]
[ROW][C]Time lag k[/C][C]ACF(k)[/C][C]T-STAT[/C][C]P-value[/C][/ROW]
[ROW][C]1[/C][C]-0.515533[/C][C]-5.3576[/C][C]0[/C][/ROW]
[ROW][C]2[/C][C]0.446819[/C][C]4.6435[/C][C]5e-06[/C][/ROW]
[ROW][C]3[/C][C]-0.29724[/C][C]-3.089[/C][C]0.001277[/C][/ROW]
[ROW][C]4[/C][C]0.19072[/C][C]1.982[/C][C]0.025009[/C][/ROW]
[ROW][C]5[/C][C]-0.158072[/C][C]-1.6427[/C][C]0.051673[/C][/ROW]
[ROW][C]6[/C][C]0.016741[/C][C]0.174[/C][C]0.431106[/C][/ROW]
[ROW][C]7[/C][C]-0.195539[/C][C]-2.0321[/C][C]0.022299[/C][/ROW]
[ROW][C]8[/C][C]0.257658[/C][C]2.6777[/C][C]0.004286[/C][/ROW]
[ROW][C]9[/C][C]-0.317771[/C][C]-3.3024[/C][C]0.00065[/C][/ROW]
[ROW][C]10[/C][C]0.447013[/C][C]4.6455[/C][C]5e-06[/C][/ROW]
[ROW][C]11[/C][C]-0.455344[/C][C]-4.7321[/C][C]3e-06[/C][/ROW]
[ROW][C]12[/C][C]0.707702[/C][C]7.3547[/C][C]0[/C][/ROW]
[ROW][C]13[/C][C]-0.421779[/C][C]-4.3833[/C][C]1.4e-05[/C][/ROW]
[ROW][C]14[/C][C]0.384481[/C][C]3.9956[/C][C]5.9e-05[/C][/ROW]
[ROW][C]15[/C][C]-0.240505[/C][C]-2.4994[/C][C]0.006972[/C][/ROW]
[ROW][C]16[/C][C]0.113243[/C][C]1.1769[/C][C]0.120921[/C][/ROW]
[ROW][C]17[/C][C]-0.112288[/C][C]-1.1669[/C][C]0.122905[/C][/ROW]
[ROW][C]18[/C][C]0.073317[/C][C]0.7619[/C][C]0.22388[/C][/ROW]
[ROW][C]19[/C][C]-0.23015[/C][C]-2.3918[/C][C]0.009248[/C][/ROW]
[ROW][C]20[/C][C]0.328487[/C][C]3.4137[/C][C]0.000452[/C][/ROW]
[ROW][C]21[/C][C]-0.329182[/C][C]-3.421[/C][C]0.000441[/C][/ROW]
[ROW][C]22[/C][C]0.380536[/C][C]3.9546[/C][C]6.9e-05[/C][/ROW]
[ROW][C]23[/C][C]-0.371714[/C][C]-3.863[/C][C]9.6e-05[/C][/ROW]
[ROW][C]24[/C][C]0.482226[/C][C]5.0114[/C][C]1e-06[/C][/ROW]
[ROW][C]25[/C][C]-0.29963[/C][C]-3.1138[/C][C]0.001182[/C][/ROW]
[ROW][C]26[/C][C]0.271118[/C][C]2.8175[/C][C]0.002878[/C][/ROW]
[ROW][C]27[/C][C]-0.222924[/C][C]-2.3167[/C][C]0.011204[/C][/ROW]
[ROW][C]28[/C][C]0.127889[/C][C]1.3291[/C][C]0.093315[/C][/ROW]
[ROW][C]29[/C][C]-0.131633[/C][C]-1.368[/C][C]0.087081[/C][/ROW]
[ROW][C]30[/C][C]0.123197[/C][C]1.2803[/C][C]0.101591[/C][/ROW]
[ROW][C]31[/C][C]-0.236447[/C][C]-2.4572[/C][C]0.007796[/C][/ROW]
[ROW][C]32[/C][C]0.332401[/C][C]3.4544[/C][C]0.000395[/C][/ROW]
[ROW][C]33[/C][C]-0.379912[/C][C]-3.9482[/C][C]7e-05[/C][/ROW]
[ROW][C]34[/C][C]0.340801[/C][C]3.5417[/C][C]0.000294[/C][/ROW]
[ROW][C]35[/C][C]-0.257996[/C][C]-2.6812[/C][C]0.004244[/C][/ROW]
[ROW][C]36[/C][C]0.292356[/C][C]3.0382[/C][C]0.001492[/C][/ROW]
[ROW][C]37[/C][C]-0.183859[/C][C]-1.9107[/C][C]0.029346[/C][/ROW]
[ROW][C]38[/C][C]0.186315[/C][C]1.9362[/C][C]0.027726[/C][/ROW]
[ROW][C]39[/C][C]-0.164366[/C][C]-1.7081[/C][C]0.045242[/C][/ROW]
[ROW][C]40[/C][C]0.119533[/C][C]1.2422[/C][C]0.108423[/C][/ROW]
[ROW][C]41[/C][C]-0.201324[/C][C]-2.0922[/C][C]0.019381[/C][/ROW]
[ROW][C]42[/C][C]0.167755[/C][C]1.7434[/C][C]0.042058[/C][/ROW]
[ROW][C]43[/C][C]-0.234816[/C][C]-2.4403[/C][C]0.008151[/C][/ROW]
[ROW][C]44[/C][C]0.262956[/C][C]2.7327[/C][C]0.00367[/C][/ROW]
[ROW][C]45[/C][C]-0.32206[/C][C]-3.3469[/C][C]0.000563[/C][/ROW]
[ROW][C]46[/C][C]0.275326[/C][C]2.8613[/C][C]0.002534[/C][/ROW]
[ROW][C]47[/C][C]-0.201141[/C][C]-2.0903[/C][C]0.019468[/C][/ROW]
[ROW][C]48[/C][C]0.177964[/C][C]1.8495[/C][C]0.033564[/C][/ROW]
[/TABLE]
Source: https://freestatistics.org/blog/index.php?pk=123797&T=1

Globally Unique Identifier (entire table): ba.freestatistics.org/blog/index.php?pk=123797&T=1

As an alternative you can also use a QR Code:  

The GUIDs for individual cells are displayed in the table below:

Autocorrelation Function
Time lag kACF(k)T-STATP-value
1-0.515533-5.35760
20.4468194.64355e-06
3-0.29724-3.0890.001277
40.190721.9820.025009
5-0.158072-1.64270.051673
60.0167410.1740.431106
7-0.195539-2.03210.022299
80.2576582.67770.004286
9-0.317771-3.30240.00065
100.4470134.64555e-06
11-0.455344-4.73213e-06
120.7077027.35470
13-0.421779-4.38331.4e-05
140.3844813.99565.9e-05
15-0.240505-2.49940.006972
160.1132431.17690.120921
17-0.112288-1.16690.122905
180.0733170.76190.22388
19-0.23015-2.39180.009248
200.3284873.41370.000452
21-0.329182-3.4210.000441
220.3805363.95466.9e-05
23-0.371714-3.8639.6e-05
240.4822265.01141e-06
25-0.29963-3.11380.001182
260.2711182.81750.002878
27-0.222924-2.31670.011204
280.1278891.32910.093315
29-0.131633-1.3680.087081
300.1231971.28030.101591
31-0.236447-2.45720.007796
320.3324013.45440.000395
33-0.379912-3.94827e-05
340.3408013.54170.000294
35-0.257996-2.68120.004244
360.2923563.03820.001492
37-0.183859-1.91070.029346
380.1863151.93620.027726
39-0.164366-1.70810.045242
400.1195331.24220.108423
41-0.201324-2.09220.019381
420.1677551.74340.042058
43-0.234816-2.44030.008151
440.2629562.73270.00367
45-0.32206-3.34690.000563
460.2753262.86130.002534
47-0.201141-2.09030.019468
480.1779641.84950.033564


Partial Autocorrelation Function
Time lag kPACF(k)T-STATP-value
1-0.515533-5.35760
20.2465782.56250.005885
30.0049730.05170.479438
4-0.048686-0.5060.30696
5-0.036614-0.38050.352161
6-0.126308-1.31260.096044
7-0.271759-2.82420.002823
80.2121472.20470.014798
9-0.104086-1.08170.140899
100.2312352.40310.008982
11-0.150547-1.56450.06031
120.4986115.18171e-06
130.099361.03260.152054
140.0381890.39690.346123
150.0691790.71890.23687
16-0.089589-0.9310.176955
170.0219790.22840.40988
180.1125541.16970.122349
19-0.041988-0.43640.331724
200.1124741.16890.122516
210.0725870.75430.226142
22-0.157627-1.63810.052155
230.0133270.13850.445052
24-0.00312-0.03240.487097
250.0179380.18640.426234
260.0105870.110.456299
27-0.096981-1.00790.157888
28-0.008575-0.08910.464577
29-0.014962-0.15550.438363
30-0.00967-0.10050.46007
310.0187670.1950.422868
320.0038490.040.484082
33-0.196136-2.03830.021981
34-0.075373-0.78330.217582
350.1456541.51370.066514
36-0.015414-0.16020.436516
370.0280930.2920.385442
380.0077110.08010.468139
39-0.013557-0.14090.44411
40-0.063337-0.65820.255898
41-0.088791-0.92270.179098
42-0.000628-0.00650.497403
430.0509990.530.2986
44-0.098398-1.02260.154394
45-0.026364-0.2740.392311
460.0063310.06580.47383
47-0.039678-0.41240.34045
48-0.010509-0.10920.456618

\begin{tabular}{lllllllll}
\hline
Partial Autocorrelation Function \tabularnewline
Time lag k & PACF(k) & T-STAT & P-value \tabularnewline
1 & -0.515533 & -5.3576 & 0 \tabularnewline
2 & 0.246578 & 2.5625 & 0.005885 \tabularnewline
3 & 0.004973 & 0.0517 & 0.479438 \tabularnewline
4 & -0.048686 & -0.506 & 0.30696 \tabularnewline
5 & -0.036614 & -0.3805 & 0.352161 \tabularnewline
6 & -0.126308 & -1.3126 & 0.096044 \tabularnewline
7 & -0.271759 & -2.8242 & 0.002823 \tabularnewline
8 & 0.212147 & 2.2047 & 0.014798 \tabularnewline
9 & -0.104086 & -1.0817 & 0.140899 \tabularnewline
10 & 0.231235 & 2.4031 & 0.008982 \tabularnewline
11 & -0.150547 & -1.5645 & 0.06031 \tabularnewline
12 & 0.498611 & 5.1817 & 1e-06 \tabularnewline
13 & 0.09936 & 1.0326 & 0.152054 \tabularnewline
14 & 0.038189 & 0.3969 & 0.346123 \tabularnewline
15 & 0.069179 & 0.7189 & 0.23687 \tabularnewline
16 & -0.089589 & -0.931 & 0.176955 \tabularnewline
17 & 0.021979 & 0.2284 & 0.40988 \tabularnewline
18 & 0.112554 & 1.1697 & 0.122349 \tabularnewline
19 & -0.041988 & -0.4364 & 0.331724 \tabularnewline
20 & 0.112474 & 1.1689 & 0.122516 \tabularnewline
21 & 0.072587 & 0.7543 & 0.226142 \tabularnewline
22 & -0.157627 & -1.6381 & 0.052155 \tabularnewline
23 & 0.013327 & 0.1385 & 0.445052 \tabularnewline
24 & -0.00312 & -0.0324 & 0.487097 \tabularnewline
25 & 0.017938 & 0.1864 & 0.426234 \tabularnewline
26 & 0.010587 & 0.11 & 0.456299 \tabularnewline
27 & -0.096981 & -1.0079 & 0.157888 \tabularnewline
28 & -0.008575 & -0.0891 & 0.464577 \tabularnewline
29 & -0.014962 & -0.1555 & 0.438363 \tabularnewline
30 & -0.00967 & -0.1005 & 0.46007 \tabularnewline
31 & 0.018767 & 0.195 & 0.422868 \tabularnewline
32 & 0.003849 & 0.04 & 0.484082 \tabularnewline
33 & -0.196136 & -2.0383 & 0.021981 \tabularnewline
34 & -0.075373 & -0.7833 & 0.217582 \tabularnewline
35 & 0.145654 & 1.5137 & 0.066514 \tabularnewline
36 & -0.015414 & -0.1602 & 0.436516 \tabularnewline
37 & 0.028093 & 0.292 & 0.385442 \tabularnewline
38 & 0.007711 & 0.0801 & 0.468139 \tabularnewline
39 & -0.013557 & -0.1409 & 0.44411 \tabularnewline
40 & -0.063337 & -0.6582 & 0.255898 \tabularnewline
41 & -0.088791 & -0.9227 & 0.179098 \tabularnewline
42 & -0.000628 & -0.0065 & 0.497403 \tabularnewline
43 & 0.050999 & 0.53 & 0.2986 \tabularnewline
44 & -0.098398 & -1.0226 & 0.154394 \tabularnewline
45 & -0.026364 & -0.274 & 0.392311 \tabularnewline
46 & 0.006331 & 0.0658 & 0.47383 \tabularnewline
47 & -0.039678 & -0.4124 & 0.34045 \tabularnewline
48 & -0.010509 & -0.1092 & 0.456618 \tabularnewline
\hline
\end{tabular}
%Source: https://freestatistics.org/blog/index.php?pk=123797&T=2

[TABLE]
[ROW][C]Partial Autocorrelation Function[/C][/ROW]
[ROW][C]Time lag k[/C][C]PACF(k)[/C][C]T-STAT[/C][C]P-value[/C][/ROW]
[ROW][C]1[/C][C]-0.515533[/C][C]-5.3576[/C][C]0[/C][/ROW]
[ROW][C]2[/C][C]0.246578[/C][C]2.5625[/C][C]0.005885[/C][/ROW]
[ROW][C]3[/C][C]0.004973[/C][C]0.0517[/C][C]0.479438[/C][/ROW]
[ROW][C]4[/C][C]-0.048686[/C][C]-0.506[/C][C]0.30696[/C][/ROW]
[ROW][C]5[/C][C]-0.036614[/C][C]-0.3805[/C][C]0.352161[/C][/ROW]
[ROW][C]6[/C][C]-0.126308[/C][C]-1.3126[/C][C]0.096044[/C][/ROW]
[ROW][C]7[/C][C]-0.271759[/C][C]-2.8242[/C][C]0.002823[/C][/ROW]
[ROW][C]8[/C][C]0.212147[/C][C]2.2047[/C][C]0.014798[/C][/ROW]
[ROW][C]9[/C][C]-0.104086[/C][C]-1.0817[/C][C]0.140899[/C][/ROW]
[ROW][C]10[/C][C]0.231235[/C][C]2.4031[/C][C]0.008982[/C][/ROW]
[ROW][C]11[/C][C]-0.150547[/C][C]-1.5645[/C][C]0.06031[/C][/ROW]
[ROW][C]12[/C][C]0.498611[/C][C]5.1817[/C][C]1e-06[/C][/ROW]
[ROW][C]13[/C][C]0.09936[/C][C]1.0326[/C][C]0.152054[/C][/ROW]
[ROW][C]14[/C][C]0.038189[/C][C]0.3969[/C][C]0.346123[/C][/ROW]
[ROW][C]15[/C][C]0.069179[/C][C]0.7189[/C][C]0.23687[/C][/ROW]
[ROW][C]16[/C][C]-0.089589[/C][C]-0.931[/C][C]0.176955[/C][/ROW]
[ROW][C]17[/C][C]0.021979[/C][C]0.2284[/C][C]0.40988[/C][/ROW]
[ROW][C]18[/C][C]0.112554[/C][C]1.1697[/C][C]0.122349[/C][/ROW]
[ROW][C]19[/C][C]-0.041988[/C][C]-0.4364[/C][C]0.331724[/C][/ROW]
[ROW][C]20[/C][C]0.112474[/C][C]1.1689[/C][C]0.122516[/C][/ROW]
[ROW][C]21[/C][C]0.072587[/C][C]0.7543[/C][C]0.226142[/C][/ROW]
[ROW][C]22[/C][C]-0.157627[/C][C]-1.6381[/C][C]0.052155[/C][/ROW]
[ROW][C]23[/C][C]0.013327[/C][C]0.1385[/C][C]0.445052[/C][/ROW]
[ROW][C]24[/C][C]-0.00312[/C][C]-0.0324[/C][C]0.487097[/C][/ROW]
[ROW][C]25[/C][C]0.017938[/C][C]0.1864[/C][C]0.426234[/C][/ROW]
[ROW][C]26[/C][C]0.010587[/C][C]0.11[/C][C]0.456299[/C][/ROW]
[ROW][C]27[/C][C]-0.096981[/C][C]-1.0079[/C][C]0.157888[/C][/ROW]
[ROW][C]28[/C][C]-0.008575[/C][C]-0.0891[/C][C]0.464577[/C][/ROW]
[ROW][C]29[/C][C]-0.014962[/C][C]-0.1555[/C][C]0.438363[/C][/ROW]
[ROW][C]30[/C][C]-0.00967[/C][C]-0.1005[/C][C]0.46007[/C][/ROW]
[ROW][C]31[/C][C]0.018767[/C][C]0.195[/C][C]0.422868[/C][/ROW]
[ROW][C]32[/C][C]0.003849[/C][C]0.04[/C][C]0.484082[/C][/ROW]
[ROW][C]33[/C][C]-0.196136[/C][C]-2.0383[/C][C]0.021981[/C][/ROW]
[ROW][C]34[/C][C]-0.075373[/C][C]-0.7833[/C][C]0.217582[/C][/ROW]
[ROW][C]35[/C][C]0.145654[/C][C]1.5137[/C][C]0.066514[/C][/ROW]
[ROW][C]36[/C][C]-0.015414[/C][C]-0.1602[/C][C]0.436516[/C][/ROW]
[ROW][C]37[/C][C]0.028093[/C][C]0.292[/C][C]0.385442[/C][/ROW]
[ROW][C]38[/C][C]0.007711[/C][C]0.0801[/C][C]0.468139[/C][/ROW]
[ROW][C]39[/C][C]-0.013557[/C][C]-0.1409[/C][C]0.44411[/C][/ROW]
[ROW][C]40[/C][C]-0.063337[/C][C]-0.6582[/C][C]0.255898[/C][/ROW]
[ROW][C]41[/C][C]-0.088791[/C][C]-0.9227[/C][C]0.179098[/C][/ROW]
[ROW][C]42[/C][C]-0.000628[/C][C]-0.0065[/C][C]0.497403[/C][/ROW]
[ROW][C]43[/C][C]0.050999[/C][C]0.53[/C][C]0.2986[/C][/ROW]
[ROW][C]44[/C][C]-0.098398[/C][C]-1.0226[/C][C]0.154394[/C][/ROW]
[ROW][C]45[/C][C]-0.026364[/C][C]-0.274[/C][C]0.392311[/C][/ROW]
[ROW][C]46[/C][C]0.006331[/C][C]0.0658[/C][C]0.47383[/C][/ROW]
[ROW][C]47[/C][C]-0.039678[/C][C]-0.4124[/C][C]0.34045[/C][/ROW]
[ROW][C]48[/C][C]-0.010509[/C][C]-0.1092[/C][C]0.456618[/C][/ROW]
[/TABLE]
Source: https://freestatistics.org/blog/index.php?pk=123797&T=2

Globally Unique Identifier (entire table): ba.freestatistics.org/blog/index.php?pk=123797&T=2

As an alternative you can also use a QR Code:  

The GUIDs for individual cells are displayed in the table below:

Partial Autocorrelation Function
Time lag kPACF(k)T-STATP-value
1-0.515533-5.35760
20.2465782.56250.005885
30.0049730.05170.479438
4-0.048686-0.5060.30696
5-0.036614-0.38050.352161
6-0.126308-1.31260.096044
7-0.271759-2.82420.002823
80.2121472.20470.014798
9-0.104086-1.08170.140899
100.2312352.40310.008982
11-0.150547-1.56450.06031
120.4986115.18171e-06
130.099361.03260.152054
140.0381890.39690.346123
150.0691790.71890.23687
16-0.089589-0.9310.176955
170.0219790.22840.40988
180.1125541.16970.122349
19-0.041988-0.43640.331724
200.1124741.16890.122516
210.0725870.75430.226142
22-0.157627-1.63810.052155
230.0133270.13850.445052
24-0.00312-0.03240.487097
250.0179380.18640.426234
260.0105870.110.456299
27-0.096981-1.00790.157888
28-0.008575-0.08910.464577
29-0.014962-0.15550.438363
30-0.00967-0.10050.46007
310.0187670.1950.422868
320.0038490.040.484082
33-0.196136-2.03830.021981
34-0.075373-0.78330.217582
350.1456541.51370.066514
36-0.015414-0.16020.436516
370.0280930.2920.385442
380.0077110.08010.468139
39-0.013557-0.14090.44411
40-0.063337-0.65820.255898
41-0.088791-0.92270.179098
42-0.000628-0.00650.497403
430.0509990.530.2986
44-0.098398-1.02260.154394
45-0.026364-0.2740.392311
460.0063310.06580.47383
47-0.039678-0.41240.34045
48-0.010509-0.10920.456618


Parameters (Session):
par1 = 48 ; par2 = 1 ; par3 = 0 ; par4 = 0 ; par5 = 12 ; par6 = White Noise ; par7 = 0.95 ;
Parameters (R input):
par1 = 48 ; par2 = 1 ; par3 = 0 ; par4 = 0 ; par5 = 12 ; par6 = White Noise ; par7 = 0.95 ; par8 = ;
R code (references can be found in the software module):
if (par1 == 'Default') {
par1 = 10*log10(length(x))
} else {
par1 <- as.numeric(par1)
}
par2 <- as.numeric(par2)
par3 <- as.numeric(par3)
par4 <- as.numeric(par4)
par5 <- as.numeric(par5)
if (par6 == 'White Noise') par6 <- 'white' else par6 <- 'ma'
par7 <- as.numeric(par7)
if (par8 != '') par8 <- as.numeric(par8)
ox <- x
if (par8 == '') {
if (par2 == 0) {
x <- log(x)
} else {
x <- (x ^ par2 - 1) / par2
}
} else {
x <- log(x,base=par8)
}
if (par3 > 0) x <- diff(x,lag=1,difference=par3)
if (par4 > 0) x <- diff(x,lag=par5,difference=par4)
bitmap(file='picts.png')
op <- par(mfrow=c(2,1))
plot(ox,type='l',main='Original Time Series',xlab='time',ylab='value')
if (par8=='') {
mytitle <- paste('Working Time Series (lambda=',par2,', d=',par3,', D=',par4,')',sep='')
mysub <- paste('(lambda=',par2,', d=',par3,', D=',par4,', CI=', par7, ', CI type=',par6,')',sep='')
} else {
mytitle <- paste('Working Time Series (base=',par8,', d=',par3,', D=',par4,')',sep='')
mysub <- paste('(base=',par8,', d=',par3,', D=',par4,', CI=', par7, ', CI type=',par6,')',sep='')
}
plot(x,type='l', main=mytitle,xlab='time',ylab='value')
par(op)
dev.off()
bitmap(file='pic1.png')
racf <- acf(x, par1, main='Autocorrelation', xlab='time lag', ylab='ACF', ci.type=par6, ci=par7, sub=mysub)
dev.off()
bitmap(file='pic2.png')
rpacf <- pacf(x,par1,main='Partial Autocorrelation',xlab='lags',ylab='PACF',sub=mysub)
dev.off()
(myacf <- c(racf$acf))
(mypacf <- c(rpacf$acf))
lengthx <- length(x)
sqrtn <- sqrt(lengthx)
load(file='createtable')
a<-table.start()
a<-table.row.start(a)
a<-table.element(a,'Autocorrelation Function',4,TRUE)
a<-table.row.end(a)
a<-table.row.start(a)
a<-table.element(a,'Time lag k',header=TRUE)
a<-table.element(a,hyperlink('basics.htm','ACF(k)','click here for more information about the Autocorrelation Function'),header=TRUE)
a<-table.element(a,'T-STAT',header=TRUE)
a<-table.element(a,'P-value',header=TRUE)
a<-table.row.end(a)
for (i in 2:(par1+1)) {
a<-table.row.start(a)
a<-table.element(a,i-1,header=TRUE)
a<-table.element(a,round(myacf[i],6))
mytstat <- myacf[i]*sqrtn
a<-table.element(a,round(mytstat,4))
a<-table.element(a,round(1-pt(abs(mytstat),lengthx),6))
a<-table.row.end(a)
}
a<-table.end(a)
table.save(a,file='mytable.tab')
a<-table.start()
a<-table.row.start(a)
a<-table.element(a,'Partial Autocorrelation Function',4,TRUE)
a<-table.row.end(a)
a<-table.row.start(a)
a<-table.element(a,'Time lag k',header=TRUE)
a<-table.element(a,hyperlink('basics.htm','PACF(k)','click here for more information about the Partial Autocorrelation Function'),header=TRUE)
a<-table.element(a,'T-STAT',header=TRUE)
a<-table.element(a,'P-value',header=TRUE)
a<-table.row.end(a)
for (i in 1:par1) {
a<-table.row.start(a)
a<-table.element(a,i,header=TRUE)
a<-table.element(a,round(mypacf[i],6))
mytstat <- mypacf[i]*sqrtn
a<-table.element(a,round(mytstat,4))
a<-table.element(a,round(1-pt(abs(mytstat),lengthx),6))
a<-table.row.end(a)
}
a<-table.end(a)
table.save(a,file='mytable1.tab')