Free Statistics

of Irreproducible Research!

Author's title

Author*Unverified author*
R Software Modulerwasp_autocorrelation.wasp
Title produced by software(Partial) Autocorrelation Function
Date of computationFri, 12 Aug 2011 09:59:46 -0400
Cite this page as followsStatistical Computations at FreeStatistics.org, Office for Research Development and Education, URL https://freestatistics.org/blog/index.php?v=date/2011/Aug/12/t13131577056y8bc1a17igqpin.htm/, Retrieved Wed, 15 May 2024 02:33:22 +0000
Statistical Computations at FreeStatistics.org, Office for Research Development and Education, URL https://freestatistics.org/blog/index.php?pk=123629, Retrieved Wed, 15 May 2024 02:33:22 +0000
QR Codes:

Original text written by user:
IsPrivate?No (this computation is public)
User-defined keywordsMorel Sarah
Estimated Impact135
Family? (F = Feedback message, R = changed R code, M = changed R Module, P = changed Parameters, D = changed Data)
-       [(Partial) Autocorrelation Function] [autocorrelatie om...] [2011-08-12 13:59:46] [d41d8cd98f00b204e9800998ecf8427e] [Current]
- R P     [(Partial) Autocorrelation Function] [acf trend] [2011-08-16 14:16:57] [74be16979710d4c4e7c6647856088456]
Feedback Forum

Post a new message
Dataseries X:
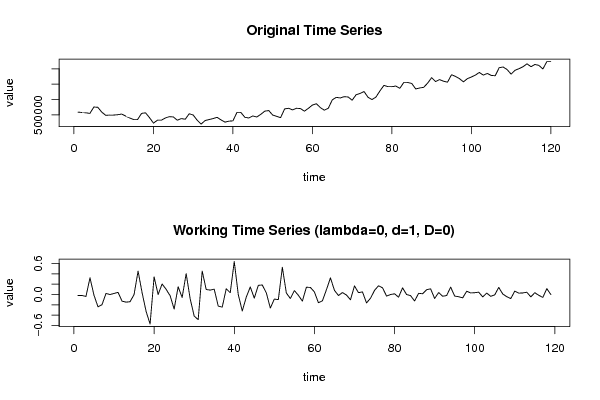
588264
577918
567562
546859
756344
745987
588264
483527
493873
493873
504229
526055
462824
399492
347630
347630
546859
567562
409838
231412
325803
325803
399492
442021
431664
325803
378790
357986
536412
493873
325803
200263
315447
347630
378790
420195
336150
263595
294755
305101
577918
577918
420195
399492
462824
431664
515709
620447
641250
493873
452367
409838
694135
714939
661953
714939
704481
620447
714939
819676
862205
735641
651596
714939
987746
1071790
1051088
1092483
1082137
977399
1155825
1198354
1260562
1071790
998102
1082137
1282389
1460814
1418286
1418286
1439089
1366423
1555307
1555307
1523124
1344597
1376780
1397583
1534503
1712929
1586355
1649698
1596712
1565653
1807421
1754435
1680746
1576009
1680746
1733732
1796963
1880998
1796963
1848826
1785585
1775239
2037699
2059525
1975491
1828123
1953664
2006549
2069882
2164273
2069882
2143570
2111388
1996193
2237951
2237951


Summary of computational transaction
Raw Inputview raw input (R code)
Raw Outputview raw output of R engine
Computing time1 seconds
R Server'Gertrude Mary Cox' @ cox.wessa.net

\begin{tabular}{lllllllll}
\hline
Summary of computational transaction \tabularnewline
Raw Input & view raw input (R code)  \tabularnewline
Raw Output & view raw output of R engine  \tabularnewline
Computing time & 1 seconds \tabularnewline
R Server & 'Gertrude Mary Cox' @ cox.wessa.net \tabularnewline
\hline
\end{tabular}
%Source: https://freestatistics.org/blog/index.php?pk=123629&T=0

[TABLE]
[ROW][C]Summary of computational transaction[/C][/ROW]
[ROW][C]Raw Input[/C][C]view raw input (R code) [/C][/ROW]
[ROW][C]Raw Output[/C][C]view raw output of R engine [/C][/ROW]
[ROW][C]Computing time[/C][C]1 seconds[/C][/ROW]
[ROW][C]R Server[/C][C]'Gertrude Mary Cox' @ cox.wessa.net[/C][/ROW]
[/TABLE]
Source: https://freestatistics.org/blog/index.php?pk=123629&T=0

Globally Unique Identifier (entire table): ba.freestatistics.org/blog/index.php?pk=123629&T=0

As an alternative you can also use a QR Code:  

The GUIDs for individual cells are displayed in the table below:

Summary of computational transaction
Raw Inputview raw input (R code)
Raw Outputview raw output of R engine
Computing time1 seconds
R Server'Gertrude Mary Cox' @ cox.wessa.net


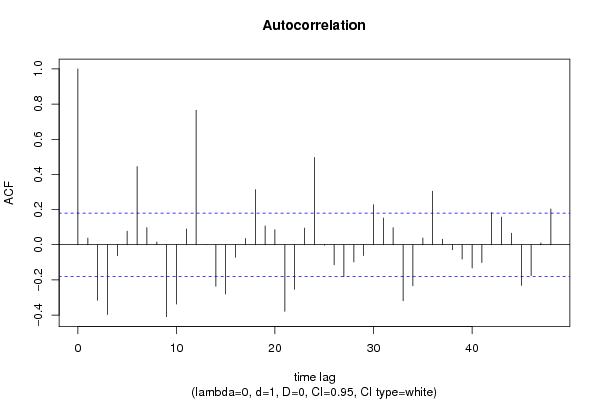
Autocorrelation Function
Time lag kACF(k)T-STATP-value
10.0376590.41080.340974
2-0.315906-3.44610.000393
3-0.396402-4.32421.6e-05
4-0.06267-0.68370.247762
50.0767710.83750.202004
60.4444424.84832e-06
70.0972341.06070.145488
80.0157290.17160.43203
9-0.409059-4.46239e-06
10-0.337467-3.68130.000175
110.0894480.97580.16558
120.7655088.35070
13-0.000266-0.00290.498846
14-0.235754-2.57180.005674
15-0.279842-3.05270.001399
16-0.070869-0.77310.2205
170.0351910.38390.350874
180.3134343.41920.00043
190.1071761.16920.12234
200.0857230.93510.175809
21-0.378781-4.1323.4e-05
22-0.253085-2.76080.00334
230.094681.03280.151888
240.4960795.41160
25-0.00215-0.02350.490665
26-0.114294-1.24680.10746
27-0.181468-1.97960.02503
28-0.097431-1.06280.145002
29-0.061312-0.66880.252448
300.2271292.47770.007314
310.1516911.65480.050305
320.0971291.05960.145746
33-0.318578-3.47530.000356
34-0.233458-2.54670.006075
350.0377480.41180.340622
360.3039273.31540.000607
370.0312730.34110.366796
38-0.028627-0.31230.377687
39-0.081499-0.8890.187886
40-0.132222-1.44240.075912
41-0.100687-1.09840.137132
420.1818181.98340.024813
430.1573641.71660.044324
440.0653810.71320.238554
45-0.231158-2.52160.006502
46-0.175458-1.9140.029009
470.0102620.11190.455527
480.2036342.22140.014108

\begin{tabular}{lllllllll}
\hline
Autocorrelation Function \tabularnewline
Time lag k & ACF(k) & T-STAT & P-value \tabularnewline
1 & 0.037659 & 0.4108 & 0.340974 \tabularnewline
2 & -0.315906 & -3.4461 & 0.000393 \tabularnewline
3 & -0.396402 & -4.3242 & 1.6e-05 \tabularnewline
4 & -0.06267 & -0.6837 & 0.247762 \tabularnewline
5 & 0.076771 & 0.8375 & 0.202004 \tabularnewline
6 & 0.444442 & 4.8483 & 2e-06 \tabularnewline
7 & 0.097234 & 1.0607 & 0.145488 \tabularnewline
8 & 0.015729 & 0.1716 & 0.43203 \tabularnewline
9 & -0.409059 & -4.4623 & 9e-06 \tabularnewline
10 & -0.337467 & -3.6813 & 0.000175 \tabularnewline
11 & 0.089448 & 0.9758 & 0.16558 \tabularnewline
12 & 0.765508 & 8.3507 & 0 \tabularnewline
13 & -0.000266 & -0.0029 & 0.498846 \tabularnewline
14 & -0.235754 & -2.5718 & 0.005674 \tabularnewline
15 & -0.279842 & -3.0527 & 0.001399 \tabularnewline
16 & -0.070869 & -0.7731 & 0.2205 \tabularnewline
17 & 0.035191 & 0.3839 & 0.350874 \tabularnewline
18 & 0.313434 & 3.4192 & 0.00043 \tabularnewline
19 & 0.107176 & 1.1692 & 0.12234 \tabularnewline
20 & 0.085723 & 0.9351 & 0.175809 \tabularnewline
21 & -0.378781 & -4.132 & 3.4e-05 \tabularnewline
22 & -0.253085 & -2.7608 & 0.00334 \tabularnewline
23 & 0.09468 & 1.0328 & 0.151888 \tabularnewline
24 & 0.496079 & 5.4116 & 0 \tabularnewline
25 & -0.00215 & -0.0235 & 0.490665 \tabularnewline
26 & -0.114294 & -1.2468 & 0.10746 \tabularnewline
27 & -0.181468 & -1.9796 & 0.02503 \tabularnewline
28 & -0.097431 & -1.0628 & 0.145002 \tabularnewline
29 & -0.061312 & -0.6688 & 0.252448 \tabularnewline
30 & 0.227129 & 2.4777 & 0.007314 \tabularnewline
31 & 0.151691 & 1.6548 & 0.050305 \tabularnewline
32 & 0.097129 & 1.0596 & 0.145746 \tabularnewline
33 & -0.318578 & -3.4753 & 0.000356 \tabularnewline
34 & -0.233458 & -2.5467 & 0.006075 \tabularnewline
35 & 0.037748 & 0.4118 & 0.340622 \tabularnewline
36 & 0.303927 & 3.3154 & 0.000607 \tabularnewline
37 & 0.031273 & 0.3411 & 0.366796 \tabularnewline
38 & -0.028627 & -0.3123 & 0.377687 \tabularnewline
39 & -0.081499 & -0.889 & 0.187886 \tabularnewline
40 & -0.132222 & -1.4424 & 0.075912 \tabularnewline
41 & -0.100687 & -1.0984 & 0.137132 \tabularnewline
42 & 0.181818 & 1.9834 & 0.024813 \tabularnewline
43 & 0.157364 & 1.7166 & 0.044324 \tabularnewline
44 & 0.065381 & 0.7132 & 0.238554 \tabularnewline
45 & -0.231158 & -2.5216 & 0.006502 \tabularnewline
46 & -0.175458 & -1.914 & 0.029009 \tabularnewline
47 & 0.010262 & 0.1119 & 0.455527 \tabularnewline
48 & 0.203634 & 2.2214 & 0.014108 \tabularnewline
\hline
\end{tabular}
%Source: https://freestatistics.org/blog/index.php?pk=123629&T=1

[TABLE]
[ROW][C]Autocorrelation Function[/C][/ROW]
[ROW][C]Time lag k[/C][C]ACF(k)[/C][C]T-STAT[/C][C]P-value[/C][/ROW]
[ROW][C]1[/C][C]0.037659[/C][C]0.4108[/C][C]0.340974[/C][/ROW]
[ROW][C]2[/C][C]-0.315906[/C][C]-3.4461[/C][C]0.000393[/C][/ROW]
[ROW][C]3[/C][C]-0.396402[/C][C]-4.3242[/C][C]1.6e-05[/C][/ROW]
[ROW][C]4[/C][C]-0.06267[/C][C]-0.6837[/C][C]0.247762[/C][/ROW]
[ROW][C]5[/C][C]0.076771[/C][C]0.8375[/C][C]0.202004[/C][/ROW]
[ROW][C]6[/C][C]0.444442[/C][C]4.8483[/C][C]2e-06[/C][/ROW]
[ROW][C]7[/C][C]0.097234[/C][C]1.0607[/C][C]0.145488[/C][/ROW]
[ROW][C]8[/C][C]0.015729[/C][C]0.1716[/C][C]0.43203[/C][/ROW]
[ROW][C]9[/C][C]-0.409059[/C][C]-4.4623[/C][C]9e-06[/C][/ROW]
[ROW][C]10[/C][C]-0.337467[/C][C]-3.6813[/C][C]0.000175[/C][/ROW]
[ROW][C]11[/C][C]0.089448[/C][C]0.9758[/C][C]0.16558[/C][/ROW]
[ROW][C]12[/C][C]0.765508[/C][C]8.3507[/C][C]0[/C][/ROW]
[ROW][C]13[/C][C]-0.000266[/C][C]-0.0029[/C][C]0.498846[/C][/ROW]
[ROW][C]14[/C][C]-0.235754[/C][C]-2.5718[/C][C]0.005674[/C][/ROW]
[ROW][C]15[/C][C]-0.279842[/C][C]-3.0527[/C][C]0.001399[/C][/ROW]
[ROW][C]16[/C][C]-0.070869[/C][C]-0.7731[/C][C]0.2205[/C][/ROW]
[ROW][C]17[/C][C]0.035191[/C][C]0.3839[/C][C]0.350874[/C][/ROW]
[ROW][C]18[/C][C]0.313434[/C][C]3.4192[/C][C]0.00043[/C][/ROW]
[ROW][C]19[/C][C]0.107176[/C][C]1.1692[/C][C]0.12234[/C][/ROW]
[ROW][C]20[/C][C]0.085723[/C][C]0.9351[/C][C]0.175809[/C][/ROW]
[ROW][C]21[/C][C]-0.378781[/C][C]-4.132[/C][C]3.4e-05[/C][/ROW]
[ROW][C]22[/C][C]-0.253085[/C][C]-2.7608[/C][C]0.00334[/C][/ROW]
[ROW][C]23[/C][C]0.09468[/C][C]1.0328[/C][C]0.151888[/C][/ROW]
[ROW][C]24[/C][C]0.496079[/C][C]5.4116[/C][C]0[/C][/ROW]
[ROW][C]25[/C][C]-0.00215[/C][C]-0.0235[/C][C]0.490665[/C][/ROW]
[ROW][C]26[/C][C]-0.114294[/C][C]-1.2468[/C][C]0.10746[/C][/ROW]
[ROW][C]27[/C][C]-0.181468[/C][C]-1.9796[/C][C]0.02503[/C][/ROW]
[ROW][C]28[/C][C]-0.097431[/C][C]-1.0628[/C][C]0.145002[/C][/ROW]
[ROW][C]29[/C][C]-0.061312[/C][C]-0.6688[/C][C]0.252448[/C][/ROW]
[ROW][C]30[/C][C]0.227129[/C][C]2.4777[/C][C]0.007314[/C][/ROW]
[ROW][C]31[/C][C]0.151691[/C][C]1.6548[/C][C]0.050305[/C][/ROW]
[ROW][C]32[/C][C]0.097129[/C][C]1.0596[/C][C]0.145746[/C][/ROW]
[ROW][C]33[/C][C]-0.318578[/C][C]-3.4753[/C][C]0.000356[/C][/ROW]
[ROW][C]34[/C][C]-0.233458[/C][C]-2.5467[/C][C]0.006075[/C][/ROW]
[ROW][C]35[/C][C]0.037748[/C][C]0.4118[/C][C]0.340622[/C][/ROW]
[ROW][C]36[/C][C]0.303927[/C][C]3.3154[/C][C]0.000607[/C][/ROW]
[ROW][C]37[/C][C]0.031273[/C][C]0.3411[/C][C]0.366796[/C][/ROW]
[ROW][C]38[/C][C]-0.028627[/C][C]-0.3123[/C][C]0.377687[/C][/ROW]
[ROW][C]39[/C][C]-0.081499[/C][C]-0.889[/C][C]0.187886[/C][/ROW]
[ROW][C]40[/C][C]-0.132222[/C][C]-1.4424[/C][C]0.075912[/C][/ROW]
[ROW][C]41[/C][C]-0.100687[/C][C]-1.0984[/C][C]0.137132[/C][/ROW]
[ROW][C]42[/C][C]0.181818[/C][C]1.9834[/C][C]0.024813[/C][/ROW]
[ROW][C]43[/C][C]0.157364[/C][C]1.7166[/C][C]0.044324[/C][/ROW]
[ROW][C]44[/C][C]0.065381[/C][C]0.7132[/C][C]0.238554[/C][/ROW]
[ROW][C]45[/C][C]-0.231158[/C][C]-2.5216[/C][C]0.006502[/C][/ROW]
[ROW][C]46[/C][C]-0.175458[/C][C]-1.914[/C][C]0.029009[/C][/ROW]
[ROW][C]47[/C][C]0.010262[/C][C]0.1119[/C][C]0.455527[/C][/ROW]
[ROW][C]48[/C][C]0.203634[/C][C]2.2214[/C][C]0.014108[/C][/ROW]
[/TABLE]
Source: https://freestatistics.org/blog/index.php?pk=123629&T=1

Globally Unique Identifier (entire table): ba.freestatistics.org/blog/index.php?pk=123629&T=1

As an alternative you can also use a QR Code:  

The GUIDs for individual cells are displayed in the table below:

Autocorrelation Function
Time lag kACF(k)T-STATP-value
10.0376590.41080.340974
2-0.315906-3.44610.000393
3-0.396402-4.32421.6e-05
4-0.06267-0.68370.247762
50.0767710.83750.202004
60.4444424.84832e-06
70.0972341.06070.145488
80.0157290.17160.43203
9-0.409059-4.46239e-06
10-0.337467-3.68130.000175
110.0894480.97580.16558
120.7655088.35070
13-0.000266-0.00290.498846
14-0.235754-2.57180.005674
15-0.279842-3.05270.001399
16-0.070869-0.77310.2205
170.0351910.38390.350874
180.3134343.41920.00043
190.1071761.16920.12234
200.0857230.93510.175809
21-0.378781-4.1323.4e-05
22-0.253085-2.76080.00334
230.094681.03280.151888
240.4960795.41160
25-0.00215-0.02350.490665
26-0.114294-1.24680.10746
27-0.181468-1.97960.02503
28-0.097431-1.06280.145002
29-0.061312-0.66880.252448
300.2271292.47770.007314
310.1516911.65480.050305
320.0971291.05960.145746
33-0.318578-3.47530.000356
34-0.233458-2.54670.006075
350.0377480.41180.340622
360.3039273.31540.000607
370.0312730.34110.366796
38-0.028627-0.31230.377687
39-0.081499-0.8890.187886
40-0.132222-1.44240.075912
41-0.100687-1.09840.137132
420.1818181.98340.024813
430.1573641.71660.044324
440.0653810.71320.238554
45-0.231158-2.52160.006502
46-0.175458-1.9140.029009
470.0102620.11190.455527
480.2036342.22140.014108


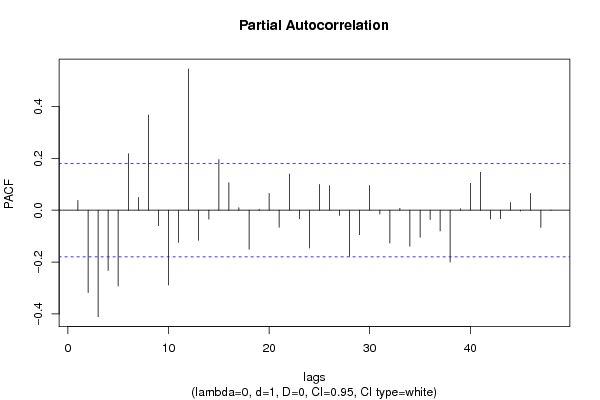
Partial Autocorrelation Function
Time lag kPACF(k)T-STATP-value
10.0376590.41080.340974
2-0.317775-3.46650.000367
3-0.41076-4.48099e-06
4-0.232112-2.5320.006321
5-0.292432-3.19010.000909
60.2183842.38230.009395
70.049550.54050.294923
80.3677784.0125.3e-05
9-0.059519-0.64930.258705
10-0.288715-3.14950.001034
11-0.124671-1.360.0882
120.5453815.94940
13-0.115778-1.2630.10453
14-0.034461-0.37590.353821
150.1954432.1320.01753
160.1062191.15870.124446
170.0096120.10490.458333
18-0.15045-1.64120.051696
190.0037190.04060.483855
200.0643270.70170.242111
21-0.065776-0.71750.237225
220.1402131.52950.064392
23-0.033211-0.36230.358887
24-0.14568-1.58920.057337
250.0995591.08610.139825
260.0944941.03080.152361
27-0.020465-0.22320.411864
28-0.178134-1.94320.027176
29-0.094673-1.03280.151906
300.0952471.0390.15045
31-0.014334-0.15640.438007
32-0.12639-1.37880.085279
330.0071510.0780.468976
34-0.138652-1.51250.066527
35-0.104613-1.14120.12804
36-0.035994-0.39260.347641
37-0.079794-0.87050.192902
38-0.200163-2.18350.01548
390.0056210.06130.475605
400.1036451.13060.130241
410.1466411.59970.056162
42-0.033854-0.36930.356281
43-0.032565-0.35520.361517
440.0300520.32780.371808
45-0.003074-0.03350.486654
460.0644370.70290.241737
47-0.066078-0.72080.236214
48-0.000687-0.00750.497014

\begin{tabular}{lllllllll}
\hline
Partial Autocorrelation Function \tabularnewline
Time lag k & PACF(k) & T-STAT & P-value \tabularnewline
1 & 0.037659 & 0.4108 & 0.340974 \tabularnewline
2 & -0.317775 & -3.4665 & 0.000367 \tabularnewline
3 & -0.41076 & -4.4809 & 9e-06 \tabularnewline
4 & -0.232112 & -2.532 & 0.006321 \tabularnewline
5 & -0.292432 & -3.1901 & 0.000909 \tabularnewline
6 & 0.218384 & 2.3823 & 0.009395 \tabularnewline
7 & 0.04955 & 0.5405 & 0.294923 \tabularnewline
8 & 0.367778 & 4.012 & 5.3e-05 \tabularnewline
9 & -0.059519 & -0.6493 & 0.258705 \tabularnewline
10 & -0.288715 & -3.1495 & 0.001034 \tabularnewline
11 & -0.124671 & -1.36 & 0.0882 \tabularnewline
12 & 0.545381 & 5.9494 & 0 \tabularnewline
13 & -0.115778 & -1.263 & 0.10453 \tabularnewline
14 & -0.034461 & -0.3759 & 0.353821 \tabularnewline
15 & 0.195443 & 2.132 & 0.01753 \tabularnewline
16 & 0.106219 & 1.1587 & 0.124446 \tabularnewline
17 & 0.009612 & 0.1049 & 0.458333 \tabularnewline
18 & -0.15045 & -1.6412 & 0.051696 \tabularnewline
19 & 0.003719 & 0.0406 & 0.483855 \tabularnewline
20 & 0.064327 & 0.7017 & 0.242111 \tabularnewline
21 & -0.065776 & -0.7175 & 0.237225 \tabularnewline
22 & 0.140213 & 1.5295 & 0.064392 \tabularnewline
23 & -0.033211 & -0.3623 & 0.358887 \tabularnewline
24 & -0.14568 & -1.5892 & 0.057337 \tabularnewline
25 & 0.099559 & 1.0861 & 0.139825 \tabularnewline
26 & 0.094494 & 1.0308 & 0.152361 \tabularnewline
27 & -0.020465 & -0.2232 & 0.411864 \tabularnewline
28 & -0.178134 & -1.9432 & 0.027176 \tabularnewline
29 & -0.094673 & -1.0328 & 0.151906 \tabularnewline
30 & 0.095247 & 1.039 & 0.15045 \tabularnewline
31 & -0.014334 & -0.1564 & 0.438007 \tabularnewline
32 & -0.12639 & -1.3788 & 0.085279 \tabularnewline
33 & 0.007151 & 0.078 & 0.468976 \tabularnewline
34 & -0.138652 & -1.5125 & 0.066527 \tabularnewline
35 & -0.104613 & -1.1412 & 0.12804 \tabularnewline
36 & -0.035994 & -0.3926 & 0.347641 \tabularnewline
37 & -0.079794 & -0.8705 & 0.192902 \tabularnewline
38 & -0.200163 & -2.1835 & 0.01548 \tabularnewline
39 & 0.005621 & 0.0613 & 0.475605 \tabularnewline
40 & 0.103645 & 1.1306 & 0.130241 \tabularnewline
41 & 0.146641 & 1.5997 & 0.056162 \tabularnewline
42 & -0.033854 & -0.3693 & 0.356281 \tabularnewline
43 & -0.032565 & -0.3552 & 0.361517 \tabularnewline
44 & 0.030052 & 0.3278 & 0.371808 \tabularnewline
45 & -0.003074 & -0.0335 & 0.486654 \tabularnewline
46 & 0.064437 & 0.7029 & 0.241737 \tabularnewline
47 & -0.066078 & -0.7208 & 0.236214 \tabularnewline
48 & -0.000687 & -0.0075 & 0.497014 \tabularnewline
\hline
\end{tabular}
%Source: https://freestatistics.org/blog/index.php?pk=123629&T=2

[TABLE]
[ROW][C]Partial Autocorrelation Function[/C][/ROW]
[ROW][C]Time lag k[/C][C]PACF(k)[/C][C]T-STAT[/C][C]P-value[/C][/ROW]
[ROW][C]1[/C][C]0.037659[/C][C]0.4108[/C][C]0.340974[/C][/ROW]
[ROW][C]2[/C][C]-0.317775[/C][C]-3.4665[/C][C]0.000367[/C][/ROW]
[ROW][C]3[/C][C]-0.41076[/C][C]-4.4809[/C][C]9e-06[/C][/ROW]
[ROW][C]4[/C][C]-0.232112[/C][C]-2.532[/C][C]0.006321[/C][/ROW]
[ROW][C]5[/C][C]-0.292432[/C][C]-3.1901[/C][C]0.000909[/C][/ROW]
[ROW][C]6[/C][C]0.218384[/C][C]2.3823[/C][C]0.009395[/C][/ROW]
[ROW][C]7[/C][C]0.04955[/C][C]0.5405[/C][C]0.294923[/C][/ROW]
[ROW][C]8[/C][C]0.367778[/C][C]4.012[/C][C]5.3e-05[/C][/ROW]
[ROW][C]9[/C][C]-0.059519[/C][C]-0.6493[/C][C]0.258705[/C][/ROW]
[ROW][C]10[/C][C]-0.288715[/C][C]-3.1495[/C][C]0.001034[/C][/ROW]
[ROW][C]11[/C][C]-0.124671[/C][C]-1.36[/C][C]0.0882[/C][/ROW]
[ROW][C]12[/C][C]0.545381[/C][C]5.9494[/C][C]0[/C][/ROW]
[ROW][C]13[/C][C]-0.115778[/C][C]-1.263[/C][C]0.10453[/C][/ROW]
[ROW][C]14[/C][C]-0.034461[/C][C]-0.3759[/C][C]0.353821[/C][/ROW]
[ROW][C]15[/C][C]0.195443[/C][C]2.132[/C][C]0.01753[/C][/ROW]
[ROW][C]16[/C][C]0.106219[/C][C]1.1587[/C][C]0.124446[/C][/ROW]
[ROW][C]17[/C][C]0.009612[/C][C]0.1049[/C][C]0.458333[/C][/ROW]
[ROW][C]18[/C][C]-0.15045[/C][C]-1.6412[/C][C]0.051696[/C][/ROW]
[ROW][C]19[/C][C]0.003719[/C][C]0.0406[/C][C]0.483855[/C][/ROW]
[ROW][C]20[/C][C]0.064327[/C][C]0.7017[/C][C]0.242111[/C][/ROW]
[ROW][C]21[/C][C]-0.065776[/C][C]-0.7175[/C][C]0.237225[/C][/ROW]
[ROW][C]22[/C][C]0.140213[/C][C]1.5295[/C][C]0.064392[/C][/ROW]
[ROW][C]23[/C][C]-0.033211[/C][C]-0.3623[/C][C]0.358887[/C][/ROW]
[ROW][C]24[/C][C]-0.14568[/C][C]-1.5892[/C][C]0.057337[/C][/ROW]
[ROW][C]25[/C][C]0.099559[/C][C]1.0861[/C][C]0.139825[/C][/ROW]
[ROW][C]26[/C][C]0.094494[/C][C]1.0308[/C][C]0.152361[/C][/ROW]
[ROW][C]27[/C][C]-0.020465[/C][C]-0.2232[/C][C]0.411864[/C][/ROW]
[ROW][C]28[/C][C]-0.178134[/C][C]-1.9432[/C][C]0.027176[/C][/ROW]
[ROW][C]29[/C][C]-0.094673[/C][C]-1.0328[/C][C]0.151906[/C][/ROW]
[ROW][C]30[/C][C]0.095247[/C][C]1.039[/C][C]0.15045[/C][/ROW]
[ROW][C]31[/C][C]-0.014334[/C][C]-0.1564[/C][C]0.438007[/C][/ROW]
[ROW][C]32[/C][C]-0.12639[/C][C]-1.3788[/C][C]0.085279[/C][/ROW]
[ROW][C]33[/C][C]0.007151[/C][C]0.078[/C][C]0.468976[/C][/ROW]
[ROW][C]34[/C][C]-0.138652[/C][C]-1.5125[/C][C]0.066527[/C][/ROW]
[ROW][C]35[/C][C]-0.104613[/C][C]-1.1412[/C][C]0.12804[/C][/ROW]
[ROW][C]36[/C][C]-0.035994[/C][C]-0.3926[/C][C]0.347641[/C][/ROW]
[ROW][C]37[/C][C]-0.079794[/C][C]-0.8705[/C][C]0.192902[/C][/ROW]
[ROW][C]38[/C][C]-0.200163[/C][C]-2.1835[/C][C]0.01548[/C][/ROW]
[ROW][C]39[/C][C]0.005621[/C][C]0.0613[/C][C]0.475605[/C][/ROW]
[ROW][C]40[/C][C]0.103645[/C][C]1.1306[/C][C]0.130241[/C][/ROW]
[ROW][C]41[/C][C]0.146641[/C][C]1.5997[/C][C]0.056162[/C][/ROW]
[ROW][C]42[/C][C]-0.033854[/C][C]-0.3693[/C][C]0.356281[/C][/ROW]
[ROW][C]43[/C][C]-0.032565[/C][C]-0.3552[/C][C]0.361517[/C][/ROW]
[ROW][C]44[/C][C]0.030052[/C][C]0.3278[/C][C]0.371808[/C][/ROW]
[ROW][C]45[/C][C]-0.003074[/C][C]-0.0335[/C][C]0.486654[/C][/ROW]
[ROW][C]46[/C][C]0.064437[/C][C]0.7029[/C][C]0.241737[/C][/ROW]
[ROW][C]47[/C][C]-0.066078[/C][C]-0.7208[/C][C]0.236214[/C][/ROW]
[ROW][C]48[/C][C]-0.000687[/C][C]-0.0075[/C][C]0.497014[/C][/ROW]
[/TABLE]
Source: https://freestatistics.org/blog/index.php?pk=123629&T=2

Globally Unique Identifier (entire table): ba.freestatistics.org/blog/index.php?pk=123629&T=2

As an alternative you can also use a QR Code:  

The GUIDs for individual cells are displayed in the table below:

Partial Autocorrelation Function
Time lag kPACF(k)T-STATP-value
10.0376590.41080.340974
2-0.317775-3.46650.000367
3-0.41076-4.48099e-06
4-0.232112-2.5320.006321
5-0.292432-3.19010.000909
60.2183842.38230.009395
70.049550.54050.294923
80.3677784.0125.3e-05
9-0.059519-0.64930.258705
10-0.288715-3.14950.001034
11-0.124671-1.360.0882
120.5453815.94940
13-0.115778-1.2630.10453
14-0.034461-0.37590.353821
150.1954432.1320.01753
160.1062191.15870.124446
170.0096120.10490.458333
18-0.15045-1.64120.051696
190.0037190.04060.483855
200.0643270.70170.242111
21-0.065776-0.71750.237225
220.1402131.52950.064392
23-0.033211-0.36230.358887
24-0.14568-1.58920.057337
250.0995591.08610.139825
260.0944941.03080.152361
27-0.020465-0.22320.411864
28-0.178134-1.94320.027176
29-0.094673-1.03280.151906
300.0952471.0390.15045
31-0.014334-0.15640.438007
32-0.12639-1.37880.085279
330.0071510.0780.468976
34-0.138652-1.51250.066527
35-0.104613-1.14120.12804
36-0.035994-0.39260.347641
37-0.079794-0.87050.192902
38-0.200163-2.18350.01548
390.0056210.06130.475605
400.1036451.13060.130241
410.1466411.59970.056162
42-0.033854-0.36930.356281
43-0.032565-0.35520.361517
440.0300520.32780.371808
45-0.003074-0.03350.486654
460.0644370.70290.241737
47-0.066078-0.72080.236214
48-0.000687-0.00750.497014


Parameters (Session):
par1 = 48 ; par2 = 0.0 ; par3 = 1 ; par4 = 0 ; par5 = 12 ; par6 = White Noise ; par7 = 0.95 ;
Parameters (R input):
par1 = 48 ; par2 = 0.0 ; par3 = 1 ; par4 = 0 ; par5 = 12 ; par6 = White Noise ; par7 = 0.95 ; par8 = ;
R code (references can be found in the software module):
if (par1 == 'Default') {
par1 = 10*log10(length(x))
} else {
par1 <- as.numeric(par1)
}
par2 <- as.numeric(par2)
par3 <- as.numeric(par3)
par4 <- as.numeric(par4)
par5 <- as.numeric(par5)
if (par6 == 'White Noise') par6 <- 'white' else par6 <- 'ma'
par7 <- as.numeric(par7)
if (par8 != '') par8 <- as.numeric(par8)
ox <- x
if (par8 == '') {
if (par2 == 0) {
x <- log(x)
} else {
x <- (x ^ par2 - 1) / par2
}
} else {
x <- log(x,base=par8)
}
if (par3 > 0) x <- diff(x,lag=1,difference=par3)
if (par4 > 0) x <- diff(x,lag=par5,difference=par4)
bitmap(file='picts.png')
op <- par(mfrow=c(2,1))
plot(ox,type='l',main='Original Time Series',xlab='time',ylab='value')
if (par8=='') {
mytitle <- paste('Working Time Series (lambda=',par2,', d=',par3,', D=',par4,')',sep='')
mysub <- paste('(lambda=',par2,', d=',par3,', D=',par4,', CI=', par7, ', CI type=',par6,')',sep='')
} else {
mytitle <- paste('Working Time Series (base=',par8,', d=',par3,', D=',par4,')',sep='')
mysub <- paste('(base=',par8,', d=',par3,', D=',par4,', CI=', par7, ', CI type=',par6,')',sep='')
}
plot(x,type='l', main=mytitle,xlab='time',ylab='value')
par(op)
dev.off()
bitmap(file='pic1.png')
racf <- acf(x, par1, main='Autocorrelation', xlab='time lag', ylab='ACF', ci.type=par6, ci=par7, sub=mysub)
dev.off()
bitmap(file='pic2.png')
rpacf <- pacf(x,par1,main='Partial Autocorrelation',xlab='lags',ylab='PACF',sub=mysub)
dev.off()
(myacf <- c(racf$acf))
(mypacf <- c(rpacf$acf))
lengthx <- length(x)
sqrtn <- sqrt(lengthx)
load(file='createtable')
a<-table.start()
a<-table.row.start(a)
a<-table.element(a,'Autocorrelation Function',4,TRUE)
a<-table.row.end(a)
a<-table.row.start(a)
a<-table.element(a,'Time lag k',header=TRUE)
a<-table.element(a,hyperlink('basics.htm','ACF(k)','click here for more information about the Autocorrelation Function'),header=TRUE)
a<-table.element(a,'T-STAT',header=TRUE)
a<-table.element(a,'P-value',header=TRUE)
a<-table.row.end(a)
for (i in 2:(par1+1)) {
a<-table.row.start(a)
a<-table.element(a,i-1,header=TRUE)
a<-table.element(a,round(myacf[i],6))
mytstat <- myacf[i]*sqrtn
a<-table.element(a,round(mytstat,4))
a<-table.element(a,round(1-pt(abs(mytstat),lengthx),6))
a<-table.row.end(a)
}
a<-table.end(a)
table.save(a,file='mytable.tab')
a<-table.start()
a<-table.row.start(a)
a<-table.element(a,'Partial Autocorrelation Function',4,TRUE)
a<-table.row.end(a)
a<-table.row.start(a)
a<-table.element(a,'Time lag k',header=TRUE)
a<-table.element(a,hyperlink('basics.htm','PACF(k)','click here for more information about the Partial Autocorrelation Function'),header=TRUE)
a<-table.element(a,'T-STAT',header=TRUE)
a<-table.element(a,'P-value',header=TRUE)
a<-table.row.end(a)
for (i in 1:par1) {
a<-table.row.start(a)
a<-table.element(a,i,header=TRUE)
a<-table.element(a,round(mypacf[i],6))
mytstat <- mypacf[i]*sqrtn
a<-table.element(a,round(mytstat,4))
a<-table.element(a,round(1-pt(abs(mytstat),lengthx),6))
a<-table.row.end(a)
}
a<-table.end(a)
table.save(a,file='mytable1.tab')