Free Statistics
of Irreproducible Research!
Description of Statistical Computation | |
|---|---|
| Author's title | |
| Author | *The author of this computation has been verified* |
| R Software Module | Rscript (source code is shown below) |
| Title produced by software | R console |
| Date of computation | Thu, 11 Aug 2011 20:49:50 -0400 |
| Cite this page as follows | Statistical Computations at FreeStatistics.org, Office for Research Development and Education, URL https://freestatistics.org/blog/index.php?v=date/2011/Aug/11/t1313110190znsxvlavkkj6f27.htm/, Retrieved Wed, 15 May 2024 11:55:53 +0000 |
| Statistical Computations at FreeStatistics.org, Office for Research Development and Education, URL https://freestatistics.org/blog/index.php?pk=123588, Retrieved Wed, 15 May 2024 11:55:53 +0000 | |
| QR Codes: | |
|
| |
| Original text written by user: | This example is used in the manual files of the RC package. |
| IsPrivate? | No (this computation is public) |
| User-defined keywords | blogtest |
| Estimated Impact | 169 |
Tree of Dependent Computations | |
| Family? (F = Feedback message, R = changed R code, M = changed R Module, P = changed Parameters, D = changed Data) | |
| - [Spectral Analysis] [] [2009-06-19 08:45:25] [b98453cac15ba1066b407e146608df68] - RMPD [R console] [correlation test] [2011-08-12 00:49:50] [256f657a32c6b2b7628dddcfa9a822d0] [Current] | |
| Feedback Forum | |
Post a new message | |
Dataset | |
| Dataseries X: | |
-0.332152515792827 0.976374479186704 -0.614330769880566 -1.19843012606314 0.0616363027322233 0.215263681246974 -1.69101523753683 -1.00211356085047 0.398533315372693 1.22476643693931 0.250793231593509 -0.450770212162553 -0.314191513254141 -0.299314714718148 0.985831242973625 0.637321795015652 -1.47478426883259 1.40416318284392 -0.020002667308986 0.206819929132741 -0.421339738719082 -0.188536981085364 0.010482721618763 1.43622140196327 -0.382281453657436 -1.36073806810164 0.12971416578599 -1.29375876931712 0.495095009441659 -1.11333737685398 0.746312535405677 0.111764956307531 0.560477532194339 -0.9311856581052 -0.538487735494615 -0.649399788873163 1.20498698757616 0.645412760166892 -0.0230474920219155 -0.0579861225263889 -0.356190808872435 -1.22090987774515 0.297161320813187 -1.82870731251744 0.215961653202069 0.724682651584002 -1.18091694509076 -1.51511051001984 1.40780534250598 -0.250919586542212 -0.19227338515672 -0.189706858565682 0.394844669661704 0.0876176737825625 -0.33703607503441 -0.879720685507921 0.771431468619106 0.30429439485184 -0.328048894930019 1.00337381609914 -0.476569680179237 0.953012633883828 -0.444556003401417 0.268429691332547 -0.286209443639025 1.32998745104431 0.22356683992813 -0.734498871339128 -0.641633991999084 -1.13694193367338 0.722177792176487 0.626599004773289 0.238830466398263 0.843564996204491 -0.244220456446172 0.792530925016761 0.410125706460178 -0.526030080733828 -0.339392690498751 1.44405334062806 -0.360029638498035 -0.99399619913523 0.481333181153205 0.852305725275646 -0.165579581120196 0.036648565223216 0.571778479259423 -0.530172512667127 -0.36345211924722 -1.1975811038155 -1.78512657532307 -0.295300288201997 -1.07022404498201 1.21413610177472 0.606039173793578 -0.459327792365496 1.29915451042528 -1.5684053856975 0.044001330696602 0.867475822498516 | |
Tables (Output of Computation) | |
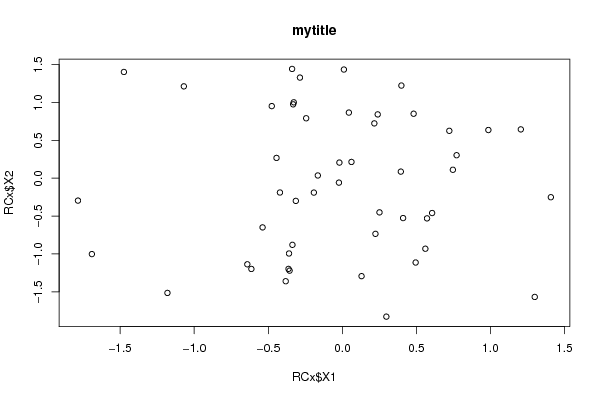
> title = 'my title'


> {
+     plot(RCx$X1, RCx$X2, main = title)
+     res <- cor.test(RCx$X1, RCx$X2)
+     print(res)
+ }

	Pearson's product-moment correlation

data:  RCx$X1 and RCx$X2
t = 0.1217, df = 48, p-value = 0.9036
alternative hypothesis: true correlation is not equal to 0
95 percent confidence interval:
 -0.2621  0.2945
sample estimates:
    cor
0.01756
| |
Figures (Output of Computation) | |
Input Parameters & R Code | |
| Parameters (Session): | |
| par1 = 'mytitle' ; | |
| Parameters (R input): | |
| R code (body of R function): | |
{ | |