Free Statistics

of Irreproducible Research!

Author's title

Author*Unverified author*
R Software Modulerwasp_smp.wasp
Title produced by softwareStandard Deviation-Mean Plot
Date of computationTue, 09 Aug 2011 12:09:25 -0400
Cite this page as followsStatistical Computations at FreeStatistics.org, Office for Research Development and Education, URL https://freestatistics.org/blog/index.php?v=date/2011/Aug/09/t1312907280dhpfra3xh1r2vuh.htm/, Retrieved Mon, 13 May 2024 21:08:59 +0000
Statistical Computations at FreeStatistics.org, Office for Research Development and Education, URL https://freestatistics.org/blog/index.php?pk=123508, Retrieved Mon, 13 May 2024 21:08:59 +0000
QR Codes:

Original text written by user:
IsPrivate?No (this computation is public)
User-defined keywordsVan den Buys Daphné
Estimated Impact125
Family? (F = Feedback message, R = changed R code, M = changed R Module, P = changed Parameters, D = changed Data)
-       [Standard Deviation-Mean Plot] [Tijdreeks B-stap 21] [2011-08-09 16:09:25] [d41d8cd98f00b204e9800998ecf8427e] [Current]
Feedback Forum

Post a new message
Dataseries X:
760
730
730
680
730
710
800
830
820
770
800
840
800
710
800
780
760
730
770
880
850
810
770
810
890
790
840
830
740
760
630
890
900
820
810
820
890
810
810
840
830
790
610
870
870
820
800
840
860
860
730
850
860
900
610
960
820
860
810
820
820
880
840
910
860
880
620
970
810
880
870
800
740
1010
850
980
880
870
660
940
860
880
1000
840
800
1060
790
930
920
840
690
940
1010
890
1000
820
800
1000
780
1010
950
830
670
1000
960
920
1040
860


Summary of computational transaction
Raw Inputview raw input (R code)
Raw Outputview raw output of R engine
Computing time1 seconds
R Server'AstonUniversity' @ aston.wessa.net

\begin{tabular}{lllllllll}
\hline
Summary of computational transaction \tabularnewline
Raw Input & view raw input (R code)  \tabularnewline
Raw Output & view raw output of R engine  \tabularnewline
Computing time & 1 seconds \tabularnewline
R Server & 'AstonUniversity' @ aston.wessa.net \tabularnewline
\hline
\end{tabular}
%Source: https://freestatistics.org/blog/index.php?pk=123508&T=0

[TABLE]
[ROW][C]Summary of computational transaction[/C][/ROW]
[ROW][C]Raw Input[/C][C]view raw input (R code) [/C][/ROW]
[ROW][C]Raw Output[/C][C]view raw output of R engine [/C][/ROW]
[ROW][C]Computing time[/C][C]1 seconds[/C][/ROW]
[ROW][C]R Server[/C][C]'AstonUniversity' @ aston.wessa.net[/C][/ROW]
[/TABLE]
Source: https://freestatistics.org/blog/index.php?pk=123508&T=0

Globally Unique Identifier (entire table): ba.freestatistics.org/blog/index.php?pk=123508&T=0

As an alternative you can also use a QR Code:  

The GUIDs for individual cells are displayed in the table below:

Summary of computational transaction
Raw Inputview raw input (R code)
Raw Outputview raw output of R engine
Computing time1 seconds
R Server'AstonUniversity' @ aston.wessa.net


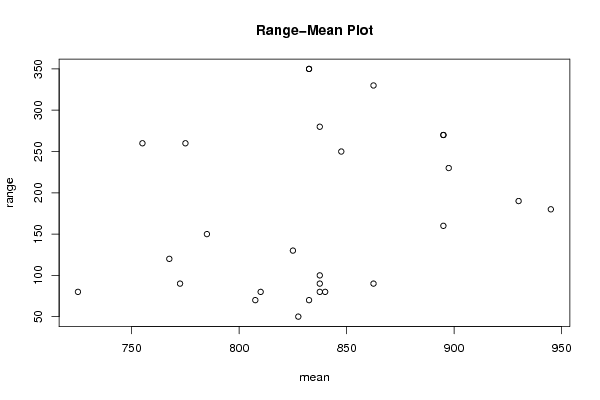
Standard Deviation-Mean Plot
SectionMeanStandard DeviationRange
172533.16624790355480
2767.556.7890834580027120
3807.529.860788111948270
4772.542.720018726587790
578565.57438524302150
681032.65986323710980
7837.541.1298755975102100
8755106.614570611463260
9837.541.932485418030490
10837.537.749172176353780
11775114.74609652039260
12832.529.860788111948270
1382563.5085296108588130
14832.5153.920975395385350
15827.522.173557826083550
16862.540.311288741492790
17832.5149.527032115713350
1884040.824829046386380
19895124.498995979887270
20837.5122.304265393049280
2189571.8795288428261160
22895127.148207485071270
23847.5113.541475535007250
2493091.2870929175277190
25897.5124.465524008324230
26862.5146.82756326158330
2794575.4983443527075180

\begin{tabular}{lllllllll}
\hline
Standard Deviation-Mean Plot \tabularnewline
Section & Mean & Standard Deviation & Range \tabularnewline
1 & 725 & 33.166247903554 & 80 \tabularnewline
2 & 767.5 & 56.7890834580027 & 120 \tabularnewline
3 & 807.5 & 29.8607881119482 & 70 \tabularnewline
4 & 772.5 & 42.7200187265877 & 90 \tabularnewline
5 & 785 & 65.57438524302 & 150 \tabularnewline
6 & 810 & 32.659863237109 & 80 \tabularnewline
7 & 837.5 & 41.1298755975102 & 100 \tabularnewline
8 & 755 & 106.614570611463 & 260 \tabularnewline
9 & 837.5 & 41.9324854180304 & 90 \tabularnewline
10 & 837.5 & 37.7491721763537 & 80 \tabularnewline
11 & 775 & 114.74609652039 & 260 \tabularnewline
12 & 832.5 & 29.8607881119482 & 70 \tabularnewline
13 & 825 & 63.5085296108588 & 130 \tabularnewline
14 & 832.5 & 153.920975395385 & 350 \tabularnewline
15 & 827.5 & 22.1735578260835 & 50 \tabularnewline
16 & 862.5 & 40.3112887414927 & 90 \tabularnewline
17 & 832.5 & 149.527032115713 & 350 \tabularnewline
18 & 840 & 40.8248290463863 & 80 \tabularnewline
19 & 895 & 124.498995979887 & 270 \tabularnewline
20 & 837.5 & 122.304265393049 & 280 \tabularnewline
21 & 895 & 71.8795288428261 & 160 \tabularnewline
22 & 895 & 127.148207485071 & 270 \tabularnewline
23 & 847.5 & 113.541475535007 & 250 \tabularnewline
24 & 930 & 91.2870929175277 & 190 \tabularnewline
25 & 897.5 & 124.465524008324 & 230 \tabularnewline
26 & 862.5 & 146.82756326158 & 330 \tabularnewline
27 & 945 & 75.4983443527075 & 180 \tabularnewline
\hline
\end{tabular}
%Source: https://freestatistics.org/blog/index.php?pk=123508&T=1

[TABLE]
[ROW][C]Standard Deviation-Mean Plot[/C][/ROW]
[ROW][C]Section[/C][C]Mean[/C][C]Standard Deviation[/C][C]Range[/C][/ROW]
[ROW][C]1[/C][C]725[/C][C]33.166247903554[/C][C]80[/C][/ROW]
[ROW][C]2[/C][C]767.5[/C][C]56.7890834580027[/C][C]120[/C][/ROW]
[ROW][C]3[/C][C]807.5[/C][C]29.8607881119482[/C][C]70[/C][/ROW]
[ROW][C]4[/C][C]772.5[/C][C]42.7200187265877[/C][C]90[/C][/ROW]
[ROW][C]5[/C][C]785[/C][C]65.57438524302[/C][C]150[/C][/ROW]
[ROW][C]6[/C][C]810[/C][C]32.659863237109[/C][C]80[/C][/ROW]
[ROW][C]7[/C][C]837.5[/C][C]41.1298755975102[/C][C]100[/C][/ROW]
[ROW][C]8[/C][C]755[/C][C]106.614570611463[/C][C]260[/C][/ROW]
[ROW][C]9[/C][C]837.5[/C][C]41.9324854180304[/C][C]90[/C][/ROW]
[ROW][C]10[/C][C]837.5[/C][C]37.7491721763537[/C][C]80[/C][/ROW]
[ROW][C]11[/C][C]775[/C][C]114.74609652039[/C][C]260[/C][/ROW]
[ROW][C]12[/C][C]832.5[/C][C]29.8607881119482[/C][C]70[/C][/ROW]
[ROW][C]13[/C][C]825[/C][C]63.5085296108588[/C][C]130[/C][/ROW]
[ROW][C]14[/C][C]832.5[/C][C]153.920975395385[/C][C]350[/C][/ROW]
[ROW][C]15[/C][C]827.5[/C][C]22.1735578260835[/C][C]50[/C][/ROW]
[ROW][C]16[/C][C]862.5[/C][C]40.3112887414927[/C][C]90[/C][/ROW]
[ROW][C]17[/C][C]832.5[/C][C]149.527032115713[/C][C]350[/C][/ROW]
[ROW][C]18[/C][C]840[/C][C]40.8248290463863[/C][C]80[/C][/ROW]
[ROW][C]19[/C][C]895[/C][C]124.498995979887[/C][C]270[/C][/ROW]
[ROW][C]20[/C][C]837.5[/C][C]122.304265393049[/C][C]280[/C][/ROW]
[ROW][C]21[/C][C]895[/C][C]71.8795288428261[/C][C]160[/C][/ROW]
[ROW][C]22[/C][C]895[/C][C]127.148207485071[/C][C]270[/C][/ROW]
[ROW][C]23[/C][C]847.5[/C][C]113.541475535007[/C][C]250[/C][/ROW]
[ROW][C]24[/C][C]930[/C][C]91.2870929175277[/C][C]190[/C][/ROW]
[ROW][C]25[/C][C]897.5[/C][C]124.465524008324[/C][C]230[/C][/ROW]
[ROW][C]26[/C][C]862.5[/C][C]146.82756326158[/C][C]330[/C][/ROW]
[ROW][C]27[/C][C]945[/C][C]75.4983443527075[/C][C]180[/C][/ROW]
[/TABLE]
Source: https://freestatistics.org/blog/index.php?pk=123508&T=1

Globally Unique Identifier (entire table): ba.freestatistics.org/blog/index.php?pk=123508&T=1

As an alternative you can also use a QR Code:  

The GUIDs for individual cells are displayed in the table below:

Standard Deviation-Mean Plot
SectionMeanStandard DeviationRange
172533.16624790355480
2767.556.7890834580027120
3807.529.860788111948270
4772.542.720018726587790
578565.57438524302150
681032.65986323710980
7837.541.1298755975102100
8755106.614570611463260
9837.541.932485418030490
10837.537.749172176353780
11775114.74609652039260
12832.529.860788111948270
1382563.5085296108588130
14832.5153.920975395385350
15827.522.173557826083550
16862.540.311288741492790
17832.5149.527032115713350
1884040.824829046386380
19895124.498995979887270
20837.5122.304265393049280
2189571.8795288428261160
22895127.148207485071270
23847.5113.541475535007250
2493091.2870929175277190
25897.5124.465524008324230
26862.5146.82756326158330
2794575.4983443527075180


Regression: S.E.(k) = alpha + beta * Mean(k)
alpha-127.000389592012
beta0.245021872365665
S.D.0.157238409870407
T-STAT1.55828256319564
p-value0.131736738962461

\begin{tabular}{lllllllll}
\hline
Regression: S.E.(k) = alpha + beta * Mean(k) \tabularnewline
alpha & -127.000389592012 \tabularnewline
beta & 0.245021872365665 \tabularnewline
S.D. & 0.157238409870407 \tabularnewline
T-STAT & 1.55828256319564 \tabularnewline
p-value & 0.131736738962461 \tabularnewline
\hline
\end{tabular}
%Source: https://freestatistics.org/blog/index.php?pk=123508&T=2

[TABLE]
[ROW][C]Regression: S.E.(k) = alpha + beta * Mean(k)[/C][/ROW]
[ROW][C]alpha[/C][C]-127.000389592012[/C][/ROW]
[ROW][C]beta[/C][C]0.245021872365665[/C][/ROW]
[ROW][C]S.D.[/C][C]0.157238409870407[/C][/ROW]
[ROW][C]T-STAT[/C][C]1.55828256319564[/C][/ROW]
[ROW][C]p-value[/C][C]0.131736738962461[/C][/ROW]
[/TABLE]
Source: https://freestatistics.org/blog/index.php?pk=123508&T=2

Globally Unique Identifier (entire table): ba.freestatistics.org/blog/index.php?pk=123508&T=2

As an alternative you can also use a QR Code:  

The GUIDs for individual cells are displayed in the table below:

Regression: S.E.(k) = alpha + beta * Mean(k)
alpha-127.000389592012
beta0.245021872365665
S.D.0.157238409870407
T-STAT1.55828256319564
p-value0.131736738962461


Regression: ln S.E.(k) = alpha + beta * ln Mean(k)
alpha-16.2447810455612
beta3.0377173618308
S.D.1.80787352382591
T-STAT1.68027094915481
p-value0.105359558003006
Lambda-2.0377173618308

\begin{tabular}{lllllllll}
\hline
Regression: ln S.E.(k) = alpha + beta * ln Mean(k) \tabularnewline
alpha & -16.2447810455612 \tabularnewline
beta & 3.0377173618308 \tabularnewline
S.D. & 1.80787352382591 \tabularnewline
T-STAT & 1.68027094915481 \tabularnewline
p-value & 0.105359558003006 \tabularnewline
Lambda & -2.0377173618308 \tabularnewline
\hline
\end{tabular}
%Source: https://freestatistics.org/blog/index.php?pk=123508&T=3

[TABLE]
[ROW][C]Regression: ln S.E.(k) = alpha + beta * ln Mean(k)[/C][/ROW]
[ROW][C]alpha[/C][C]-16.2447810455612[/C][/ROW]
[ROW][C]beta[/C][C]3.0377173618308[/C][/ROW]
[ROW][C]S.D.[/C][C]1.80787352382591[/C][/ROW]
[ROW][C]T-STAT[/C][C]1.68027094915481[/C][/ROW]
[ROW][C]p-value[/C][C]0.105359558003006[/C][/ROW]
[ROW][C]Lambda[/C][C]-2.0377173618308[/C][/ROW]
[/TABLE]
Source: https://freestatistics.org/blog/index.php?pk=123508&T=3

Globally Unique Identifier (entire table): ba.freestatistics.org/blog/index.php?pk=123508&T=3

As an alternative you can also use a QR Code:  

The GUIDs for individual cells are displayed in the table below:

Regression: ln S.E.(k) = alpha + beta * ln Mean(k)
alpha-16.2447810455612
beta3.0377173618308
S.D.1.80787352382591
T-STAT1.68027094915481
p-value0.105359558003006
Lambda-2.0377173618308


Parameters (Session):
par1 = 4 ;
Parameters (R input):
par1 = 4 ;
R code (references can be found in the software module):
par1 <- as.numeric(par1)
(n <- length(x))
(np <- floor(n / par1))
arr <- array(NA,dim=c(par1,np))
j <- 0
k <- 1
for (i in 1:(np*par1))
{
j = j + 1
arr[j,k] <- x[i]
if (j == par1) {
j = 0
k=k+1
}
}
arr
arr.mean <- array(NA,dim=np)
arr.sd <- array(NA,dim=np)
arr.range <- array(NA,dim=np)
for (j in 1:np)
{
arr.mean[j] <- mean(arr[,j],na.rm=TRUE)
arr.sd[j] <- sd(arr[,j],na.rm=TRUE)
arr.range[j] <- max(arr[,j],na.rm=TRUE) - min(arr[,j],na.rm=TRUE)
}
arr.mean
arr.sd
arr.range
(lm1 <- lm(arr.sd~arr.mean))
(lnlm1 <- lm(log(arr.sd)~log(arr.mean)))
(lm2 <- lm(arr.range~arr.mean))
bitmap(file='test1.png')
plot(arr.mean,arr.sd,main='Standard Deviation-Mean Plot',xlab='mean',ylab='standard deviation')
dev.off()
bitmap(file='test2.png')
plot(arr.mean,arr.range,main='Range-Mean Plot',xlab='mean',ylab='range')
dev.off()
load(file='createtable')
a<-table.start()
a<-table.row.start(a)
a<-table.element(a,'Standard Deviation-Mean Plot',4,TRUE)
a<-table.row.end(a)
a<-table.row.start(a)
a<-table.element(a,'Section',header=TRUE)
a<-table.element(a,'Mean',header=TRUE)
a<-table.element(a,'Standard Deviation',header=TRUE)
a<-table.element(a,'Range',header=TRUE)
a<-table.row.end(a)
for (j in 1:np) {
a<-table.row.start(a)
a<-table.element(a,j,header=TRUE)
a<-table.element(a,arr.mean[j])
a<-table.element(a,arr.sd[j] )
a<-table.element(a,arr.range[j] )
a<-table.row.end(a)
}
a<-table.end(a)
table.save(a,file='mytable.tab')
a<-table.start()
a<-table.row.start(a)
a<-table.element(a,'Regression: S.E.(k) = alpha + beta * Mean(k)',2,TRUE)
a<-table.row.end(a)
a<-table.row.start(a)
a<-table.element(a,'alpha',header=TRUE)
a<-table.element(a,lm1$coefficients[[1]])
a<-table.row.end(a)
a<-table.row.start(a)
a<-table.element(a,'beta',header=TRUE)
a<-table.element(a,lm1$coefficients[[2]])
a<-table.row.end(a)
a<-table.row.start(a)
a<-table.element(a,'S.D.',header=TRUE)
a<-table.element(a,summary(lm1)$coefficients[2,2])
a<-table.row.end(a)
a<-table.row.start(a)
a<-table.element(a,'T-STAT',header=TRUE)
a<-table.element(a,summary(lm1)$coefficients[2,3])
a<-table.row.end(a)
a<-table.row.start(a)
a<-table.element(a,'p-value',header=TRUE)
a<-table.element(a,summary(lm1)$coefficients[2,4])
a<-table.row.end(a)
a<-table.end(a)
table.save(a,file='mytable1.tab')
a<-table.start()
a<-table.row.start(a)
a<-table.element(a,'Regression: ln S.E.(k) = alpha + beta * ln Mean(k)',2,TRUE)
a<-table.row.end(a)
a<-table.row.start(a)
a<-table.element(a,'alpha',header=TRUE)
a<-table.element(a,lnlm1$coefficients[[1]])
a<-table.row.end(a)
a<-table.row.start(a)
a<-table.element(a,'beta',header=TRUE)
a<-table.element(a,lnlm1$coefficients[[2]])
a<-table.row.end(a)
a<-table.row.start(a)
a<-table.element(a,'S.D.',header=TRUE)
a<-table.element(a,summary(lnlm1)$coefficients[2,2])
a<-table.row.end(a)
a<-table.row.start(a)
a<-table.element(a,'T-STAT',header=TRUE)
a<-table.element(a,summary(lnlm1)$coefficients[2,3])
a<-table.row.end(a)
a<-table.row.start(a)
a<-table.element(a,'p-value',header=TRUE)
a<-table.element(a,summary(lnlm1)$coefficients[2,4])
a<-table.row.end(a)
a<-table.row.start(a)
a<-table.element(a,'Lambda',header=TRUE)
a<-table.element(a,1-lnlm1$coefficients[[2]])
a<-table.row.end(a)
a<-table.end(a)
table.save(a,file='mytable2.tab')