Free Statistics

of Irreproducible Research!

Author's title

Author*Unverified author*
R Software Modulerwasp_smp.wasp
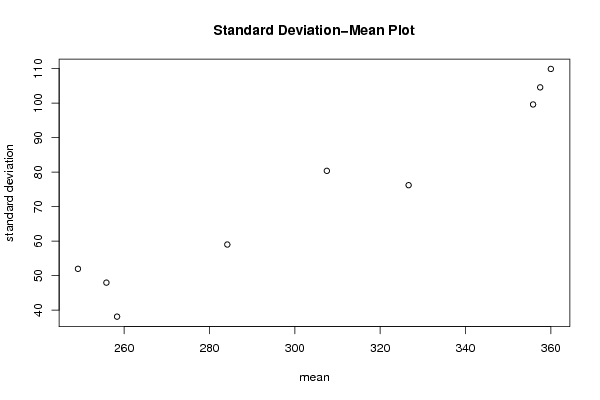
Title produced by softwareStandard Deviation-Mean Plot
Date of computationTue, 09 Aug 2011 11:28:44 -0400
Cite this page as followsStatistical Computations at FreeStatistics.org, Office for Research Development and Education, URL https://freestatistics.org/blog/index.php?v=date/2011/Aug/09/t1312903759iwvvag77a11ky17.htm/, Retrieved Tue, 14 May 2024 15:03:46 +0000
Statistical Computations at FreeStatistics.org, Office for Research Development and Education, URL https://freestatistics.org/blog/index.php?pk=123495, Retrieved Tue, 14 May 2024 15:03:46 +0000
QR Codes:

Original text written by user:
IsPrivate?No (this computation is public)
User-defined keywordsNick Verbeke
Estimated Impact139
Family? (F = Feedback message, R = changed R code, M = changed R Module, P = changed Parameters, D = changed Data)
-       [Standard Deviation-Mean Plot] [TIJDREEKS B - STA...] [2011-08-09 15:28:44] [af5734c86e7bdbdfefb37d9aed9dbb03] [Current]
Feedback Forum

Post a new message
Dataseries X:
240
150
290
210
240
240
310
310
190
230
260
320
270
250
240
250
230
230
240
300
190
270
300
330
230
260
300
330
190
260
240
270
170
230
270
320
190
300
310
360
170
280
270
260
280
300
320
370
210
310
290
450
190
290
280
310
340
220
390
410
250
310
280
450
210
390
300
310
370
250
440
360
290
300
340
600
220
410
360
250
410
290
470
350
330
250
270
580
260
450
320
240
420
380
400
370
300
310
280
560
280
480
320
170
420
310
470
420


Summary of computational transaction
Raw Inputview raw input (R code)
Raw Outputview raw output of R engine
Computing time0 seconds
R Server'Gwilym Jenkins' @ jenkins.wessa.net

\begin{tabular}{lllllllll}
\hline
Summary of computational transaction \tabularnewline
Raw Input & view raw input (R code)  \tabularnewline
Raw Output & view raw output of R engine  \tabularnewline
Computing time & 0 seconds \tabularnewline
R Server & 'Gwilym Jenkins' @ jenkins.wessa.net \tabularnewline
\hline
\end{tabular}
%Source: https://freestatistics.org/blog/index.php?pk=123495&T=0

[TABLE]
[ROW][C]Summary of computational transaction[/C][/ROW]
[ROW][C]Raw Input[/C][C]view raw input (R code) [/C][/ROW]
[ROW][C]Raw Output[/C][C]view raw output of R engine [/C][/ROW]
[ROW][C]Computing time[/C][C]0 seconds[/C][/ROW]
[ROW][C]R Server[/C][C]'Gwilym Jenkins' @ jenkins.wessa.net[/C][/ROW]
[/TABLE]
Source: https://freestatistics.org/blog/index.php?pk=123495&T=0

Globally Unique Identifier (entire table): ba.freestatistics.org/blog/index.php?pk=123495&T=0

As an alternative you can also use a QR Code:  

The GUIDs for individual cells are displayed in the table below:

Summary of computational transaction
Raw Inputview raw input (R code)
Raw Outputview raw output of R engine
Computing time0 seconds
R Server'Gwilym Jenkins' @ jenkins.wessa.net


Standard Deviation-Mean Plot
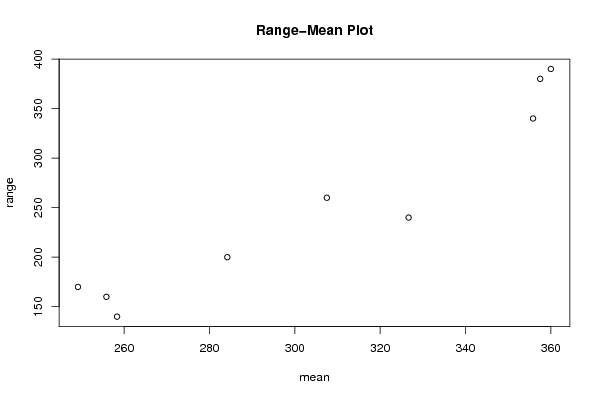
SectionMeanStandard DeviationRange
1249.16666666666751.9542339395205170
2258.33333333333338.0987552488943140
3255.83333333333347.9504163093755160
4284.16666666666759.0005136084476200
5307.580.3543289550612260
6326.66666666666776.1975104977886240
7357.5104.544466398492380
8355.83333333333399.5862653302364340
9360109.875963125368390

\begin{tabular}{lllllllll}
\hline
Standard Deviation-Mean Plot \tabularnewline
Section & Mean & Standard Deviation & Range \tabularnewline
1 & 249.166666666667 & 51.9542339395205 & 170 \tabularnewline
2 & 258.333333333333 & 38.0987552488943 & 140 \tabularnewline
3 & 255.833333333333 & 47.9504163093755 & 160 \tabularnewline
4 & 284.166666666667 & 59.0005136084476 & 200 \tabularnewline
5 & 307.5 & 80.3543289550612 & 260 \tabularnewline
6 & 326.666666666667 & 76.1975104977886 & 240 \tabularnewline
7 & 357.5 & 104.544466398492 & 380 \tabularnewline
8 & 355.833333333333 & 99.5862653302364 & 340 \tabularnewline
9 & 360 & 109.875963125368 & 390 \tabularnewline
\hline
\end{tabular}
%Source: https://freestatistics.org/blog/index.php?pk=123495&T=1

[TABLE]
[ROW][C]Standard Deviation-Mean Plot[/C][/ROW]
[ROW][C]Section[/C][C]Mean[/C][C]Standard Deviation[/C][C]Range[/C][/ROW]
[ROW][C]1[/C][C]249.166666666667[/C][C]51.9542339395205[/C][C]170[/C][/ROW]
[ROW][C]2[/C][C]258.333333333333[/C][C]38.0987552488943[/C][C]140[/C][/ROW]
[ROW][C]3[/C][C]255.833333333333[/C][C]47.9504163093755[/C][C]160[/C][/ROW]
[ROW][C]4[/C][C]284.166666666667[/C][C]59.0005136084476[/C][C]200[/C][/ROW]
[ROW][C]5[/C][C]307.5[/C][C]80.3543289550612[/C][C]260[/C][/ROW]
[ROW][C]6[/C][C]326.666666666667[/C][C]76.1975104977886[/C][C]240[/C][/ROW]
[ROW][C]7[/C][C]357.5[/C][C]104.544466398492[/C][C]380[/C][/ROW]
[ROW][C]8[/C][C]355.833333333333[/C][C]99.5862653302364[/C][C]340[/C][/ROW]
[ROW][C]9[/C][C]360[/C][C]109.875963125368[/C][C]390[/C][/ROW]
[/TABLE]
Source: https://freestatistics.org/blog/index.php?pk=123495&T=1

Globally Unique Identifier (entire table): ba.freestatistics.org/blog/index.php?pk=123495&T=1

As an alternative you can also use a QR Code:  

The GUIDs for individual cells are displayed in the table below:

Standard Deviation-Mean Plot
SectionMeanStandard DeviationRange
1249.16666666666751.9542339395205170
2258.33333333333338.0987552488943140
3255.83333333333347.9504163093755160
4284.16666666666759.0005136084476200
5307.580.3543289550612260
6326.66666666666776.1975104977886240
7357.5104.544466398492380
8355.83333333333399.5862653302364340
9360109.875963125368390


Regression: S.E.(k) = alpha + beta * Mean(k)
alpha-96.0210777154978
beta0.555989892142528
S.D.0.0542935584198431
T-STAT10.2404393508922
p-value1.82885733186438e-05

\begin{tabular}{lllllllll}
\hline
Regression: S.E.(k) = alpha + beta * Mean(k) \tabularnewline
alpha & -96.0210777154978 \tabularnewline
beta & 0.555989892142528 \tabularnewline
S.D. & 0.0542935584198431 \tabularnewline
T-STAT & 10.2404393508922 \tabularnewline
p-value & 1.82885733186438e-05 \tabularnewline
\hline
\end{tabular}
%Source: https://freestatistics.org/blog/index.php?pk=123495&T=2

[TABLE]
[ROW][C]Regression: S.E.(k) = alpha + beta * Mean(k)[/C][/ROW]
[ROW][C]alpha[/C][C]-96.0210777154978[/C][/ROW]
[ROW][C]beta[/C][C]0.555989892142528[/C][/ROW]
[ROW][C]S.D.[/C][C]0.0542935584198431[/C][/ROW]
[ROW][C]T-STAT[/C][C]10.2404393508922[/C][/ROW]
[ROW][C]p-value[/C][C]1.82885733186438e-05[/C][/ROW]
[/TABLE]
Source: https://freestatistics.org/blog/index.php?pk=123495&T=2

Globally Unique Identifier (entire table): ba.freestatistics.org/blog/index.php?pk=123495&T=2

As an alternative you can also use a QR Code:  

The GUIDs for individual cells are displayed in the table below:

Regression: S.E.(k) = alpha + beta * Mean(k)
alpha-96.0210777154978
beta0.555989892142528
S.D.0.0542935584198431
T-STAT10.2404393508922
p-value1.82885733186438e-05


Regression: ln S.E.(k) = alpha + beta * ln Mean(k)
alpha-9.31079879572673
beta2.37255395598742
S.D.0.282172007815765
T-STAT8.40818327215682
p-value6.62479516114281e-05
Lambda-1.37255395598742

\begin{tabular}{lllllllll}
\hline
Regression: ln S.E.(k) = alpha + beta * ln Mean(k) \tabularnewline
alpha & -9.31079879572673 \tabularnewline
beta & 2.37255395598742 \tabularnewline
S.D. & 0.282172007815765 \tabularnewline
T-STAT & 8.40818327215682 \tabularnewline
p-value & 6.62479516114281e-05 \tabularnewline
Lambda & -1.37255395598742 \tabularnewline
\hline
\end{tabular}
%Source: https://freestatistics.org/blog/index.php?pk=123495&T=3

[TABLE]
[ROW][C]Regression: ln S.E.(k) = alpha + beta * ln Mean(k)[/C][/ROW]
[ROW][C]alpha[/C][C]-9.31079879572673[/C][/ROW]
[ROW][C]beta[/C][C]2.37255395598742[/C][/ROW]
[ROW][C]S.D.[/C][C]0.282172007815765[/C][/ROW]
[ROW][C]T-STAT[/C][C]8.40818327215682[/C][/ROW]
[ROW][C]p-value[/C][C]6.62479516114281e-05[/C][/ROW]
[ROW][C]Lambda[/C][C]-1.37255395598742[/C][/ROW]
[/TABLE]
Source: https://freestatistics.org/blog/index.php?pk=123495&T=3

Globally Unique Identifier (entire table): ba.freestatistics.org/blog/index.php?pk=123495&T=3

As an alternative you can also use a QR Code:  

The GUIDs for individual cells are displayed in the table below:

Regression: ln S.E.(k) = alpha + beta * ln Mean(k)
alpha-9.31079879572673
beta2.37255395598742
S.D.0.282172007815765
T-STAT8.40818327215682
p-value6.62479516114281e-05
Lambda-1.37255395598742


Parameters (Session):
par1 = 12 ;
Parameters (R input):
par1 = 12 ;
R code (references can be found in the software module):
par1 <- as.numeric(par1)
(n <- length(x))
(np <- floor(n / par1))
arr <- array(NA,dim=c(par1,np))
j <- 0
k <- 1
for (i in 1:(np*par1))
{
j = j + 1
arr[j,k] <- x[i]
if (j == par1) {
j = 0
k=k+1
}
}
arr
arr.mean <- array(NA,dim=np)
arr.sd <- array(NA,dim=np)
arr.range <- array(NA,dim=np)
for (j in 1:np)
{
arr.mean[j] <- mean(arr[,j],na.rm=TRUE)
arr.sd[j] <- sd(arr[,j],na.rm=TRUE)
arr.range[j] <- max(arr[,j],na.rm=TRUE) - min(arr[,j],na.rm=TRUE)
}
arr.mean
arr.sd
arr.range
(lm1 <- lm(arr.sd~arr.mean))
(lnlm1 <- lm(log(arr.sd)~log(arr.mean)))
(lm2 <- lm(arr.range~arr.mean))
bitmap(file='test1.png')
plot(arr.mean,arr.sd,main='Standard Deviation-Mean Plot',xlab='mean',ylab='standard deviation')
dev.off()
bitmap(file='test2.png')
plot(arr.mean,arr.range,main='Range-Mean Plot',xlab='mean',ylab='range')
dev.off()
load(file='createtable')
a<-table.start()
a<-table.row.start(a)
a<-table.element(a,'Standard Deviation-Mean Plot',4,TRUE)
a<-table.row.end(a)
a<-table.row.start(a)
a<-table.element(a,'Section',header=TRUE)
a<-table.element(a,'Mean',header=TRUE)
a<-table.element(a,'Standard Deviation',header=TRUE)
a<-table.element(a,'Range',header=TRUE)
a<-table.row.end(a)
for (j in 1:np) {
a<-table.row.start(a)
a<-table.element(a,j,header=TRUE)
a<-table.element(a,arr.mean[j])
a<-table.element(a,arr.sd[j] )
a<-table.element(a,arr.range[j] )
a<-table.row.end(a)
}
a<-table.end(a)
table.save(a,file='mytable.tab')
a<-table.start()
a<-table.row.start(a)
a<-table.element(a,'Regression: S.E.(k) = alpha + beta * Mean(k)',2,TRUE)
a<-table.row.end(a)
a<-table.row.start(a)
a<-table.element(a,'alpha',header=TRUE)
a<-table.element(a,lm1$coefficients[[1]])
a<-table.row.end(a)
a<-table.row.start(a)
a<-table.element(a,'beta',header=TRUE)
a<-table.element(a,lm1$coefficients[[2]])
a<-table.row.end(a)
a<-table.row.start(a)
a<-table.element(a,'S.D.',header=TRUE)
a<-table.element(a,summary(lm1)$coefficients[2,2])
a<-table.row.end(a)
a<-table.row.start(a)
a<-table.element(a,'T-STAT',header=TRUE)
a<-table.element(a,summary(lm1)$coefficients[2,3])
a<-table.row.end(a)
a<-table.row.start(a)
a<-table.element(a,'p-value',header=TRUE)
a<-table.element(a,summary(lm1)$coefficients[2,4])
a<-table.row.end(a)
a<-table.end(a)
table.save(a,file='mytable1.tab')
a<-table.start()
a<-table.row.start(a)
a<-table.element(a,'Regression: ln S.E.(k) = alpha + beta * ln Mean(k)',2,TRUE)
a<-table.row.end(a)
a<-table.row.start(a)
a<-table.element(a,'alpha',header=TRUE)
a<-table.element(a,lnlm1$coefficients[[1]])
a<-table.row.end(a)
a<-table.row.start(a)
a<-table.element(a,'beta',header=TRUE)
a<-table.element(a,lnlm1$coefficients[[2]])
a<-table.row.end(a)
a<-table.row.start(a)
a<-table.element(a,'S.D.',header=TRUE)
a<-table.element(a,summary(lnlm1)$coefficients[2,2])
a<-table.row.end(a)
a<-table.row.start(a)
a<-table.element(a,'T-STAT',header=TRUE)
a<-table.element(a,summary(lnlm1)$coefficients[2,3])
a<-table.row.end(a)
a<-table.row.start(a)
a<-table.element(a,'p-value',header=TRUE)
a<-table.element(a,summary(lnlm1)$coefficients[2,4])
a<-table.row.end(a)
a<-table.row.start(a)
a<-table.element(a,'Lambda',header=TRUE)
a<-table.element(a,1-lnlm1$coefficients[[2]])
a<-table.row.end(a)
a<-table.end(a)
table.save(a,file='mytable2.tab')