Free Statistics

of Irreproducible Research!

Author's title

Author*Unverified author*
R Software Modulerwasp_autocorrelation.wasp
Title produced by software(Partial) Autocorrelation Function
Date of computationTue, 09 Aug 2011 08:43:19 -0400
Cite this page as followsStatistical Computations at FreeStatistics.org, Office for Research Development and Education, URL https://freestatistics.org/blog/index.php?v=date/2011/Aug/09/t1312893836itgkkziz6gb5mk7.htm/, Retrieved Tue, 14 May 2024 11:03:24 +0000
Statistical Computations at FreeStatistics.org, Office for Research Development and Education, URL https://freestatistics.org/blog/index.php?pk=123480, Retrieved Tue, 14 May 2024 11:03:24 +0000
QR Codes:

Original text written by user:
IsPrivate?No (this computation is public)
User-defined keywordsNick Verbeke
Estimated Impact150
Family? (F = Feedback message, R = changed R code, M = changed R Module, P = changed Parameters, D = changed Data)
-     [(Partial) Autocorrelation Function] [Autocorrelatiefun...] [2011-04-27 12:26:22] [1cb322a33a2333c24d08c776e1f699d5]
-    D    [(Partial) Autocorrelation Function] [TIJDREEKS B - STA...] [2011-08-09 12:43:19] [af5734c86e7bdbdfefb37d9aed9dbb03] [Current]
Feedback Forum

Post a new message
Dataseries X:
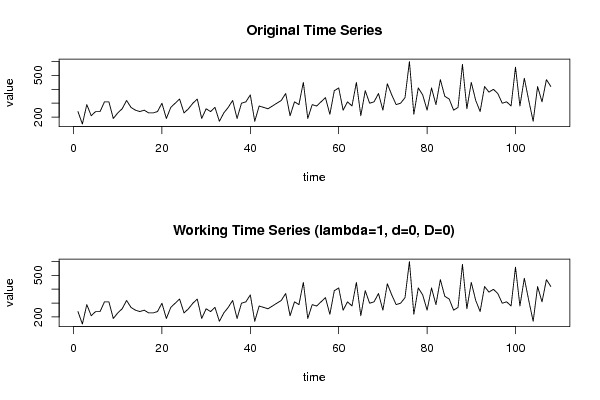
240
150
290
210
240
240
310
310
190
230
260
320
270
250
240
250
230
230
240
300
190
270
300
330
230
260
300
330
190
260
240
270
170
230
270
320
190
300
310
360
170
280
270
260
280
300
320
370
210
310
290
450
190
290
280
310
340
220
390
410
250
310
280
450
210
390
300
310
370
250
440
360
290
300
340
600
220
410
360
250
410
290
470
350
330
250
270
580
260
450
320
240
420
380
400
370
300
310
280
560
280
480
320
170
420
310
470
420


Summary of computational transaction
Raw Inputview raw input (R code)
Raw Outputview raw output of R engine
Computing time1 seconds
R Server'AstonUniversity' @ aston.wessa.net

\begin{tabular}{lllllllll}
\hline
Summary of computational transaction \tabularnewline
Raw Input & view raw input (R code)  \tabularnewline
Raw Output & view raw output of R engine  \tabularnewline
Computing time & 1 seconds \tabularnewline
R Server & 'AstonUniversity' @ aston.wessa.net \tabularnewline
\hline
\end{tabular}
%Source: https://freestatistics.org/blog/index.php?pk=123480&T=0

[TABLE]
[ROW][C]Summary of computational transaction[/C][/ROW]
[ROW][C]Raw Input[/C][C]view raw input (R code) [/C][/ROW]
[ROW][C]Raw Output[/C][C]view raw output of R engine [/C][/ROW]
[ROW][C]Computing time[/C][C]1 seconds[/C][/ROW]
[ROW][C]R Server[/C][C]'AstonUniversity' @ aston.wessa.net[/C][/ROW]
[/TABLE]
Source: https://freestatistics.org/blog/index.php?pk=123480&T=0

Globally Unique Identifier (entire table): ba.freestatistics.org/blog/index.php?pk=123480&T=0

As an alternative you can also use a QR Code:  

The GUIDs for individual cells are displayed in the table below:

Summary of computational transaction
Raw Inputview raw input (R code)
Raw Outputview raw output of R engine
Computing time1 seconds
R Server'AstonUniversity' @ aston.wessa.net


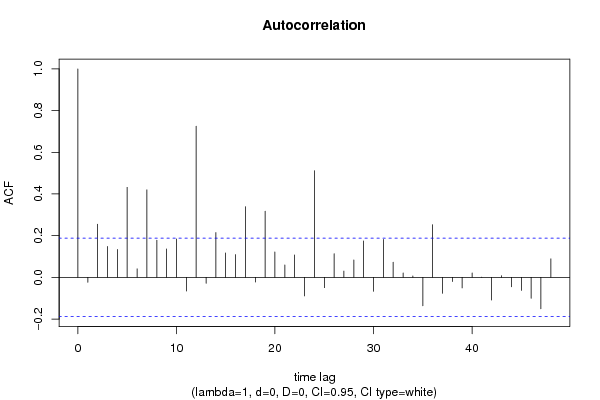
Autocorrelation Function
Time lag kACF(k)T-STATP-value
1-0.02371-0.24640.402921
20.2546782.64670.004672
30.1478381.53640.063686
40.1340671.39330.083201
50.4318594.4889e-06
60.0407540.42350.336377
70.4199354.36411.5e-05
80.1784451.85450.033201
90.1360721.41410.080104
100.1843611.91590.029008
11-0.065428-0.67990.248998
120.7254517.53910
13-0.028152-0.29260.385208
140.2147822.23210.013837
150.1169811.21570.113374
160.1091911.13470.129496
170.3389153.52210.000314
18-0.022882-0.23780.406246
190.3175183.29970.000656
200.1219771.26760.103829
210.0593840.61710.269222
220.1075291.11750.133135
23-0.089075-0.92570.178334
240.5112335.31290
25-0.049358-0.51290.30452
260.1136821.18140.120015
270.0301010.31280.377512
280.0830880.86350.194894
290.1749251.81790.035928
30-0.067202-0.69840.243219
310.1814111.88530.03104
320.0722590.75090.227163
330.0207770.21590.414728
340.006430.06680.473424
35-0.136564-1.41920.079357
360.2524932.6240.004974
37-0.076709-0.79720.213547
38-0.020018-0.2080.417799
39-0.050737-0.52730.299542
400.0208180.21630.414563
41-0.001122-0.01170.495358
42-0.108608-1.12870.130766
430.0076060.0790.468571
44-0.045398-0.47180.319014
45-0.062736-0.6520.257903
46-0.100218-1.04150.149985
47-0.151275-1.57210.059427
480.0887160.9220.1793

\begin{tabular}{lllllllll}
\hline
Autocorrelation Function \tabularnewline
Time lag k & ACF(k) & T-STAT & P-value \tabularnewline
1 & -0.02371 & -0.2464 & 0.402921 \tabularnewline
2 & 0.254678 & 2.6467 & 0.004672 \tabularnewline
3 & 0.147838 & 1.5364 & 0.063686 \tabularnewline
4 & 0.134067 & 1.3933 & 0.083201 \tabularnewline
5 & 0.431859 & 4.488 & 9e-06 \tabularnewline
6 & 0.040754 & 0.4235 & 0.336377 \tabularnewline
7 & 0.419935 & 4.3641 & 1.5e-05 \tabularnewline
8 & 0.178445 & 1.8545 & 0.033201 \tabularnewline
9 & 0.136072 & 1.4141 & 0.080104 \tabularnewline
10 & 0.184361 & 1.9159 & 0.029008 \tabularnewline
11 & -0.065428 & -0.6799 & 0.248998 \tabularnewline
12 & 0.725451 & 7.5391 & 0 \tabularnewline
13 & -0.028152 & -0.2926 & 0.385208 \tabularnewline
14 & 0.214782 & 2.2321 & 0.013837 \tabularnewline
15 & 0.116981 & 1.2157 & 0.113374 \tabularnewline
16 & 0.109191 & 1.1347 & 0.129496 \tabularnewline
17 & 0.338915 & 3.5221 & 0.000314 \tabularnewline
18 & -0.022882 & -0.2378 & 0.406246 \tabularnewline
19 & 0.317518 & 3.2997 & 0.000656 \tabularnewline
20 & 0.121977 & 1.2676 & 0.103829 \tabularnewline
21 & 0.059384 & 0.6171 & 0.269222 \tabularnewline
22 & 0.107529 & 1.1175 & 0.133135 \tabularnewline
23 & -0.089075 & -0.9257 & 0.178334 \tabularnewline
24 & 0.511233 & 5.3129 & 0 \tabularnewline
25 & -0.049358 & -0.5129 & 0.30452 \tabularnewline
26 & 0.113682 & 1.1814 & 0.120015 \tabularnewline
27 & 0.030101 & 0.3128 & 0.377512 \tabularnewline
28 & 0.083088 & 0.8635 & 0.194894 \tabularnewline
29 & 0.174925 & 1.8179 & 0.035928 \tabularnewline
30 & -0.067202 & -0.6984 & 0.243219 \tabularnewline
31 & 0.181411 & 1.8853 & 0.03104 \tabularnewline
32 & 0.072259 & 0.7509 & 0.227163 \tabularnewline
33 & 0.020777 & 0.2159 & 0.414728 \tabularnewline
34 & 0.00643 & 0.0668 & 0.473424 \tabularnewline
35 & -0.136564 & -1.4192 & 0.079357 \tabularnewline
36 & 0.252493 & 2.624 & 0.004974 \tabularnewline
37 & -0.076709 & -0.7972 & 0.213547 \tabularnewline
38 & -0.020018 & -0.208 & 0.417799 \tabularnewline
39 & -0.050737 & -0.5273 & 0.299542 \tabularnewline
40 & 0.020818 & 0.2163 & 0.414563 \tabularnewline
41 & -0.001122 & -0.0117 & 0.495358 \tabularnewline
42 & -0.108608 & -1.1287 & 0.130766 \tabularnewline
43 & 0.007606 & 0.079 & 0.468571 \tabularnewline
44 & -0.045398 & -0.4718 & 0.319014 \tabularnewline
45 & -0.062736 & -0.652 & 0.257903 \tabularnewline
46 & -0.100218 & -1.0415 & 0.149985 \tabularnewline
47 & -0.151275 & -1.5721 & 0.059427 \tabularnewline
48 & 0.088716 & 0.922 & 0.1793 \tabularnewline
\hline
\end{tabular}
%Source: https://freestatistics.org/blog/index.php?pk=123480&T=1

[TABLE]
[ROW][C]Autocorrelation Function[/C][/ROW]
[ROW][C]Time lag k[/C][C]ACF(k)[/C][C]T-STAT[/C][C]P-value[/C][/ROW]
[ROW][C]1[/C][C]-0.02371[/C][C]-0.2464[/C][C]0.402921[/C][/ROW]
[ROW][C]2[/C][C]0.254678[/C][C]2.6467[/C][C]0.004672[/C][/ROW]
[ROW][C]3[/C][C]0.147838[/C][C]1.5364[/C][C]0.063686[/C][/ROW]
[ROW][C]4[/C][C]0.134067[/C][C]1.3933[/C][C]0.083201[/C][/ROW]
[ROW][C]5[/C][C]0.431859[/C][C]4.488[/C][C]9e-06[/C][/ROW]
[ROW][C]6[/C][C]0.040754[/C][C]0.4235[/C][C]0.336377[/C][/ROW]
[ROW][C]7[/C][C]0.419935[/C][C]4.3641[/C][C]1.5e-05[/C][/ROW]
[ROW][C]8[/C][C]0.178445[/C][C]1.8545[/C][C]0.033201[/C][/ROW]
[ROW][C]9[/C][C]0.136072[/C][C]1.4141[/C][C]0.080104[/C][/ROW]
[ROW][C]10[/C][C]0.184361[/C][C]1.9159[/C][C]0.029008[/C][/ROW]
[ROW][C]11[/C][C]-0.065428[/C][C]-0.6799[/C][C]0.248998[/C][/ROW]
[ROW][C]12[/C][C]0.725451[/C][C]7.5391[/C][C]0[/C][/ROW]
[ROW][C]13[/C][C]-0.028152[/C][C]-0.2926[/C][C]0.385208[/C][/ROW]
[ROW][C]14[/C][C]0.214782[/C][C]2.2321[/C][C]0.013837[/C][/ROW]
[ROW][C]15[/C][C]0.116981[/C][C]1.2157[/C][C]0.113374[/C][/ROW]
[ROW][C]16[/C][C]0.109191[/C][C]1.1347[/C][C]0.129496[/C][/ROW]
[ROW][C]17[/C][C]0.338915[/C][C]3.5221[/C][C]0.000314[/C][/ROW]
[ROW][C]18[/C][C]-0.022882[/C][C]-0.2378[/C][C]0.406246[/C][/ROW]
[ROW][C]19[/C][C]0.317518[/C][C]3.2997[/C][C]0.000656[/C][/ROW]
[ROW][C]20[/C][C]0.121977[/C][C]1.2676[/C][C]0.103829[/C][/ROW]
[ROW][C]21[/C][C]0.059384[/C][C]0.6171[/C][C]0.269222[/C][/ROW]
[ROW][C]22[/C][C]0.107529[/C][C]1.1175[/C][C]0.133135[/C][/ROW]
[ROW][C]23[/C][C]-0.089075[/C][C]-0.9257[/C][C]0.178334[/C][/ROW]
[ROW][C]24[/C][C]0.511233[/C][C]5.3129[/C][C]0[/C][/ROW]
[ROW][C]25[/C][C]-0.049358[/C][C]-0.5129[/C][C]0.30452[/C][/ROW]
[ROW][C]26[/C][C]0.113682[/C][C]1.1814[/C][C]0.120015[/C][/ROW]
[ROW][C]27[/C][C]0.030101[/C][C]0.3128[/C][C]0.377512[/C][/ROW]
[ROW][C]28[/C][C]0.083088[/C][C]0.8635[/C][C]0.194894[/C][/ROW]
[ROW][C]29[/C][C]0.174925[/C][C]1.8179[/C][C]0.035928[/C][/ROW]
[ROW][C]30[/C][C]-0.067202[/C][C]-0.6984[/C][C]0.243219[/C][/ROW]
[ROW][C]31[/C][C]0.181411[/C][C]1.8853[/C][C]0.03104[/C][/ROW]
[ROW][C]32[/C][C]0.072259[/C][C]0.7509[/C][C]0.227163[/C][/ROW]
[ROW][C]33[/C][C]0.020777[/C][C]0.2159[/C][C]0.414728[/C][/ROW]
[ROW][C]34[/C][C]0.00643[/C][C]0.0668[/C][C]0.473424[/C][/ROW]
[ROW][C]35[/C][C]-0.136564[/C][C]-1.4192[/C][C]0.079357[/C][/ROW]
[ROW][C]36[/C][C]0.252493[/C][C]2.624[/C][C]0.004974[/C][/ROW]
[ROW][C]37[/C][C]-0.076709[/C][C]-0.7972[/C][C]0.213547[/C][/ROW]
[ROW][C]38[/C][C]-0.020018[/C][C]-0.208[/C][C]0.417799[/C][/ROW]
[ROW][C]39[/C][C]-0.050737[/C][C]-0.5273[/C][C]0.299542[/C][/ROW]
[ROW][C]40[/C][C]0.020818[/C][C]0.2163[/C][C]0.414563[/C][/ROW]
[ROW][C]41[/C][C]-0.001122[/C][C]-0.0117[/C][C]0.495358[/C][/ROW]
[ROW][C]42[/C][C]-0.108608[/C][C]-1.1287[/C][C]0.130766[/C][/ROW]
[ROW][C]43[/C][C]0.007606[/C][C]0.079[/C][C]0.468571[/C][/ROW]
[ROW][C]44[/C][C]-0.045398[/C][C]-0.4718[/C][C]0.319014[/C][/ROW]
[ROW][C]45[/C][C]-0.062736[/C][C]-0.652[/C][C]0.257903[/C][/ROW]
[ROW][C]46[/C][C]-0.100218[/C][C]-1.0415[/C][C]0.149985[/C][/ROW]
[ROW][C]47[/C][C]-0.151275[/C][C]-1.5721[/C][C]0.059427[/C][/ROW]
[ROW][C]48[/C][C]0.088716[/C][C]0.922[/C][C]0.1793[/C][/ROW]
[/TABLE]
Source: https://freestatistics.org/blog/index.php?pk=123480&T=1

Globally Unique Identifier (entire table): ba.freestatistics.org/blog/index.php?pk=123480&T=1

As an alternative you can also use a QR Code:  

The GUIDs for individual cells are displayed in the table below:

Autocorrelation Function
Time lag kACF(k)T-STATP-value
1-0.02371-0.24640.402921
20.2546782.64670.004672
30.1478381.53640.063686
40.1340671.39330.083201
50.4318594.4889e-06
60.0407540.42350.336377
70.4199354.36411.5e-05
80.1784451.85450.033201
90.1360721.41410.080104
100.1843611.91590.029008
11-0.065428-0.67990.248998
120.7254517.53910
13-0.028152-0.29260.385208
140.2147822.23210.013837
150.1169811.21570.113374
160.1091911.13470.129496
170.3389153.52210.000314
18-0.022882-0.23780.406246
190.3175183.29970.000656
200.1219771.26760.103829
210.0593840.61710.269222
220.1075291.11750.133135
23-0.089075-0.92570.178334
240.5112335.31290
25-0.049358-0.51290.30452
260.1136821.18140.120015
270.0301010.31280.377512
280.0830880.86350.194894
290.1749251.81790.035928
30-0.067202-0.69840.243219
310.1814111.88530.03104
320.0722590.75090.227163
330.0207770.21590.414728
340.006430.06680.473424
35-0.136564-1.41920.079357
360.2524932.6240.004974
37-0.076709-0.79720.213547
38-0.020018-0.2080.417799
39-0.050737-0.52730.299542
400.0208180.21630.414563
41-0.001122-0.01170.495358
42-0.108608-1.12870.130766
430.0076060.0790.468571
44-0.045398-0.47180.319014
45-0.062736-0.6520.257903
46-0.100218-1.04150.149985
47-0.151275-1.57210.059427
480.0887160.9220.1793


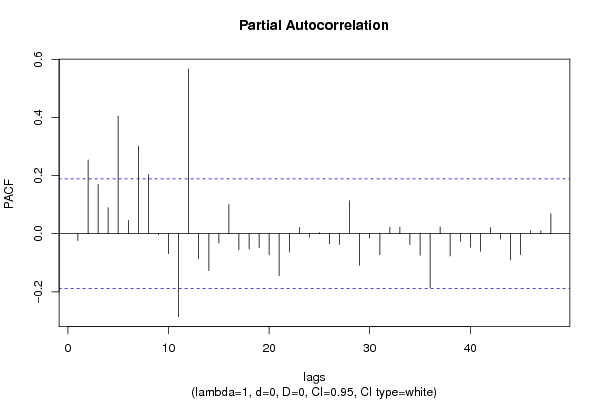
Partial Autocorrelation Function
Time lag kPACF(k)T-STATP-value
1-0.02371-0.24640.402921
20.2542592.64230.004728
30.169411.76060.040572
40.0898110.93330.176362
50.4052774.21182.6e-05
60.0457830.47580.317592
70.3018613.1370.0011
80.2041242.12130.018092
9-0.00354-0.03680.485361
10-0.068706-0.7140.23838
11-0.285669-2.96880.001842
120.5675885.89860
13-0.086367-0.89760.18571
14-0.12663-1.3160.095484
15-0.031115-0.32340.373526
160.1002741.04210.14985
17-0.055209-0.57380.283664
18-0.053005-0.55080.291439
19-0.047449-0.49310.311468
20-0.072322-0.75160.226966
21-0.144245-1.4990.068391
22-0.063038-0.65510.256895
230.0214770.22320.411902
24-0.01128-0.11720.453448
250.0036510.03790.484901
26-0.034293-0.35640.361126
27-0.03624-0.37660.353598
280.1134691.17920.120455
29-0.108947-1.13220.130026
30-0.01515-0.15740.437594
31-0.072107-0.74940.227634
320.0224870.23370.407834
330.0226560.23540.407155
34-0.036996-0.38450.350693
35-0.073745-0.76640.222562
36-0.186687-1.94010.027487
370.0235670.24490.403494
38-0.076328-0.79320.214694
39-0.026516-0.27560.391704
40-0.046535-0.48360.314824
41-0.060903-0.63290.264062
420.021420.22260.412132
43-0.018341-0.19060.424598
44-0.090149-0.93690.175462
45-0.071528-0.74330.229444
460.0102660.10670.457616
470.009980.10370.458793
480.0690360.71740.237324

\begin{tabular}{lllllllll}
\hline
Partial Autocorrelation Function \tabularnewline
Time lag k & PACF(k) & T-STAT & P-value \tabularnewline
1 & -0.02371 & -0.2464 & 0.402921 \tabularnewline
2 & 0.254259 & 2.6423 & 0.004728 \tabularnewline
3 & 0.16941 & 1.7606 & 0.040572 \tabularnewline
4 & 0.089811 & 0.9333 & 0.176362 \tabularnewline
5 & 0.405277 & 4.2118 & 2.6e-05 \tabularnewline
6 & 0.045783 & 0.4758 & 0.317592 \tabularnewline
7 & 0.301861 & 3.137 & 0.0011 \tabularnewline
8 & 0.204124 & 2.1213 & 0.018092 \tabularnewline
9 & -0.00354 & -0.0368 & 0.485361 \tabularnewline
10 & -0.068706 & -0.714 & 0.23838 \tabularnewline
11 & -0.285669 & -2.9688 & 0.001842 \tabularnewline
12 & 0.567588 & 5.8986 & 0 \tabularnewline
13 & -0.086367 & -0.8976 & 0.18571 \tabularnewline
14 & -0.12663 & -1.316 & 0.095484 \tabularnewline
15 & -0.031115 & -0.3234 & 0.373526 \tabularnewline
16 & 0.100274 & 1.0421 & 0.14985 \tabularnewline
17 & -0.055209 & -0.5738 & 0.283664 \tabularnewline
18 & -0.053005 & -0.5508 & 0.291439 \tabularnewline
19 & -0.047449 & -0.4931 & 0.311468 \tabularnewline
20 & -0.072322 & -0.7516 & 0.226966 \tabularnewline
21 & -0.144245 & -1.499 & 0.068391 \tabularnewline
22 & -0.063038 & -0.6551 & 0.256895 \tabularnewline
23 & 0.021477 & 0.2232 & 0.411902 \tabularnewline
24 & -0.01128 & -0.1172 & 0.453448 \tabularnewline
25 & 0.003651 & 0.0379 & 0.484901 \tabularnewline
26 & -0.034293 & -0.3564 & 0.361126 \tabularnewline
27 & -0.03624 & -0.3766 & 0.353598 \tabularnewline
28 & 0.113469 & 1.1792 & 0.120455 \tabularnewline
29 & -0.108947 & -1.1322 & 0.130026 \tabularnewline
30 & -0.01515 & -0.1574 & 0.437594 \tabularnewline
31 & -0.072107 & -0.7494 & 0.227634 \tabularnewline
32 & 0.022487 & 0.2337 & 0.407834 \tabularnewline
33 & 0.022656 & 0.2354 & 0.407155 \tabularnewline
34 & -0.036996 & -0.3845 & 0.350693 \tabularnewline
35 & -0.073745 & -0.7664 & 0.222562 \tabularnewline
36 & -0.186687 & -1.9401 & 0.027487 \tabularnewline
37 & 0.023567 & 0.2449 & 0.403494 \tabularnewline
38 & -0.076328 & -0.7932 & 0.214694 \tabularnewline
39 & -0.026516 & -0.2756 & 0.391704 \tabularnewline
40 & -0.046535 & -0.4836 & 0.314824 \tabularnewline
41 & -0.060903 & -0.6329 & 0.264062 \tabularnewline
42 & 0.02142 & 0.2226 & 0.412132 \tabularnewline
43 & -0.018341 & -0.1906 & 0.424598 \tabularnewline
44 & -0.090149 & -0.9369 & 0.175462 \tabularnewline
45 & -0.071528 & -0.7433 & 0.229444 \tabularnewline
46 & 0.010266 & 0.1067 & 0.457616 \tabularnewline
47 & 0.00998 & 0.1037 & 0.458793 \tabularnewline
48 & 0.069036 & 0.7174 & 0.237324 \tabularnewline
\hline
\end{tabular}
%Source: https://freestatistics.org/blog/index.php?pk=123480&T=2

[TABLE]
[ROW][C]Partial Autocorrelation Function[/C][/ROW]
[ROW][C]Time lag k[/C][C]PACF(k)[/C][C]T-STAT[/C][C]P-value[/C][/ROW]
[ROW][C]1[/C][C]-0.02371[/C][C]-0.2464[/C][C]0.402921[/C][/ROW]
[ROW][C]2[/C][C]0.254259[/C][C]2.6423[/C][C]0.004728[/C][/ROW]
[ROW][C]3[/C][C]0.16941[/C][C]1.7606[/C][C]0.040572[/C][/ROW]
[ROW][C]4[/C][C]0.089811[/C][C]0.9333[/C][C]0.176362[/C][/ROW]
[ROW][C]5[/C][C]0.405277[/C][C]4.2118[/C][C]2.6e-05[/C][/ROW]
[ROW][C]6[/C][C]0.045783[/C][C]0.4758[/C][C]0.317592[/C][/ROW]
[ROW][C]7[/C][C]0.301861[/C][C]3.137[/C][C]0.0011[/C][/ROW]
[ROW][C]8[/C][C]0.204124[/C][C]2.1213[/C][C]0.018092[/C][/ROW]
[ROW][C]9[/C][C]-0.00354[/C][C]-0.0368[/C][C]0.485361[/C][/ROW]
[ROW][C]10[/C][C]-0.068706[/C][C]-0.714[/C][C]0.23838[/C][/ROW]
[ROW][C]11[/C][C]-0.285669[/C][C]-2.9688[/C][C]0.001842[/C][/ROW]
[ROW][C]12[/C][C]0.567588[/C][C]5.8986[/C][C]0[/C][/ROW]
[ROW][C]13[/C][C]-0.086367[/C][C]-0.8976[/C][C]0.18571[/C][/ROW]
[ROW][C]14[/C][C]-0.12663[/C][C]-1.316[/C][C]0.095484[/C][/ROW]
[ROW][C]15[/C][C]-0.031115[/C][C]-0.3234[/C][C]0.373526[/C][/ROW]
[ROW][C]16[/C][C]0.100274[/C][C]1.0421[/C][C]0.14985[/C][/ROW]
[ROW][C]17[/C][C]-0.055209[/C][C]-0.5738[/C][C]0.283664[/C][/ROW]
[ROW][C]18[/C][C]-0.053005[/C][C]-0.5508[/C][C]0.291439[/C][/ROW]
[ROW][C]19[/C][C]-0.047449[/C][C]-0.4931[/C][C]0.311468[/C][/ROW]
[ROW][C]20[/C][C]-0.072322[/C][C]-0.7516[/C][C]0.226966[/C][/ROW]
[ROW][C]21[/C][C]-0.144245[/C][C]-1.499[/C][C]0.068391[/C][/ROW]
[ROW][C]22[/C][C]-0.063038[/C][C]-0.6551[/C][C]0.256895[/C][/ROW]
[ROW][C]23[/C][C]0.021477[/C][C]0.2232[/C][C]0.411902[/C][/ROW]
[ROW][C]24[/C][C]-0.01128[/C][C]-0.1172[/C][C]0.453448[/C][/ROW]
[ROW][C]25[/C][C]0.003651[/C][C]0.0379[/C][C]0.484901[/C][/ROW]
[ROW][C]26[/C][C]-0.034293[/C][C]-0.3564[/C][C]0.361126[/C][/ROW]
[ROW][C]27[/C][C]-0.03624[/C][C]-0.3766[/C][C]0.353598[/C][/ROW]
[ROW][C]28[/C][C]0.113469[/C][C]1.1792[/C][C]0.120455[/C][/ROW]
[ROW][C]29[/C][C]-0.108947[/C][C]-1.1322[/C][C]0.130026[/C][/ROW]
[ROW][C]30[/C][C]-0.01515[/C][C]-0.1574[/C][C]0.437594[/C][/ROW]
[ROW][C]31[/C][C]-0.072107[/C][C]-0.7494[/C][C]0.227634[/C][/ROW]
[ROW][C]32[/C][C]0.022487[/C][C]0.2337[/C][C]0.407834[/C][/ROW]
[ROW][C]33[/C][C]0.022656[/C][C]0.2354[/C][C]0.407155[/C][/ROW]
[ROW][C]34[/C][C]-0.036996[/C][C]-0.3845[/C][C]0.350693[/C][/ROW]
[ROW][C]35[/C][C]-0.073745[/C][C]-0.7664[/C][C]0.222562[/C][/ROW]
[ROW][C]36[/C][C]-0.186687[/C][C]-1.9401[/C][C]0.027487[/C][/ROW]
[ROW][C]37[/C][C]0.023567[/C][C]0.2449[/C][C]0.403494[/C][/ROW]
[ROW][C]38[/C][C]-0.076328[/C][C]-0.7932[/C][C]0.214694[/C][/ROW]
[ROW][C]39[/C][C]-0.026516[/C][C]-0.2756[/C][C]0.391704[/C][/ROW]
[ROW][C]40[/C][C]-0.046535[/C][C]-0.4836[/C][C]0.314824[/C][/ROW]
[ROW][C]41[/C][C]-0.060903[/C][C]-0.6329[/C][C]0.264062[/C][/ROW]
[ROW][C]42[/C][C]0.02142[/C][C]0.2226[/C][C]0.412132[/C][/ROW]
[ROW][C]43[/C][C]-0.018341[/C][C]-0.1906[/C][C]0.424598[/C][/ROW]
[ROW][C]44[/C][C]-0.090149[/C][C]-0.9369[/C][C]0.175462[/C][/ROW]
[ROW][C]45[/C][C]-0.071528[/C][C]-0.7433[/C][C]0.229444[/C][/ROW]
[ROW][C]46[/C][C]0.010266[/C][C]0.1067[/C][C]0.457616[/C][/ROW]
[ROW][C]47[/C][C]0.00998[/C][C]0.1037[/C][C]0.458793[/C][/ROW]
[ROW][C]48[/C][C]0.069036[/C][C]0.7174[/C][C]0.237324[/C][/ROW]
[/TABLE]
Source: https://freestatistics.org/blog/index.php?pk=123480&T=2

Globally Unique Identifier (entire table): ba.freestatistics.org/blog/index.php?pk=123480&T=2

As an alternative you can also use a QR Code:  

The GUIDs for individual cells are displayed in the table below:

Partial Autocorrelation Function
Time lag kPACF(k)T-STATP-value
1-0.02371-0.24640.402921
20.2542592.64230.004728
30.169411.76060.040572
40.0898110.93330.176362
50.4052774.21182.6e-05
60.0457830.47580.317592
70.3018613.1370.0011
80.2041242.12130.018092
9-0.00354-0.03680.485361
10-0.068706-0.7140.23838
11-0.285669-2.96880.001842
120.5675885.89860
13-0.086367-0.89760.18571
14-0.12663-1.3160.095484
15-0.031115-0.32340.373526
160.1002741.04210.14985
17-0.055209-0.57380.283664
18-0.053005-0.55080.291439
19-0.047449-0.49310.311468
20-0.072322-0.75160.226966
21-0.144245-1.4990.068391
22-0.063038-0.65510.256895
230.0214770.22320.411902
24-0.01128-0.11720.453448
250.0036510.03790.484901
26-0.034293-0.35640.361126
27-0.03624-0.37660.353598
280.1134691.17920.120455
29-0.108947-1.13220.130026
30-0.01515-0.15740.437594
31-0.072107-0.74940.227634
320.0224870.23370.407834
330.0226560.23540.407155
34-0.036996-0.38450.350693
35-0.073745-0.76640.222562
36-0.186687-1.94010.027487
370.0235670.24490.403494
38-0.076328-0.79320.214694
39-0.026516-0.27560.391704
40-0.046535-0.48360.314824
41-0.060903-0.63290.264062
420.021420.22260.412132
43-0.018341-0.19060.424598
44-0.090149-0.93690.175462
45-0.071528-0.74330.229444
460.0102660.10670.457616
470.009980.10370.458793
480.0690360.71740.237324


Parameters (Session):
par1 = 48 ; par2 = 1 ; par3 = 0 ; par4 = 0 ; par5 = 12 ; par6 = White Noise ; par7 = 0.95 ;
Parameters (R input):
par1 = 48 ; par2 = 1 ; par3 = 0 ; par4 = 0 ; par5 = 12 ; par6 = White Noise ; par7 = 0.95 ; par8 = ;
R code (references can be found in the software module):
if (par1 == 'Default') {
par1 = 10*log10(length(x))
} else {
par1 <- as.numeric(par1)
}
par2 <- as.numeric(par2)
par3 <- as.numeric(par3)
par4 <- as.numeric(par4)
par5 <- as.numeric(par5)
if (par6 == 'White Noise') par6 <- 'white' else par6 <- 'ma'
par7 <- as.numeric(par7)
if (par8 != '') par8 <- as.numeric(par8)
ox <- x
if (par8 == '') {
if (par2 == 0) {
x <- log(x)
} else {
x <- (x ^ par2 - 1) / par2
}
} else {
x <- log(x,base=par8)
}
if (par3 > 0) x <- diff(x,lag=1,difference=par3)
if (par4 > 0) x <- diff(x,lag=par5,difference=par4)
bitmap(file='picts.png')
op <- par(mfrow=c(2,1))
plot(ox,type='l',main='Original Time Series',xlab='time',ylab='value')
if (par8=='') {
mytitle <- paste('Working Time Series (lambda=',par2,', d=',par3,', D=',par4,')',sep='')
mysub <- paste('(lambda=',par2,', d=',par3,', D=',par4,', CI=', par7, ', CI type=',par6,')',sep='')
} else {
mytitle <- paste('Working Time Series (base=',par8,', d=',par3,', D=',par4,')',sep='')
mysub <- paste('(base=',par8,', d=',par3,', D=',par4,', CI=', par7, ', CI type=',par6,')',sep='')
}
plot(x,type='l', main=mytitle,xlab='time',ylab='value')
par(op)
dev.off()
bitmap(file='pic1.png')
racf <- acf(x, par1, main='Autocorrelation', xlab='time lag', ylab='ACF', ci.type=par6, ci=par7, sub=mysub)
dev.off()
bitmap(file='pic2.png')
rpacf <- pacf(x,par1,main='Partial Autocorrelation',xlab='lags',ylab='PACF',sub=mysub)
dev.off()
(myacf <- c(racf$acf))
(mypacf <- c(rpacf$acf))
lengthx <- length(x)
sqrtn <- sqrt(lengthx)
load(file='createtable')
a<-table.start()
a<-table.row.start(a)
a<-table.element(a,'Autocorrelation Function',4,TRUE)
a<-table.row.end(a)
a<-table.row.start(a)
a<-table.element(a,'Time lag k',header=TRUE)
a<-table.element(a,hyperlink('basics.htm','ACF(k)','click here for more information about the Autocorrelation Function'),header=TRUE)
a<-table.element(a,'T-STAT',header=TRUE)
a<-table.element(a,'P-value',header=TRUE)
a<-table.row.end(a)
for (i in 2:(par1+1)) {
a<-table.row.start(a)
a<-table.element(a,i-1,header=TRUE)
a<-table.element(a,round(myacf[i],6))
mytstat <- myacf[i]*sqrtn
a<-table.element(a,round(mytstat,4))
a<-table.element(a,round(1-pt(abs(mytstat),lengthx),6))
a<-table.row.end(a)
}
a<-table.end(a)
table.save(a,file='mytable.tab')
a<-table.start()
a<-table.row.start(a)
a<-table.element(a,'Partial Autocorrelation Function',4,TRUE)
a<-table.row.end(a)
a<-table.row.start(a)
a<-table.element(a,'Time lag k',header=TRUE)
a<-table.element(a,hyperlink('basics.htm','PACF(k)','click here for more information about the Partial Autocorrelation Function'),header=TRUE)
a<-table.element(a,'T-STAT',header=TRUE)
a<-table.element(a,'P-value',header=TRUE)
a<-table.row.end(a)
for (i in 1:par1) {
a<-table.row.start(a)
a<-table.element(a,i,header=TRUE)
a<-table.element(a,round(mypacf[i],6))
mytstat <- mypacf[i]*sqrtn
a<-table.element(a,round(mytstat,4))
a<-table.element(a,round(1-pt(abs(mytstat),lengthx),6))
a<-table.row.end(a)
}
a<-table.end(a)
table.save(a,file='mytable1.tab')