Free Statistics

of Irreproducible Research!

Author's title

Author*Unverified author*
R Software Modulerwasp_smp.wasp
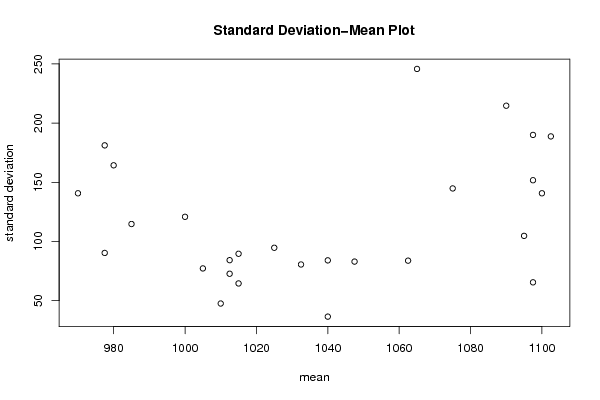
Title produced by softwareStandard Deviation-Mean Plot
Date of computationFri, 05 Aug 2011 13:47:33 -0400
Cite this page as followsStatistical Computations at FreeStatistics.org, Office for Research Development and Education, URL https://freestatistics.org/blog/index.php?v=date/2011/Aug/05/t13125665081lnmxxhn7c0h2zx.htm/, Retrieved Tue, 14 May 2024 10:26:00 +0000
Statistical Computations at FreeStatistics.org, Office for Research Development and Education, URL https://freestatistics.org/blog/index.php?pk=123431, Retrieved Tue, 14 May 2024 10:26:00 +0000
QR Codes:

Original text written by user:
IsPrivate?No (this computation is public)
User-defined keywordsVan Vlaenderen Lynn
Estimated Impact182
Family? (F = Feedback message, R = changed R code, M = changed R Module, P = changed Parameters, D = changed Data)
-       [Standard Deviation-Mean Plot] [tijdreeksB-stap21] [2011-08-05 17:47:33] [d08a5fa9e4c562ec79e796d78c067f4f] [Current]
Feedback Forum

Post a new message
Dataseries X:
960
1160
1040
1030
1080
1020
1000
1060
1000
980
980
1080
980
1290
1030
1000
1130
1030
900
1040
1080
1010
890
1080
950
1310
1060
1070
1150
1060
950
1090
1080
1040
900
1000
1020
1250
1060
1050
1180
1100
1020
1090
1020
960
860
1070
1040
1310
1040
1010
1130
1030
930
1070
990
970
850
1130
1060
1380
1000
970
1080
940
960
1070
1010
1020
750
1140
1040
1420
900
900
1090
950
930
1080
1000
1010
770
1100
1100
1390
930
940
1100
1030
920
1080
1000
1070
830
1100
1170
1330
980
910
1030
970
960
1100
960
1080
730
1140


Summary of computational transaction
Raw Inputview raw input (R code)
Raw Outputview raw output of R engine
Computing time1 seconds
R Server'AstonUniversity' @ aston.wessa.net

\begin{tabular}{lllllllll}
\hline
Summary of computational transaction \tabularnewline
Raw Input & view raw input (R code)  \tabularnewline
Raw Output & view raw output of R engine  \tabularnewline
Computing time & 1 seconds \tabularnewline
R Server & 'AstonUniversity' @ aston.wessa.net \tabularnewline
\hline
\end{tabular}
%Source: https://freestatistics.org/blog/index.php?pk=123431&T=0

[TABLE]
[ROW][C]Summary of computational transaction[/C][/ROW]
[ROW][C]Raw Input[/C][C]view raw input (R code) [/C][/ROW]
[ROW][C]Raw Output[/C][C]view raw output of R engine [/C][/ROW]
[ROW][C]Computing time[/C][C]1 seconds[/C][/ROW]
[ROW][C]R Server[/C][C]'AstonUniversity' @ aston.wessa.net[/C][/ROW]
[/TABLE]
Source: https://freestatistics.org/blog/index.php?pk=123431&T=0

Globally Unique Identifier (entire table): ba.freestatistics.org/blog/index.php?pk=123431&T=0

As an alternative you can also use a QR Code:  

The GUIDs for individual cells are displayed in the table below:

Summary of computational transaction
Raw Inputview raw input (R code)
Raw Outputview raw output of R engine
Computing time1 seconds
R Server'AstonUniversity' @ aston.wessa.net


Standard Deviation-Mean Plot
SectionMeanStandard DeviationRange
11047.583.0160627027485200
2104036.514837167011180
3101047.6095228569523100
41075144.798710859823310
5102594.6924847422786230
6101589.628864398325190
71097.5151.739909054935360
81062.583.815273071201200
9100577.2442015083764180
101095104.721853816033230
111097.565.5108133567785160
12977.590.3234926989282210
131100140.712472794703300
14104084.0634680861233200
15985114.74609652039280
161102.5188.745860881769410
171012.572.7438428093173140
18980164.31676725155390
191065245.696289484938520
201012.584.2120339777319160
21970140.712472794703330
221090214.631467093403460
231032.580.5708797684788180
241000120.830459735946270
251097.5189.978068909721420
26101564.5497224367903140
27977.5181.176709319934410

\begin{tabular}{lllllllll}
\hline
Standard Deviation-Mean Plot \tabularnewline
Section & Mean & Standard Deviation & Range \tabularnewline
1 & 1047.5 & 83.0160627027485 & 200 \tabularnewline
2 & 1040 & 36.5148371670111 & 80 \tabularnewline
3 & 1010 & 47.6095228569523 & 100 \tabularnewline
4 & 1075 & 144.798710859823 & 310 \tabularnewline
5 & 1025 & 94.6924847422786 & 230 \tabularnewline
6 & 1015 & 89.628864398325 & 190 \tabularnewline
7 & 1097.5 & 151.739909054935 & 360 \tabularnewline
8 & 1062.5 & 83.815273071201 & 200 \tabularnewline
9 & 1005 & 77.2442015083764 & 180 \tabularnewline
10 & 1095 & 104.721853816033 & 230 \tabularnewline
11 & 1097.5 & 65.5108133567785 & 160 \tabularnewline
12 & 977.5 & 90.3234926989282 & 210 \tabularnewline
13 & 1100 & 140.712472794703 & 300 \tabularnewline
14 & 1040 & 84.0634680861233 & 200 \tabularnewline
15 & 985 & 114.74609652039 & 280 \tabularnewline
16 & 1102.5 & 188.745860881769 & 410 \tabularnewline
17 & 1012.5 & 72.7438428093173 & 140 \tabularnewline
18 & 980 & 164.31676725155 & 390 \tabularnewline
19 & 1065 & 245.696289484938 & 520 \tabularnewline
20 & 1012.5 & 84.2120339777319 & 160 \tabularnewline
21 & 970 & 140.712472794703 & 330 \tabularnewline
22 & 1090 & 214.631467093403 & 460 \tabularnewline
23 & 1032.5 & 80.5708797684788 & 180 \tabularnewline
24 & 1000 & 120.830459735946 & 270 \tabularnewline
25 & 1097.5 & 189.978068909721 & 420 \tabularnewline
26 & 1015 & 64.5497224367903 & 140 \tabularnewline
27 & 977.5 & 181.176709319934 & 410 \tabularnewline
\hline
\end{tabular}
%Source: https://freestatistics.org/blog/index.php?pk=123431&T=1

[TABLE]
[ROW][C]Standard Deviation-Mean Plot[/C][/ROW]
[ROW][C]Section[/C][C]Mean[/C][C]Standard Deviation[/C][C]Range[/C][/ROW]
[ROW][C]1[/C][C]1047.5[/C][C]83.0160627027485[/C][C]200[/C][/ROW]
[ROW][C]2[/C][C]1040[/C][C]36.5148371670111[/C][C]80[/C][/ROW]
[ROW][C]3[/C][C]1010[/C][C]47.6095228569523[/C][C]100[/C][/ROW]
[ROW][C]4[/C][C]1075[/C][C]144.798710859823[/C][C]310[/C][/ROW]
[ROW][C]5[/C][C]1025[/C][C]94.6924847422786[/C][C]230[/C][/ROW]
[ROW][C]6[/C][C]1015[/C][C]89.628864398325[/C][C]190[/C][/ROW]
[ROW][C]7[/C][C]1097.5[/C][C]151.739909054935[/C][C]360[/C][/ROW]
[ROW][C]8[/C][C]1062.5[/C][C]83.815273071201[/C][C]200[/C][/ROW]
[ROW][C]9[/C][C]1005[/C][C]77.2442015083764[/C][C]180[/C][/ROW]
[ROW][C]10[/C][C]1095[/C][C]104.721853816033[/C][C]230[/C][/ROW]
[ROW][C]11[/C][C]1097.5[/C][C]65.5108133567785[/C][C]160[/C][/ROW]
[ROW][C]12[/C][C]977.5[/C][C]90.3234926989282[/C][C]210[/C][/ROW]
[ROW][C]13[/C][C]1100[/C][C]140.712472794703[/C][C]300[/C][/ROW]
[ROW][C]14[/C][C]1040[/C][C]84.0634680861233[/C][C]200[/C][/ROW]
[ROW][C]15[/C][C]985[/C][C]114.74609652039[/C][C]280[/C][/ROW]
[ROW][C]16[/C][C]1102.5[/C][C]188.745860881769[/C][C]410[/C][/ROW]
[ROW][C]17[/C][C]1012.5[/C][C]72.7438428093173[/C][C]140[/C][/ROW]
[ROW][C]18[/C][C]980[/C][C]164.31676725155[/C][C]390[/C][/ROW]
[ROW][C]19[/C][C]1065[/C][C]245.696289484938[/C][C]520[/C][/ROW]
[ROW][C]20[/C][C]1012.5[/C][C]84.2120339777319[/C][C]160[/C][/ROW]
[ROW][C]21[/C][C]970[/C][C]140.712472794703[/C][C]330[/C][/ROW]
[ROW][C]22[/C][C]1090[/C][C]214.631467093403[/C][C]460[/C][/ROW]
[ROW][C]23[/C][C]1032.5[/C][C]80.5708797684788[/C][C]180[/C][/ROW]
[ROW][C]24[/C][C]1000[/C][C]120.830459735946[/C][C]270[/C][/ROW]
[ROW][C]25[/C][C]1097.5[/C][C]189.978068909721[/C][C]420[/C][/ROW]
[ROW][C]26[/C][C]1015[/C][C]64.5497224367903[/C][C]140[/C][/ROW]
[ROW][C]27[/C][C]977.5[/C][C]181.176709319934[/C][C]410[/C][/ROW]
[/TABLE]
Source: https://freestatistics.org/blog/index.php?pk=123431&T=1

Globally Unique Identifier (entire table): ba.freestatistics.org/blog/index.php?pk=123431&T=1

As an alternative you can also use a QR Code:  

The GUIDs for individual cells are displayed in the table below:

Standard Deviation-Mean Plot
SectionMeanStandard DeviationRange
11047.583.0160627027485200
2104036.514837167011180
3101047.6095228569523100
41075144.798710859823310
5102594.6924847422786230
6101589.628864398325190
71097.5151.739909054935360
81062.583.815273071201200
9100577.2442015083764180
101095104.721853816033230
111097.565.5108133567785160
12977.590.3234926989282210
131100140.712472794703300
14104084.0634680861233200
15985114.74609652039280
161102.5188.745860881769410
171012.572.7438428093173140
18980164.31676725155390
191065245.696289484938520
201012.584.2120339777319160
21970140.712472794703330
221090214.631467093403460
231032.580.5708797684788180
241000120.830459735946270
251097.5189.978068909721420
26101564.5497224367903140
27977.5181.176709319934410


Regression: S.E.(k) = alpha + beta * Mean(k)
alpha-243.893393640739
beta0.347602328655743
S.D.0.229994627284165
T-STAT1.51134977699401
p-value0.143237708904028

\begin{tabular}{lllllllll}
\hline
Regression: S.E.(k) = alpha + beta * Mean(k) \tabularnewline
alpha & -243.893393640739 \tabularnewline
beta & 0.347602328655743 \tabularnewline
S.D. & 0.229994627284165 \tabularnewline
T-STAT & 1.51134977699401 \tabularnewline
p-value & 0.143237708904028 \tabularnewline
\hline
\end{tabular}
%Source: https://freestatistics.org/blog/index.php?pk=123431&T=2

[TABLE]
[ROW][C]Regression: S.E.(k) = alpha + beta * Mean(k)[/C][/ROW]
[ROW][C]alpha[/C][C]-243.893393640739[/C][/ROW]
[ROW][C]beta[/C][C]0.347602328655743[/C][/ROW]
[ROW][C]S.D.[/C][C]0.229994627284165[/C][/ROW]
[ROW][C]T-STAT[/C][C]1.51134977699401[/C][/ROW]
[ROW][C]p-value[/C][C]0.143237708904028[/C][/ROW]
[/TABLE]
Source: https://freestatistics.org/blog/index.php?pk=123431&T=2

Globally Unique Identifier (entire table): ba.freestatistics.org/blog/index.php?pk=123431&T=2

As an alternative you can also use a QR Code:  

The GUIDs for individual cells are displayed in the table below:

Regression: S.E.(k) = alpha + beta * Mean(k)
alpha-243.893393640739
beta0.347602328655743
S.D.0.229994627284165
T-STAT1.51134977699401
p-value0.143237708904028


Regression: ln S.E.(k) = alpha + beta * ln Mean(k)
alpha-13.1506159899236
beta2.56489933111417
S.D.2.11448219036464
T-STAT1.21301533907545
p-value0.236461567950054
Lambda-1.56489933111417

\begin{tabular}{lllllllll}
\hline
Regression: ln S.E.(k) = alpha + beta * ln Mean(k) \tabularnewline
alpha & -13.1506159899236 \tabularnewline
beta & 2.56489933111417 \tabularnewline
S.D. & 2.11448219036464 \tabularnewline
T-STAT & 1.21301533907545 \tabularnewline
p-value & 0.236461567950054 \tabularnewline
Lambda & -1.56489933111417 \tabularnewline
\hline
\end{tabular}
%Source: https://freestatistics.org/blog/index.php?pk=123431&T=3

[TABLE]
[ROW][C]Regression: ln S.E.(k) = alpha + beta * ln Mean(k)[/C][/ROW]
[ROW][C]alpha[/C][C]-13.1506159899236[/C][/ROW]
[ROW][C]beta[/C][C]2.56489933111417[/C][/ROW]
[ROW][C]S.D.[/C][C]2.11448219036464[/C][/ROW]
[ROW][C]T-STAT[/C][C]1.21301533907545[/C][/ROW]
[ROW][C]p-value[/C][C]0.236461567950054[/C][/ROW]
[ROW][C]Lambda[/C][C]-1.56489933111417[/C][/ROW]
[/TABLE]
Source: https://freestatistics.org/blog/index.php?pk=123431&T=3

Globally Unique Identifier (entire table): ba.freestatistics.org/blog/index.php?pk=123431&T=3

As an alternative you can also use a QR Code:  

The GUIDs for individual cells are displayed in the table below:

Regression: ln S.E.(k) = alpha + beta * ln Mean(k)
alpha-13.1506159899236
beta2.56489933111417
S.D.2.11448219036464
T-STAT1.21301533907545
p-value0.236461567950054
Lambda-1.56489933111417


Parameters (Session):
par1 = 4 ;
Parameters (R input):
par1 = 4 ;
R code (references can be found in the software module):
par1 <- as.numeric(par1)
(n <- length(x))
(np <- floor(n / par1))
arr <- array(NA,dim=c(par1,np))
j <- 0
k <- 1
for (i in 1:(np*par1))
{
j = j + 1
arr[j,k] <- x[i]
if (j == par1) {
j = 0
k=k+1
}
}
arr
arr.mean <- array(NA,dim=np)
arr.sd <- array(NA,dim=np)
arr.range <- array(NA,dim=np)
for (j in 1:np)
{
arr.mean[j] <- mean(arr[,j],na.rm=TRUE)
arr.sd[j] <- sd(arr[,j],na.rm=TRUE)
arr.range[j] <- max(arr[,j],na.rm=TRUE) - min(arr[,j],na.rm=TRUE)
}
arr.mean
arr.sd
arr.range
(lm1 <- lm(arr.sd~arr.mean))
(lnlm1 <- lm(log(arr.sd)~log(arr.mean)))
(lm2 <- lm(arr.range~arr.mean))
bitmap(file='test1.png')
plot(arr.mean,arr.sd,main='Standard Deviation-Mean Plot',xlab='mean',ylab='standard deviation')
dev.off()
bitmap(file='test2.png')
plot(arr.mean,arr.range,main='Range-Mean Plot',xlab='mean',ylab='range')
dev.off()
load(file='createtable')
a<-table.start()
a<-table.row.start(a)
a<-table.element(a,'Standard Deviation-Mean Plot',4,TRUE)
a<-table.row.end(a)
a<-table.row.start(a)
a<-table.element(a,'Section',header=TRUE)
a<-table.element(a,'Mean',header=TRUE)
a<-table.element(a,'Standard Deviation',header=TRUE)
a<-table.element(a,'Range',header=TRUE)
a<-table.row.end(a)
for (j in 1:np) {
a<-table.row.start(a)
a<-table.element(a,j,header=TRUE)
a<-table.element(a,arr.mean[j])
a<-table.element(a,arr.sd[j] )
a<-table.element(a,arr.range[j] )
a<-table.row.end(a)
}
a<-table.end(a)
table.save(a,file='mytable.tab')
a<-table.start()
a<-table.row.start(a)
a<-table.element(a,'Regression: S.E.(k) = alpha + beta * Mean(k)',2,TRUE)
a<-table.row.end(a)
a<-table.row.start(a)
a<-table.element(a,'alpha',header=TRUE)
a<-table.element(a,lm1$coefficients[[1]])
a<-table.row.end(a)
a<-table.row.start(a)
a<-table.element(a,'beta',header=TRUE)
a<-table.element(a,lm1$coefficients[[2]])
a<-table.row.end(a)
a<-table.row.start(a)
a<-table.element(a,'S.D.',header=TRUE)
a<-table.element(a,summary(lm1)$coefficients[2,2])
a<-table.row.end(a)
a<-table.row.start(a)
a<-table.element(a,'T-STAT',header=TRUE)
a<-table.element(a,summary(lm1)$coefficients[2,3])
a<-table.row.end(a)
a<-table.row.start(a)
a<-table.element(a,'p-value',header=TRUE)
a<-table.element(a,summary(lm1)$coefficients[2,4])
a<-table.row.end(a)
a<-table.end(a)
table.save(a,file='mytable1.tab')
a<-table.start()
a<-table.row.start(a)
a<-table.element(a,'Regression: ln S.E.(k) = alpha + beta * ln Mean(k)',2,TRUE)
a<-table.row.end(a)
a<-table.row.start(a)
a<-table.element(a,'alpha',header=TRUE)
a<-table.element(a,lnlm1$coefficients[[1]])
a<-table.row.end(a)
a<-table.row.start(a)
a<-table.element(a,'beta',header=TRUE)
a<-table.element(a,lnlm1$coefficients[[2]])
a<-table.row.end(a)
a<-table.row.start(a)
a<-table.element(a,'S.D.',header=TRUE)
a<-table.element(a,summary(lnlm1)$coefficients[2,2])
a<-table.row.end(a)
a<-table.row.start(a)
a<-table.element(a,'T-STAT',header=TRUE)
a<-table.element(a,summary(lnlm1)$coefficients[2,3])
a<-table.row.end(a)
a<-table.row.start(a)
a<-table.element(a,'p-value',header=TRUE)
a<-table.element(a,summary(lnlm1)$coefficients[2,4])
a<-table.row.end(a)
a<-table.row.start(a)
a<-table.element(a,'Lambda',header=TRUE)
a<-table.element(a,1-lnlm1$coefficients[[2]])
a<-table.row.end(a)
a<-table.end(a)
table.save(a,file='mytable2.tab')