Free Statistics

of Irreproducible Research!

Author's title

Author*Unverified author*
R Software Modulerwasp_autocorrelation.wasp
Title produced by software(Partial) Autocorrelation Function
Date of computationFri, 05 Aug 2011 13:15:20 -0400
Cite this page as followsStatistical Computations at FreeStatistics.org, Office for Research Development and Education, URL https://freestatistics.org/blog/index.php?v=date/2011/Aug/05/t13125646150p3bwfc9hexhemp.htm/, Retrieved Tue, 14 May 2024 18:05:24 +0000
Statistical Computations at FreeStatistics.org, Office for Research Development and Education, URL https://freestatistics.org/blog/index.php?pk=123429, Retrieved Tue, 14 May 2024 18:05:24 +0000
QR Codes:

Original text written by user:
IsPrivate?No (this computation is public)
User-defined keywordsVan Vlaenderen Lynn
Estimated Impact173
Family? (F = Feedback message, R = changed R code, M = changed R Module, P = changed Parameters, D = changed Data)
-       [(Partial) Autocorrelation Function] [tijdreeksB-stap18] [2011-08-05 17:15:20] [d08a5fa9e4c562ec79e796d78c067f4f] [Current]
Feedback Forum

Post a new message
Dataseries X:
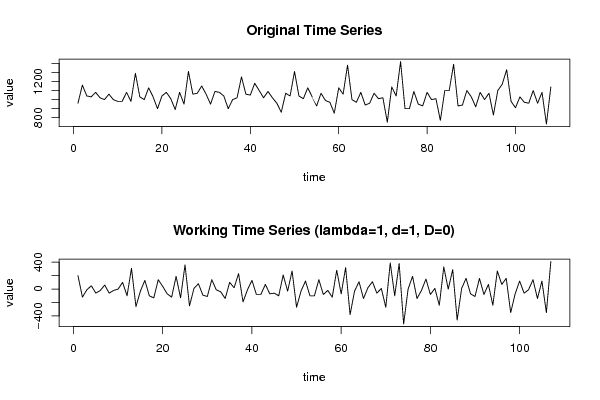
960
1160
1040
1030
1080
1020
1000
1060
1000
980
980
1080
980
1290
1030
1000
1130
1030
900
1040
1080
1010
890
1080
950
1310
1060
1070
1150
1060
950
1090
1080
1040
900
1000
1020
1250
1060
1050
1180
1100
1020
1090
1020
960
860
1070
1040
1310
1040
1010
1130
1030
930
1070
990
970
850
1130
1060
1380
1000
970
1080
940
960
1070
1010
1020
750
1140
1040
1420
900
900
1090
950
930
1080
1000
1010
770
1100
1100
1390
930
940
1100
1030
920
1080
1000
1070
830
1100
1170
1330
980
910
1030
970
960
1100
960
1080
730
1140


Summary of computational transaction
Raw Inputview raw input (R code)
Raw Outputview raw output of R engine
Computing time2 seconds
R Server'George Udny Yule' @ yule.wessa.net

\begin{tabular}{lllllllll}
\hline
Summary of computational transaction \tabularnewline
Raw Input & view raw input (R code)  \tabularnewline
Raw Output & view raw output of R engine  \tabularnewline
Computing time & 2 seconds \tabularnewline
R Server & 'George Udny Yule' @ yule.wessa.net \tabularnewline
\hline
\end{tabular}
%Source: https://freestatistics.org/blog/index.php?pk=123429&T=0

[TABLE]
[ROW][C]Summary of computational transaction[/C][/ROW]
[ROW][C]Raw Input[/C][C]view raw input (R code) [/C][/ROW]
[ROW][C]Raw Output[/C][C]view raw output of R engine [/C][/ROW]
[ROW][C]Computing time[/C][C]2 seconds[/C][/ROW]
[ROW][C]R Server[/C][C]'George Udny Yule' @ yule.wessa.net[/C][/ROW]
[/TABLE]
Source: https://freestatistics.org/blog/index.php?pk=123429&T=0

Globally Unique Identifier (entire table): ba.freestatistics.org/blog/index.php?pk=123429&T=0

As an alternative you can also use a QR Code:  

The GUIDs for individual cells are displayed in the table below:

Summary of computational transaction
Raw Inputview raw input (R code)
Raw Outputview raw output of R engine
Computing time2 seconds
R Server'George Udny Yule' @ yule.wessa.net


Autocorrelation Function
Time lag kACF(k)T-STATP-value
1-0.516006-5.33760
20.0947140.97970.164714
3-0.183515-1.89830.030176
40.1645161.70180.045852
5-0.083453-0.86320.194966
60.052740.54550.293257
7-0.093394-0.96610.168093
80.196592.03350.022236
9-0.223635-2.31330.011309
100.1130091.1690.122507
11-0.432587-4.47471e-05
120.84348.72420
13-0.439306-4.54427e-06
140.0583560.60360.27368
15-0.140221-1.45050.074929
160.1352431.3990.082358
17-0.068686-0.71050.239472
180.0565010.58450.280074
19-0.111786-1.15630.125063
200.2154162.22830.013977
21-0.241232-2.49530.007056
220.1280911.3250.093999
23-0.354563-3.66760.000192
240.6937477.17620
25-0.366846-3.79470.000123
260.033270.34420.365704
27-0.088799-0.91850.1802
280.0787510.81460.208554
29-0.028013-0.28980.386277
300.0495350.51240.304716
31-0.118698-1.22780.111105
320.2022432.0920.019401
33-0.231258-2.39220.009247
340.1330481.37630.085808
35-0.282509-2.92230.00212
360.5653345.84790
37-0.314117-3.24930.000773
380.0170510.17640.430165
39-0.053868-0.55720.289271
400.0542620.56130.287887
41-0.014065-0.14550.442297
420.0359080.37140.355523
43-0.10946-1.13230.130027
440.1672721.73030.043232
45-0.181117-1.87350.031865
460.1175151.21560.113409
47-0.22224-2.29890.011727
480.4493924.64865e-06

\begin{tabular}{lllllllll}
\hline
Autocorrelation Function \tabularnewline
Time lag k & ACF(k) & T-STAT & P-value \tabularnewline
1 & -0.516006 & -5.3376 & 0 \tabularnewline
2 & 0.094714 & 0.9797 & 0.164714 \tabularnewline
3 & -0.183515 & -1.8983 & 0.030176 \tabularnewline
4 & 0.164516 & 1.7018 & 0.045852 \tabularnewline
5 & -0.083453 & -0.8632 & 0.194966 \tabularnewline
6 & 0.05274 & 0.5455 & 0.293257 \tabularnewline
7 & -0.093394 & -0.9661 & 0.168093 \tabularnewline
8 & 0.19659 & 2.0335 & 0.022236 \tabularnewline
9 & -0.223635 & -2.3133 & 0.011309 \tabularnewline
10 & 0.113009 & 1.169 & 0.122507 \tabularnewline
11 & -0.432587 & -4.4747 & 1e-05 \tabularnewline
12 & 0.8434 & 8.7242 & 0 \tabularnewline
13 & -0.439306 & -4.5442 & 7e-06 \tabularnewline
14 & 0.058356 & 0.6036 & 0.27368 \tabularnewline
15 & -0.140221 & -1.4505 & 0.074929 \tabularnewline
16 & 0.135243 & 1.399 & 0.082358 \tabularnewline
17 & -0.068686 & -0.7105 & 0.239472 \tabularnewline
18 & 0.056501 & 0.5845 & 0.280074 \tabularnewline
19 & -0.111786 & -1.1563 & 0.125063 \tabularnewline
20 & 0.215416 & 2.2283 & 0.013977 \tabularnewline
21 & -0.241232 & -2.4953 & 0.007056 \tabularnewline
22 & 0.128091 & 1.325 & 0.093999 \tabularnewline
23 & -0.354563 & -3.6676 & 0.000192 \tabularnewline
24 & 0.693747 & 7.1762 & 0 \tabularnewline
25 & -0.366846 & -3.7947 & 0.000123 \tabularnewline
26 & 0.03327 & 0.3442 & 0.365704 \tabularnewline
27 & -0.088799 & -0.9185 & 0.1802 \tabularnewline
28 & 0.078751 & 0.8146 & 0.208554 \tabularnewline
29 & -0.028013 & -0.2898 & 0.386277 \tabularnewline
30 & 0.049535 & 0.5124 & 0.304716 \tabularnewline
31 & -0.118698 & -1.2278 & 0.111105 \tabularnewline
32 & 0.202243 & 2.092 & 0.019401 \tabularnewline
33 & -0.231258 & -2.3922 & 0.009247 \tabularnewline
34 & 0.133048 & 1.3763 & 0.085808 \tabularnewline
35 & -0.282509 & -2.9223 & 0.00212 \tabularnewline
36 & 0.565334 & 5.8479 & 0 \tabularnewline
37 & -0.314117 & -3.2493 & 0.000773 \tabularnewline
38 & 0.017051 & 0.1764 & 0.430165 \tabularnewline
39 & -0.053868 & -0.5572 & 0.289271 \tabularnewline
40 & 0.054262 & 0.5613 & 0.287887 \tabularnewline
41 & -0.014065 & -0.1455 & 0.442297 \tabularnewline
42 & 0.035908 & 0.3714 & 0.355523 \tabularnewline
43 & -0.10946 & -1.1323 & 0.130027 \tabularnewline
44 & 0.167272 & 1.7303 & 0.043232 \tabularnewline
45 & -0.181117 & -1.8735 & 0.031865 \tabularnewline
46 & 0.117515 & 1.2156 & 0.113409 \tabularnewline
47 & -0.22224 & -2.2989 & 0.011727 \tabularnewline
48 & 0.449392 & 4.6486 & 5e-06 \tabularnewline
\hline
\end{tabular}
%Source: https://freestatistics.org/blog/index.php?pk=123429&T=1

[TABLE]
[ROW][C]Autocorrelation Function[/C][/ROW]
[ROW][C]Time lag k[/C][C]ACF(k)[/C][C]T-STAT[/C][C]P-value[/C][/ROW]
[ROW][C]1[/C][C]-0.516006[/C][C]-5.3376[/C][C]0[/C][/ROW]
[ROW][C]2[/C][C]0.094714[/C][C]0.9797[/C][C]0.164714[/C][/ROW]
[ROW][C]3[/C][C]-0.183515[/C][C]-1.8983[/C][C]0.030176[/C][/ROW]
[ROW][C]4[/C][C]0.164516[/C][C]1.7018[/C][C]0.045852[/C][/ROW]
[ROW][C]5[/C][C]-0.083453[/C][C]-0.8632[/C][C]0.194966[/C][/ROW]
[ROW][C]6[/C][C]0.05274[/C][C]0.5455[/C][C]0.293257[/C][/ROW]
[ROW][C]7[/C][C]-0.093394[/C][C]-0.9661[/C][C]0.168093[/C][/ROW]
[ROW][C]8[/C][C]0.19659[/C][C]2.0335[/C][C]0.022236[/C][/ROW]
[ROW][C]9[/C][C]-0.223635[/C][C]-2.3133[/C][C]0.011309[/C][/ROW]
[ROW][C]10[/C][C]0.113009[/C][C]1.169[/C][C]0.122507[/C][/ROW]
[ROW][C]11[/C][C]-0.432587[/C][C]-4.4747[/C][C]1e-05[/C][/ROW]
[ROW][C]12[/C][C]0.8434[/C][C]8.7242[/C][C]0[/C][/ROW]
[ROW][C]13[/C][C]-0.439306[/C][C]-4.5442[/C][C]7e-06[/C][/ROW]
[ROW][C]14[/C][C]0.058356[/C][C]0.6036[/C][C]0.27368[/C][/ROW]
[ROW][C]15[/C][C]-0.140221[/C][C]-1.4505[/C][C]0.074929[/C][/ROW]
[ROW][C]16[/C][C]0.135243[/C][C]1.399[/C][C]0.082358[/C][/ROW]
[ROW][C]17[/C][C]-0.068686[/C][C]-0.7105[/C][C]0.239472[/C][/ROW]
[ROW][C]18[/C][C]0.056501[/C][C]0.5845[/C][C]0.280074[/C][/ROW]
[ROW][C]19[/C][C]-0.111786[/C][C]-1.1563[/C][C]0.125063[/C][/ROW]
[ROW][C]20[/C][C]0.215416[/C][C]2.2283[/C][C]0.013977[/C][/ROW]
[ROW][C]21[/C][C]-0.241232[/C][C]-2.4953[/C][C]0.007056[/C][/ROW]
[ROW][C]22[/C][C]0.128091[/C][C]1.325[/C][C]0.093999[/C][/ROW]
[ROW][C]23[/C][C]-0.354563[/C][C]-3.6676[/C][C]0.000192[/C][/ROW]
[ROW][C]24[/C][C]0.693747[/C][C]7.1762[/C][C]0[/C][/ROW]
[ROW][C]25[/C][C]-0.366846[/C][C]-3.7947[/C][C]0.000123[/C][/ROW]
[ROW][C]26[/C][C]0.03327[/C][C]0.3442[/C][C]0.365704[/C][/ROW]
[ROW][C]27[/C][C]-0.088799[/C][C]-0.9185[/C][C]0.1802[/C][/ROW]
[ROW][C]28[/C][C]0.078751[/C][C]0.8146[/C][C]0.208554[/C][/ROW]
[ROW][C]29[/C][C]-0.028013[/C][C]-0.2898[/C][C]0.386277[/C][/ROW]
[ROW][C]30[/C][C]0.049535[/C][C]0.5124[/C][C]0.304716[/C][/ROW]
[ROW][C]31[/C][C]-0.118698[/C][C]-1.2278[/C][C]0.111105[/C][/ROW]
[ROW][C]32[/C][C]0.202243[/C][C]2.092[/C][C]0.019401[/C][/ROW]
[ROW][C]33[/C][C]-0.231258[/C][C]-2.3922[/C][C]0.009247[/C][/ROW]
[ROW][C]34[/C][C]0.133048[/C][C]1.3763[/C][C]0.085808[/C][/ROW]
[ROW][C]35[/C][C]-0.282509[/C][C]-2.9223[/C][C]0.00212[/C][/ROW]
[ROW][C]36[/C][C]0.565334[/C][C]5.8479[/C][C]0[/C][/ROW]
[ROW][C]37[/C][C]-0.314117[/C][C]-3.2493[/C][C]0.000773[/C][/ROW]
[ROW][C]38[/C][C]0.017051[/C][C]0.1764[/C][C]0.430165[/C][/ROW]
[ROW][C]39[/C][C]-0.053868[/C][C]-0.5572[/C][C]0.289271[/C][/ROW]
[ROW][C]40[/C][C]0.054262[/C][C]0.5613[/C][C]0.287887[/C][/ROW]
[ROW][C]41[/C][C]-0.014065[/C][C]-0.1455[/C][C]0.442297[/C][/ROW]
[ROW][C]42[/C][C]0.035908[/C][C]0.3714[/C][C]0.355523[/C][/ROW]
[ROW][C]43[/C][C]-0.10946[/C][C]-1.1323[/C][C]0.130027[/C][/ROW]
[ROW][C]44[/C][C]0.167272[/C][C]1.7303[/C][C]0.043232[/C][/ROW]
[ROW][C]45[/C][C]-0.181117[/C][C]-1.8735[/C][C]0.031865[/C][/ROW]
[ROW][C]46[/C][C]0.117515[/C][C]1.2156[/C][C]0.113409[/C][/ROW]
[ROW][C]47[/C][C]-0.22224[/C][C]-2.2989[/C][C]0.011727[/C][/ROW]
[ROW][C]48[/C][C]0.449392[/C][C]4.6486[/C][C]5e-06[/C][/ROW]
[/TABLE]
Source: https://freestatistics.org/blog/index.php?pk=123429&T=1

Globally Unique Identifier (entire table): ba.freestatistics.org/blog/index.php?pk=123429&T=1

As an alternative you can also use a QR Code:  

The GUIDs for individual cells are displayed in the table below:

Autocorrelation Function
Time lag kACF(k)T-STATP-value
1-0.516006-5.33760
20.0947140.97970.164714
3-0.183515-1.89830.030176
40.1645161.70180.045852
5-0.083453-0.86320.194966
60.052740.54550.293257
7-0.093394-0.96610.168093
80.196592.03350.022236
9-0.223635-2.31330.011309
100.1130091.1690.122507
11-0.432587-4.47471e-05
120.84348.72420
13-0.439306-4.54427e-06
140.0583560.60360.27368
15-0.140221-1.45050.074929
160.1352431.3990.082358
17-0.068686-0.71050.239472
180.0565010.58450.280074
19-0.111786-1.15630.125063
200.2154162.22830.013977
21-0.241232-2.49530.007056
220.1280911.3250.093999
23-0.354563-3.66760.000192
240.6937477.17620
25-0.366846-3.79470.000123
260.033270.34420.365704
27-0.088799-0.91850.1802
280.0787510.81460.208554
29-0.028013-0.28980.386277
300.0495350.51240.304716
31-0.118698-1.22780.111105
320.2022432.0920.019401
33-0.231258-2.39220.009247
340.1330481.37630.085808
35-0.282509-2.92230.00212
360.5653345.84790
37-0.314117-3.24930.000773
380.0170510.17640.430165
39-0.053868-0.55720.289271
400.0542620.56130.287887
41-0.014065-0.14550.442297
420.0359080.37140.355523
43-0.10946-1.13230.130027
440.1672721.73030.043232
45-0.181117-1.87350.031865
460.1175151.21560.113409
47-0.22224-2.29890.011727
480.4493924.64865e-06


Partial Autocorrelation Function
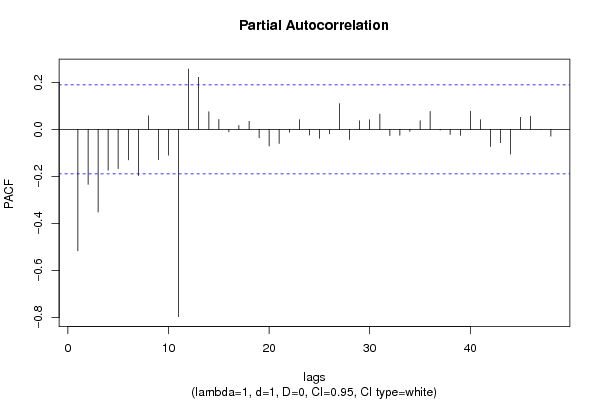
Time lag kPACF(k)T-STATP-value
1-0.516006-5.33760
2-0.2338-2.41840.008638
3-0.351567-3.63660.000213
4-0.173499-1.79470.037763
5-0.166425-1.72150.044024
6-0.129641-1.3410.091377
7-0.19643-2.03190.022321
80.057370.59340.277069
9-0.128567-1.32990.093188
10-0.109496-1.13260.12995
11-0.796353-8.23750
120.2568722.65710.004544
130.2210352.28640.0121
140.0751930.77780.219201
150.0420720.43520.332147
16-0.01021-0.10560.458042
170.0167630.17340.431332
180.0341420.35320.362327
19-0.035407-0.36620.357451
20-0.070772-0.73210.232863
21-0.059702-0.61760.269088
22-0.012038-0.12450.450566
230.04130.42720.335043
24-0.024282-0.25120.401079
25-0.03791-0.39210.347868
26-0.018545-0.19180.42412
270.1086471.12390.131794
28-0.043023-0.4450.328596
290.0361520.3740.354586
300.0404710.41860.338161
310.0649840.67220.251453
32-0.026064-0.26960.39399
33-0.02482-0.25670.398935
34-0.008683-0.08980.4643
350.0366920.37950.352517
360.0759410.78550.216936
37-0.002871-0.02970.488181
38-0.021313-0.22050.412967
39-0.025732-0.26620.39531
400.076850.79490.214203
410.0408460.42250.336747
42-0.073139-0.75660.225489
43-0.056504-0.58450.280065
44-0.104597-1.0820.140851
450.0509730.52730.299548
460.0555830.5750.283265
472e-0600.499991
48-0.028722-0.29710.383481

\begin{tabular}{lllllllll}
\hline
Partial Autocorrelation Function \tabularnewline
Time lag k & PACF(k) & T-STAT & P-value \tabularnewline
1 & -0.516006 & -5.3376 & 0 \tabularnewline
2 & -0.2338 & -2.4184 & 0.008638 \tabularnewline
3 & -0.351567 & -3.6366 & 0.000213 \tabularnewline
4 & -0.173499 & -1.7947 & 0.037763 \tabularnewline
5 & -0.166425 & -1.7215 & 0.044024 \tabularnewline
6 & -0.129641 & -1.341 & 0.091377 \tabularnewline
7 & -0.19643 & -2.0319 & 0.022321 \tabularnewline
8 & 0.05737 & 0.5934 & 0.277069 \tabularnewline
9 & -0.128567 & -1.3299 & 0.093188 \tabularnewline
10 & -0.109496 & -1.1326 & 0.12995 \tabularnewline
11 & -0.796353 & -8.2375 & 0 \tabularnewline
12 & 0.256872 & 2.6571 & 0.004544 \tabularnewline
13 & 0.221035 & 2.2864 & 0.0121 \tabularnewline
14 & 0.075193 & 0.7778 & 0.219201 \tabularnewline
15 & 0.042072 & 0.4352 & 0.332147 \tabularnewline
16 & -0.01021 & -0.1056 & 0.458042 \tabularnewline
17 & 0.016763 & 0.1734 & 0.431332 \tabularnewline
18 & 0.034142 & 0.3532 & 0.362327 \tabularnewline
19 & -0.035407 & -0.3662 & 0.357451 \tabularnewline
20 & -0.070772 & -0.7321 & 0.232863 \tabularnewline
21 & -0.059702 & -0.6176 & 0.269088 \tabularnewline
22 & -0.012038 & -0.1245 & 0.450566 \tabularnewline
23 & 0.0413 & 0.4272 & 0.335043 \tabularnewline
24 & -0.024282 & -0.2512 & 0.401079 \tabularnewline
25 & -0.03791 & -0.3921 & 0.347868 \tabularnewline
26 & -0.018545 & -0.1918 & 0.42412 \tabularnewline
27 & 0.108647 & 1.1239 & 0.131794 \tabularnewline
28 & -0.043023 & -0.445 & 0.328596 \tabularnewline
29 & 0.036152 & 0.374 & 0.354586 \tabularnewline
30 & 0.040471 & 0.4186 & 0.338161 \tabularnewline
31 & 0.064984 & 0.6722 & 0.251453 \tabularnewline
32 & -0.026064 & -0.2696 & 0.39399 \tabularnewline
33 & -0.02482 & -0.2567 & 0.398935 \tabularnewline
34 & -0.008683 & -0.0898 & 0.4643 \tabularnewline
35 & 0.036692 & 0.3795 & 0.352517 \tabularnewline
36 & 0.075941 & 0.7855 & 0.216936 \tabularnewline
37 & -0.002871 & -0.0297 & 0.488181 \tabularnewline
38 & -0.021313 & -0.2205 & 0.412967 \tabularnewline
39 & -0.025732 & -0.2662 & 0.39531 \tabularnewline
40 & 0.07685 & 0.7949 & 0.214203 \tabularnewline
41 & 0.040846 & 0.4225 & 0.336747 \tabularnewline
42 & -0.073139 & -0.7566 & 0.225489 \tabularnewline
43 & -0.056504 & -0.5845 & 0.280065 \tabularnewline
44 & -0.104597 & -1.082 & 0.140851 \tabularnewline
45 & 0.050973 & 0.5273 & 0.299548 \tabularnewline
46 & 0.055583 & 0.575 & 0.283265 \tabularnewline
47 & 2e-06 & 0 & 0.499991 \tabularnewline
48 & -0.028722 & -0.2971 & 0.383481 \tabularnewline
\hline
\end{tabular}
%Source: https://freestatistics.org/blog/index.php?pk=123429&T=2

[TABLE]
[ROW][C]Partial Autocorrelation Function[/C][/ROW]
[ROW][C]Time lag k[/C][C]PACF(k)[/C][C]T-STAT[/C][C]P-value[/C][/ROW]
[ROW][C]1[/C][C]-0.516006[/C][C]-5.3376[/C][C]0[/C][/ROW]
[ROW][C]2[/C][C]-0.2338[/C][C]-2.4184[/C][C]0.008638[/C][/ROW]
[ROW][C]3[/C][C]-0.351567[/C][C]-3.6366[/C][C]0.000213[/C][/ROW]
[ROW][C]4[/C][C]-0.173499[/C][C]-1.7947[/C][C]0.037763[/C][/ROW]
[ROW][C]5[/C][C]-0.166425[/C][C]-1.7215[/C][C]0.044024[/C][/ROW]
[ROW][C]6[/C][C]-0.129641[/C][C]-1.341[/C][C]0.091377[/C][/ROW]
[ROW][C]7[/C][C]-0.19643[/C][C]-2.0319[/C][C]0.022321[/C][/ROW]
[ROW][C]8[/C][C]0.05737[/C][C]0.5934[/C][C]0.277069[/C][/ROW]
[ROW][C]9[/C][C]-0.128567[/C][C]-1.3299[/C][C]0.093188[/C][/ROW]
[ROW][C]10[/C][C]-0.109496[/C][C]-1.1326[/C][C]0.12995[/C][/ROW]
[ROW][C]11[/C][C]-0.796353[/C][C]-8.2375[/C][C]0[/C][/ROW]
[ROW][C]12[/C][C]0.256872[/C][C]2.6571[/C][C]0.004544[/C][/ROW]
[ROW][C]13[/C][C]0.221035[/C][C]2.2864[/C][C]0.0121[/C][/ROW]
[ROW][C]14[/C][C]0.075193[/C][C]0.7778[/C][C]0.219201[/C][/ROW]
[ROW][C]15[/C][C]0.042072[/C][C]0.4352[/C][C]0.332147[/C][/ROW]
[ROW][C]16[/C][C]-0.01021[/C][C]-0.1056[/C][C]0.458042[/C][/ROW]
[ROW][C]17[/C][C]0.016763[/C][C]0.1734[/C][C]0.431332[/C][/ROW]
[ROW][C]18[/C][C]0.034142[/C][C]0.3532[/C][C]0.362327[/C][/ROW]
[ROW][C]19[/C][C]-0.035407[/C][C]-0.3662[/C][C]0.357451[/C][/ROW]
[ROW][C]20[/C][C]-0.070772[/C][C]-0.7321[/C][C]0.232863[/C][/ROW]
[ROW][C]21[/C][C]-0.059702[/C][C]-0.6176[/C][C]0.269088[/C][/ROW]
[ROW][C]22[/C][C]-0.012038[/C][C]-0.1245[/C][C]0.450566[/C][/ROW]
[ROW][C]23[/C][C]0.0413[/C][C]0.4272[/C][C]0.335043[/C][/ROW]
[ROW][C]24[/C][C]-0.024282[/C][C]-0.2512[/C][C]0.401079[/C][/ROW]
[ROW][C]25[/C][C]-0.03791[/C][C]-0.3921[/C][C]0.347868[/C][/ROW]
[ROW][C]26[/C][C]-0.018545[/C][C]-0.1918[/C][C]0.42412[/C][/ROW]
[ROW][C]27[/C][C]0.108647[/C][C]1.1239[/C][C]0.131794[/C][/ROW]
[ROW][C]28[/C][C]-0.043023[/C][C]-0.445[/C][C]0.328596[/C][/ROW]
[ROW][C]29[/C][C]0.036152[/C][C]0.374[/C][C]0.354586[/C][/ROW]
[ROW][C]30[/C][C]0.040471[/C][C]0.4186[/C][C]0.338161[/C][/ROW]
[ROW][C]31[/C][C]0.064984[/C][C]0.6722[/C][C]0.251453[/C][/ROW]
[ROW][C]32[/C][C]-0.026064[/C][C]-0.2696[/C][C]0.39399[/C][/ROW]
[ROW][C]33[/C][C]-0.02482[/C][C]-0.2567[/C][C]0.398935[/C][/ROW]
[ROW][C]34[/C][C]-0.008683[/C][C]-0.0898[/C][C]0.4643[/C][/ROW]
[ROW][C]35[/C][C]0.036692[/C][C]0.3795[/C][C]0.352517[/C][/ROW]
[ROW][C]36[/C][C]0.075941[/C][C]0.7855[/C][C]0.216936[/C][/ROW]
[ROW][C]37[/C][C]-0.002871[/C][C]-0.0297[/C][C]0.488181[/C][/ROW]
[ROW][C]38[/C][C]-0.021313[/C][C]-0.2205[/C][C]0.412967[/C][/ROW]
[ROW][C]39[/C][C]-0.025732[/C][C]-0.2662[/C][C]0.39531[/C][/ROW]
[ROW][C]40[/C][C]0.07685[/C][C]0.7949[/C][C]0.214203[/C][/ROW]
[ROW][C]41[/C][C]0.040846[/C][C]0.4225[/C][C]0.336747[/C][/ROW]
[ROW][C]42[/C][C]-0.073139[/C][C]-0.7566[/C][C]0.225489[/C][/ROW]
[ROW][C]43[/C][C]-0.056504[/C][C]-0.5845[/C][C]0.280065[/C][/ROW]
[ROW][C]44[/C][C]-0.104597[/C][C]-1.082[/C][C]0.140851[/C][/ROW]
[ROW][C]45[/C][C]0.050973[/C][C]0.5273[/C][C]0.299548[/C][/ROW]
[ROW][C]46[/C][C]0.055583[/C][C]0.575[/C][C]0.283265[/C][/ROW]
[ROW][C]47[/C][C]2e-06[/C][C]0[/C][C]0.499991[/C][/ROW]
[ROW][C]48[/C][C]-0.028722[/C][C]-0.2971[/C][C]0.383481[/C][/ROW]
[/TABLE]
Source: https://freestatistics.org/blog/index.php?pk=123429&T=2

Globally Unique Identifier (entire table): ba.freestatistics.org/blog/index.php?pk=123429&T=2

As an alternative you can also use a QR Code:  

The GUIDs for individual cells are displayed in the table below:

Partial Autocorrelation Function
Time lag kPACF(k)T-STATP-value
1-0.516006-5.33760
2-0.2338-2.41840.008638
3-0.351567-3.63660.000213
4-0.173499-1.79470.037763
5-0.166425-1.72150.044024
6-0.129641-1.3410.091377
7-0.19643-2.03190.022321
80.057370.59340.277069
9-0.128567-1.32990.093188
10-0.109496-1.13260.12995
11-0.796353-8.23750
120.2568722.65710.004544
130.2210352.28640.0121
140.0751930.77780.219201
150.0420720.43520.332147
16-0.01021-0.10560.458042
170.0167630.17340.431332
180.0341420.35320.362327
19-0.035407-0.36620.357451
20-0.070772-0.73210.232863
21-0.059702-0.61760.269088
22-0.012038-0.12450.450566
230.04130.42720.335043
24-0.024282-0.25120.401079
25-0.03791-0.39210.347868
26-0.018545-0.19180.42412
270.1086471.12390.131794
28-0.043023-0.4450.328596
290.0361520.3740.354586
300.0404710.41860.338161
310.0649840.67220.251453
32-0.026064-0.26960.39399
33-0.02482-0.25670.398935
34-0.008683-0.08980.4643
350.0366920.37950.352517
360.0759410.78550.216936
37-0.002871-0.02970.488181
38-0.021313-0.22050.412967
39-0.025732-0.26620.39531
400.076850.79490.214203
410.0408460.42250.336747
42-0.073139-0.75660.225489
43-0.056504-0.58450.280065
44-0.104597-1.0820.140851
450.0509730.52730.299548
460.0555830.5750.283265
472e-0600.499991
48-0.028722-0.29710.383481


Parameters (Session):
par1 = 48 ; par2 = 1 ; par3 = 1 ; par4 = 0 ; par5 = 12 ; par6 = White Noise ; par7 = 0.95 ;
Parameters (R input):
par1 = 48 ; par2 = 1 ; par3 = 1 ; par4 = 0 ; par5 = 12 ; par6 = White Noise ; par7 = 0.95 ; par8 = ;
R code (references can be found in the software module):
if (par1 == 'Default') {
par1 = 10*log10(length(x))
} else {
par1 <- as.numeric(par1)
}
par2 <- as.numeric(par2)
par3 <- as.numeric(par3)
par4 <- as.numeric(par4)
par5 <- as.numeric(par5)
if (par6 == 'White Noise') par6 <- 'white' else par6 <- 'ma'
par7 <- as.numeric(par7)
if (par8 != '') par8 <- as.numeric(par8)
ox <- x
if (par8 == '') {
if (par2 == 0) {
x <- log(x)
} else {
x <- (x ^ par2 - 1) / par2
}
} else {
x <- log(x,base=par8)
}
if (par3 > 0) x <- diff(x,lag=1,difference=par3)
if (par4 > 0) x <- diff(x,lag=par5,difference=par4)
bitmap(file='picts.png')
op <- par(mfrow=c(2,1))
plot(ox,type='l',main='Original Time Series',xlab='time',ylab='value')
if (par8=='') {
mytitle <- paste('Working Time Series (lambda=',par2,', d=',par3,', D=',par4,')',sep='')
mysub <- paste('(lambda=',par2,', d=',par3,', D=',par4,', CI=', par7, ', CI type=',par6,')',sep='')
} else {
mytitle <- paste('Working Time Series (base=',par8,', d=',par3,', D=',par4,')',sep='')
mysub <- paste('(base=',par8,', d=',par3,', D=',par4,', CI=', par7, ', CI type=',par6,')',sep='')
}
plot(x,type='l', main=mytitle,xlab='time',ylab='value')
par(op)
dev.off()
bitmap(file='pic1.png')
racf <- acf(x, par1, main='Autocorrelation', xlab='time lag', ylab='ACF', ci.type=par6, ci=par7, sub=mysub)
dev.off()
bitmap(file='pic2.png')
rpacf <- pacf(x,par1,main='Partial Autocorrelation',xlab='lags',ylab='PACF',sub=mysub)
dev.off()
(myacf <- c(racf$acf))
(mypacf <- c(rpacf$acf))
lengthx <- length(x)
sqrtn <- sqrt(lengthx)
load(file='createtable')
a<-table.start()
a<-table.row.start(a)
a<-table.element(a,'Autocorrelation Function',4,TRUE)
a<-table.row.end(a)
a<-table.row.start(a)
a<-table.element(a,'Time lag k',header=TRUE)
a<-table.element(a,hyperlink('basics.htm','ACF(k)','click here for more information about the Autocorrelation Function'),header=TRUE)
a<-table.element(a,'T-STAT',header=TRUE)
a<-table.element(a,'P-value',header=TRUE)
a<-table.row.end(a)
for (i in 2:(par1+1)) {
a<-table.row.start(a)
a<-table.element(a,i-1,header=TRUE)
a<-table.element(a,round(myacf[i],6))
mytstat <- myacf[i]*sqrtn
a<-table.element(a,round(mytstat,4))
a<-table.element(a,round(1-pt(abs(mytstat),lengthx),6))
a<-table.row.end(a)
}
a<-table.end(a)
table.save(a,file='mytable.tab')
a<-table.start()
a<-table.row.start(a)
a<-table.element(a,'Partial Autocorrelation Function',4,TRUE)
a<-table.row.end(a)
a<-table.row.start(a)
a<-table.element(a,'Time lag k',header=TRUE)
a<-table.element(a,hyperlink('basics.htm','PACF(k)','click here for more information about the Partial Autocorrelation Function'),header=TRUE)
a<-table.element(a,'T-STAT',header=TRUE)
a<-table.element(a,'P-value',header=TRUE)
a<-table.row.end(a)
for (i in 1:par1) {
a<-table.row.start(a)
a<-table.element(a,i,header=TRUE)
a<-table.element(a,round(mypacf[i],6))
mytstat <- mypacf[i]*sqrtn
a<-table.element(a,round(mytstat,4))
a<-table.element(a,round(1-pt(abs(mytstat),lengthx),6))
a<-table.row.end(a)
}
a<-table.end(a)
table.save(a,file='mytable1.tab')