Free Statistics

of Irreproducible Research!

Author's title

Author*Unverified author*
R Software Modulerwasp_autocorrelation.wasp
Title produced by software(Partial) Autocorrelation Function
Date of computationFri, 05 Aug 2011 13:00:39 -0400
Cite this page as followsStatistical Computations at FreeStatistics.org, Office for Research Development and Education, URL https://freestatistics.org/blog/index.php?v=date/2011/Aug/05/t1312563736t6quzq1kusl8kil.htm/, Retrieved Tue, 14 May 2024 06:58:47 +0000
Statistical Computations at FreeStatistics.org, Office for Research Development and Education, URL https://freestatistics.org/blog/index.php?pk=123428, Retrieved Tue, 14 May 2024 06:58:47 +0000
QR Codes:

Original text written by user:
IsPrivate?No (this computation is public)
User-defined keywordsVan Vlaenderen Lynn
Estimated Impact177
Family? (F = Feedback message, R = changed R code, M = changed R Module, P = changed Parameters, D = changed Data)
-       [(Partial) Autocorrelation Function] [tijdreeksB-stap17] [2011-08-05 17:00:39] [d08a5fa9e4c562ec79e796d78c067f4f] [Current]
Feedback Forum

Post a new message
Dataseries X:
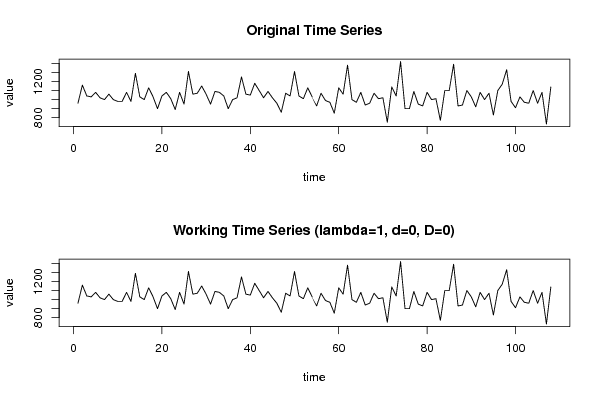
960
1160
1040
1030
1080
1020
1000
1060
1000
980
980
1080
980
1290
1030
1000
1130
1030
900
1040
1080
1010
890
1080
950
1310
1060
1070
1150
1060
950
1090
1080
1040
900
1000
1020
1250
1060
1050
1180
1100
1020
1090
1020
960
860
1070
1040
1310
1040
1010
1130
1030
930
1070
990
970
850
1130
1060
1380
1000
970
1080
940
960
1070
1010
1020
750
1140
1040
1420
900
900
1090
950
930
1080
1000
1010
770
1100
1100
1390
930
940
1100
1030
920
1080
1000
1070
830
1100
1170
1330
980
910
1030
970
960
1100
960
1080
730
1140


Summary of computational transaction
Raw Inputview raw input (R code)
Raw Outputview raw output of R engine
Computing time2 seconds
R Server'Herman Ole Andreas Wold' @ wold.wessa.net

\begin{tabular}{lllllllll}
\hline
Summary of computational transaction \tabularnewline
Raw Input & view raw input (R code)  \tabularnewline
Raw Output & view raw output of R engine  \tabularnewline
Computing time & 2 seconds \tabularnewline
R Server & 'Herman Ole Andreas Wold' @ wold.wessa.net \tabularnewline
\hline
\end{tabular}
%Source: https://freestatistics.org/blog/index.php?pk=123428&T=0

[TABLE]
[ROW][C]Summary of computational transaction[/C][/ROW]
[ROW][C]Raw Input[/C][C]view raw input (R code) [/C][/ROW]
[ROW][C]Raw Output[/C][C]view raw output of R engine [/C][/ROW]
[ROW][C]Computing time[/C][C]2 seconds[/C][/ROW]
[ROW][C]R Server[/C][C]'Herman Ole Andreas Wold' @ wold.wessa.net[/C][/ROW]
[/TABLE]
Source: https://freestatistics.org/blog/index.php?pk=123428&T=0

Globally Unique Identifier (entire table): ba.freestatistics.org/blog/index.php?pk=123428&T=0

As an alternative you can also use a QR Code:  

The GUIDs for individual cells are displayed in the table below:

Summary of computational transaction
Raw Inputview raw input (R code)
Raw Outputview raw output of R engine
Computing time2 seconds
R Server'Herman Ole Andreas Wold' @ wold.wessa.net


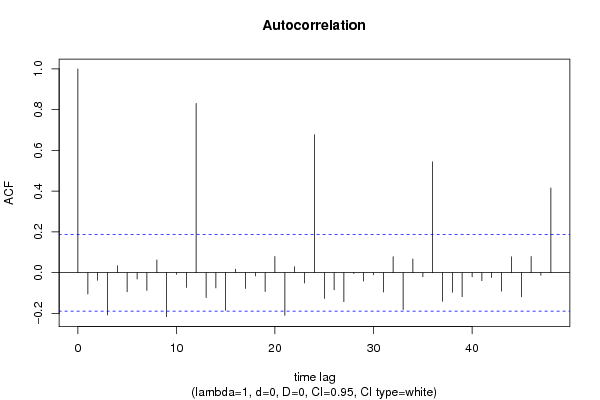
Autocorrelation Function
Time lag kACF(k)T-STATP-value
1-0.10469-1.0880.139515
2-0.037112-0.38570.350246
3-0.207143-2.15270.016784
40.0338030.35130.363027
5-0.093712-0.97390.166145
6-0.031458-0.32690.372181
7-0.086808-0.90210.184496
80.062250.64690.259529
9-0.215885-2.24350.013451
10-0.00805-0.08370.466743
11-0.072297-0.75130.227044
120.8300638.62630
13-0.122338-1.27140.103163
14-0.074784-0.77720.219375
15-0.184744-1.91990.028753
160.0166580.17310.431442
17-0.077941-0.810.209864
18-0.01591-0.16530.434493
19-0.09218-0.9580.170111
200.0796740.8280.20475
21-0.209281-2.17490.015909
220.0292540.3040.380849
23-0.051041-0.53040.29845
240.6770017.03560
25-0.126941-1.31920.094945
26-0.083635-0.86920.193344
27-0.142107-1.47680.071316
28-0.004161-0.04320.482794
29-0.040563-0.42150.337097
30-0.009908-0.1030.459091
31-0.095127-0.98860.162536
320.0783690.81440.208595
33-0.180512-1.87590.031682
340.0670750.69710.243629
35-0.020109-0.2090.41743
360.5439935.65330
37-0.140582-1.4610.073464
38-0.096523-1.00310.159028
39-0.117561-1.22170.112235
40-0.020045-0.20830.417688
41-0.039149-0.40690.342461
42-0.024017-0.24960.401688
43-0.090556-0.94110.174379
440.0777420.80790.210456
45-0.117979-1.22610.111418
460.0793060.82420.20583
47-0.012727-0.13230.447513
480.415674.31981.7e-05

\begin{tabular}{lllllllll}
\hline
Autocorrelation Function \tabularnewline
Time lag k & ACF(k) & T-STAT & P-value \tabularnewline
1 & -0.10469 & -1.088 & 0.139515 \tabularnewline
2 & -0.037112 & -0.3857 & 0.350246 \tabularnewline
3 & -0.207143 & -2.1527 & 0.016784 \tabularnewline
4 & 0.033803 & 0.3513 & 0.363027 \tabularnewline
5 & -0.093712 & -0.9739 & 0.166145 \tabularnewline
6 & -0.031458 & -0.3269 & 0.372181 \tabularnewline
7 & -0.086808 & -0.9021 & 0.184496 \tabularnewline
8 & 0.06225 & 0.6469 & 0.259529 \tabularnewline
9 & -0.215885 & -2.2435 & 0.013451 \tabularnewline
10 & -0.00805 & -0.0837 & 0.466743 \tabularnewline
11 & -0.072297 & -0.7513 & 0.227044 \tabularnewline
12 & 0.830063 & 8.6263 & 0 \tabularnewline
13 & -0.122338 & -1.2714 & 0.103163 \tabularnewline
14 & -0.074784 & -0.7772 & 0.219375 \tabularnewline
15 & -0.184744 & -1.9199 & 0.028753 \tabularnewline
16 & 0.016658 & 0.1731 & 0.431442 \tabularnewline
17 & -0.077941 & -0.81 & 0.209864 \tabularnewline
18 & -0.01591 & -0.1653 & 0.434493 \tabularnewline
19 & -0.09218 & -0.958 & 0.170111 \tabularnewline
20 & 0.079674 & 0.828 & 0.20475 \tabularnewline
21 & -0.209281 & -2.1749 & 0.015909 \tabularnewline
22 & 0.029254 & 0.304 & 0.380849 \tabularnewline
23 & -0.051041 & -0.5304 & 0.29845 \tabularnewline
24 & 0.677001 & 7.0356 & 0 \tabularnewline
25 & -0.126941 & -1.3192 & 0.094945 \tabularnewline
26 & -0.083635 & -0.8692 & 0.193344 \tabularnewline
27 & -0.142107 & -1.4768 & 0.071316 \tabularnewline
28 & -0.004161 & -0.0432 & 0.482794 \tabularnewline
29 & -0.040563 & -0.4215 & 0.337097 \tabularnewline
30 & -0.009908 & -0.103 & 0.459091 \tabularnewline
31 & -0.095127 & -0.9886 & 0.162536 \tabularnewline
32 & 0.078369 & 0.8144 & 0.208595 \tabularnewline
33 & -0.180512 & -1.8759 & 0.031682 \tabularnewline
34 & 0.067075 & 0.6971 & 0.243629 \tabularnewline
35 & -0.020109 & -0.209 & 0.41743 \tabularnewline
36 & 0.543993 & 5.6533 & 0 \tabularnewline
37 & -0.140582 & -1.461 & 0.073464 \tabularnewline
38 & -0.096523 & -1.0031 & 0.159028 \tabularnewline
39 & -0.117561 & -1.2217 & 0.112235 \tabularnewline
40 & -0.020045 & -0.2083 & 0.417688 \tabularnewline
41 & -0.039149 & -0.4069 & 0.342461 \tabularnewline
42 & -0.024017 & -0.2496 & 0.401688 \tabularnewline
43 & -0.090556 & -0.9411 & 0.174379 \tabularnewline
44 & 0.077742 & 0.8079 & 0.210456 \tabularnewline
45 & -0.117979 & -1.2261 & 0.111418 \tabularnewline
46 & 0.079306 & 0.8242 & 0.20583 \tabularnewline
47 & -0.012727 & -0.1323 & 0.447513 \tabularnewline
48 & 0.41567 & 4.3198 & 1.7e-05 \tabularnewline
\hline
\end{tabular}
%Source: https://freestatistics.org/blog/index.php?pk=123428&T=1

[TABLE]
[ROW][C]Autocorrelation Function[/C][/ROW]
[ROW][C]Time lag k[/C][C]ACF(k)[/C][C]T-STAT[/C][C]P-value[/C][/ROW]
[ROW][C]1[/C][C]-0.10469[/C][C]-1.088[/C][C]0.139515[/C][/ROW]
[ROW][C]2[/C][C]-0.037112[/C][C]-0.3857[/C][C]0.350246[/C][/ROW]
[ROW][C]3[/C][C]-0.207143[/C][C]-2.1527[/C][C]0.016784[/C][/ROW]
[ROW][C]4[/C][C]0.033803[/C][C]0.3513[/C][C]0.363027[/C][/ROW]
[ROW][C]5[/C][C]-0.093712[/C][C]-0.9739[/C][C]0.166145[/C][/ROW]
[ROW][C]6[/C][C]-0.031458[/C][C]-0.3269[/C][C]0.372181[/C][/ROW]
[ROW][C]7[/C][C]-0.086808[/C][C]-0.9021[/C][C]0.184496[/C][/ROW]
[ROW][C]8[/C][C]0.06225[/C][C]0.6469[/C][C]0.259529[/C][/ROW]
[ROW][C]9[/C][C]-0.215885[/C][C]-2.2435[/C][C]0.013451[/C][/ROW]
[ROW][C]10[/C][C]-0.00805[/C][C]-0.0837[/C][C]0.466743[/C][/ROW]
[ROW][C]11[/C][C]-0.072297[/C][C]-0.7513[/C][C]0.227044[/C][/ROW]
[ROW][C]12[/C][C]0.830063[/C][C]8.6263[/C][C]0[/C][/ROW]
[ROW][C]13[/C][C]-0.122338[/C][C]-1.2714[/C][C]0.103163[/C][/ROW]
[ROW][C]14[/C][C]-0.074784[/C][C]-0.7772[/C][C]0.219375[/C][/ROW]
[ROW][C]15[/C][C]-0.184744[/C][C]-1.9199[/C][C]0.028753[/C][/ROW]
[ROW][C]16[/C][C]0.016658[/C][C]0.1731[/C][C]0.431442[/C][/ROW]
[ROW][C]17[/C][C]-0.077941[/C][C]-0.81[/C][C]0.209864[/C][/ROW]
[ROW][C]18[/C][C]-0.01591[/C][C]-0.1653[/C][C]0.434493[/C][/ROW]
[ROW][C]19[/C][C]-0.09218[/C][C]-0.958[/C][C]0.170111[/C][/ROW]
[ROW][C]20[/C][C]0.079674[/C][C]0.828[/C][C]0.20475[/C][/ROW]
[ROW][C]21[/C][C]-0.209281[/C][C]-2.1749[/C][C]0.015909[/C][/ROW]
[ROW][C]22[/C][C]0.029254[/C][C]0.304[/C][C]0.380849[/C][/ROW]
[ROW][C]23[/C][C]-0.051041[/C][C]-0.5304[/C][C]0.29845[/C][/ROW]
[ROW][C]24[/C][C]0.677001[/C][C]7.0356[/C][C]0[/C][/ROW]
[ROW][C]25[/C][C]-0.126941[/C][C]-1.3192[/C][C]0.094945[/C][/ROW]
[ROW][C]26[/C][C]-0.083635[/C][C]-0.8692[/C][C]0.193344[/C][/ROW]
[ROW][C]27[/C][C]-0.142107[/C][C]-1.4768[/C][C]0.071316[/C][/ROW]
[ROW][C]28[/C][C]-0.004161[/C][C]-0.0432[/C][C]0.482794[/C][/ROW]
[ROW][C]29[/C][C]-0.040563[/C][C]-0.4215[/C][C]0.337097[/C][/ROW]
[ROW][C]30[/C][C]-0.009908[/C][C]-0.103[/C][C]0.459091[/C][/ROW]
[ROW][C]31[/C][C]-0.095127[/C][C]-0.9886[/C][C]0.162536[/C][/ROW]
[ROW][C]32[/C][C]0.078369[/C][C]0.8144[/C][C]0.208595[/C][/ROW]
[ROW][C]33[/C][C]-0.180512[/C][C]-1.8759[/C][C]0.031682[/C][/ROW]
[ROW][C]34[/C][C]0.067075[/C][C]0.6971[/C][C]0.243629[/C][/ROW]
[ROW][C]35[/C][C]-0.020109[/C][C]-0.209[/C][C]0.41743[/C][/ROW]
[ROW][C]36[/C][C]0.543993[/C][C]5.6533[/C][C]0[/C][/ROW]
[ROW][C]37[/C][C]-0.140582[/C][C]-1.461[/C][C]0.073464[/C][/ROW]
[ROW][C]38[/C][C]-0.096523[/C][C]-1.0031[/C][C]0.159028[/C][/ROW]
[ROW][C]39[/C][C]-0.117561[/C][C]-1.2217[/C][C]0.112235[/C][/ROW]
[ROW][C]40[/C][C]-0.020045[/C][C]-0.2083[/C][C]0.417688[/C][/ROW]
[ROW][C]41[/C][C]-0.039149[/C][C]-0.4069[/C][C]0.342461[/C][/ROW]
[ROW][C]42[/C][C]-0.024017[/C][C]-0.2496[/C][C]0.401688[/C][/ROW]
[ROW][C]43[/C][C]-0.090556[/C][C]-0.9411[/C][C]0.174379[/C][/ROW]
[ROW][C]44[/C][C]0.077742[/C][C]0.8079[/C][C]0.210456[/C][/ROW]
[ROW][C]45[/C][C]-0.117979[/C][C]-1.2261[/C][C]0.111418[/C][/ROW]
[ROW][C]46[/C][C]0.079306[/C][C]0.8242[/C][C]0.20583[/C][/ROW]
[ROW][C]47[/C][C]-0.012727[/C][C]-0.1323[/C][C]0.447513[/C][/ROW]
[ROW][C]48[/C][C]0.41567[/C][C]4.3198[/C][C]1.7e-05[/C][/ROW]
[/TABLE]
Source: https://freestatistics.org/blog/index.php?pk=123428&T=1

Globally Unique Identifier (entire table): ba.freestatistics.org/blog/index.php?pk=123428&T=1

As an alternative you can also use a QR Code:  

The GUIDs for individual cells are displayed in the table below:

Autocorrelation Function
Time lag kACF(k)T-STATP-value
1-0.10469-1.0880.139515
2-0.037112-0.38570.350246
3-0.207143-2.15270.016784
40.0338030.35130.363027
5-0.093712-0.97390.166145
6-0.031458-0.32690.372181
7-0.086808-0.90210.184496
80.062250.64690.259529
9-0.215885-2.24350.013451
10-0.00805-0.08370.466743
11-0.072297-0.75130.227044
120.8300638.62630
13-0.122338-1.27140.103163
14-0.074784-0.77720.219375
15-0.184744-1.91990.028753
160.0166580.17310.431442
17-0.077941-0.810.209864
18-0.01591-0.16530.434493
19-0.09218-0.9580.170111
200.0796740.8280.20475
21-0.209281-2.17490.015909
220.0292540.3040.380849
23-0.051041-0.53040.29845
240.6770017.03560
25-0.126941-1.31920.094945
26-0.083635-0.86920.193344
27-0.142107-1.47680.071316
28-0.004161-0.04320.482794
29-0.040563-0.42150.337097
30-0.009908-0.1030.459091
31-0.095127-0.98860.162536
320.0783690.81440.208595
33-0.180512-1.87590.031682
340.0670750.69710.243629
35-0.020109-0.2090.41743
360.5439935.65330
37-0.140582-1.4610.073464
38-0.096523-1.00310.159028
39-0.117561-1.22170.112235
40-0.020045-0.20830.417688
41-0.039149-0.40690.342461
42-0.024017-0.24960.401688
43-0.090556-0.94110.174379
440.0777420.80790.210456
45-0.117979-1.22610.111418
460.0793060.82420.20583
47-0.012727-0.13230.447513
480.415674.31981.7e-05


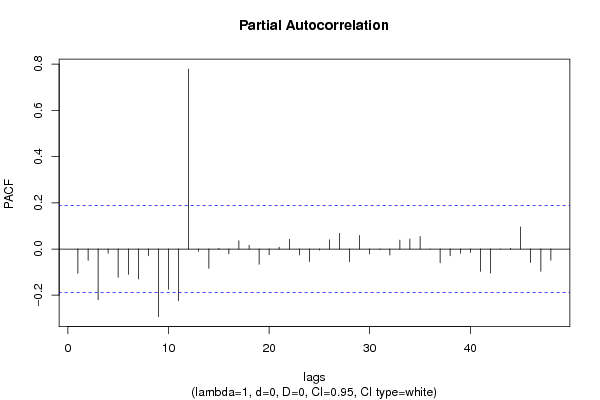
Partial Autocorrelation Function
Time lag kPACF(k)T-STATP-value
1-0.10469-1.0880.139515
2-0.048605-0.50510.307253
3-0.219221-2.27820.012341
4-0.017877-0.18580.426483
5-0.122385-1.27190.103076
6-0.109925-1.14240.127912
7-0.12925-1.34320.091011
8-0.029153-0.3030.381248
9-0.292696-3.04180.001476
10-0.173887-1.80710.036766
11-0.224005-2.32790.01089
120.7790178.09580
13-0.010151-0.10550.45809
14-0.083348-0.86620.194156
150.0026320.02740.489114
16-0.020259-0.21050.41682
170.0350950.36470.358016
180.0157040.16320.435333
19-0.06631-0.68910.246116
20-0.024251-0.2520.400751
210.0077730.08080.467885
220.0416790.43310.332888
23-0.025532-0.26530.395628
24-0.054333-0.56460.286744
25-0.004577-0.04760.481073
260.0396310.41190.34063
270.0676880.70340.241648
28-0.054954-0.57110.284559
290.0587010.610.271559
30-0.021185-0.22020.413081
31-0.001648-0.01710.493185
32-0.026002-0.27020.393751
330.0384970.40010.344948
340.0433360.45040.326675
350.0541180.56240.287502
36-0.000222-0.00230.499081
37-0.059304-0.61630.269496
38-0.029251-0.3040.380863
39-0.018535-0.19260.423808
40-0.015301-0.1590.436979
41-0.097015-1.00820.157804
42-0.103991-1.08070.141117
43-7.3e-05-8e-040.499697
440.0028580.02970.48818
450.0950270.98760.162789
46-0.058707-0.61010.271537
47-0.096262-1.00040.159682
48-0.048194-0.50080.30875

\begin{tabular}{lllllllll}
\hline
Partial Autocorrelation Function \tabularnewline
Time lag k & PACF(k) & T-STAT & P-value \tabularnewline
1 & -0.10469 & -1.088 & 0.139515 \tabularnewline
2 & -0.048605 & -0.5051 & 0.307253 \tabularnewline
3 & -0.219221 & -2.2782 & 0.012341 \tabularnewline
4 & -0.017877 & -0.1858 & 0.426483 \tabularnewline
5 & -0.122385 & -1.2719 & 0.103076 \tabularnewline
6 & -0.109925 & -1.1424 & 0.127912 \tabularnewline
7 & -0.12925 & -1.3432 & 0.091011 \tabularnewline
8 & -0.029153 & -0.303 & 0.381248 \tabularnewline
9 & -0.292696 & -3.0418 & 0.001476 \tabularnewline
10 & -0.173887 & -1.8071 & 0.036766 \tabularnewline
11 & -0.224005 & -2.3279 & 0.01089 \tabularnewline
12 & 0.779017 & 8.0958 & 0 \tabularnewline
13 & -0.010151 & -0.1055 & 0.45809 \tabularnewline
14 & -0.083348 & -0.8662 & 0.194156 \tabularnewline
15 & 0.002632 & 0.0274 & 0.489114 \tabularnewline
16 & -0.020259 & -0.2105 & 0.41682 \tabularnewline
17 & 0.035095 & 0.3647 & 0.358016 \tabularnewline
18 & 0.015704 & 0.1632 & 0.435333 \tabularnewline
19 & -0.06631 & -0.6891 & 0.246116 \tabularnewline
20 & -0.024251 & -0.252 & 0.400751 \tabularnewline
21 & 0.007773 & 0.0808 & 0.467885 \tabularnewline
22 & 0.041679 & 0.4331 & 0.332888 \tabularnewline
23 & -0.025532 & -0.2653 & 0.395628 \tabularnewline
24 & -0.054333 & -0.5646 & 0.286744 \tabularnewline
25 & -0.004577 & -0.0476 & 0.481073 \tabularnewline
26 & 0.039631 & 0.4119 & 0.34063 \tabularnewline
27 & 0.067688 & 0.7034 & 0.241648 \tabularnewline
28 & -0.054954 & -0.5711 & 0.284559 \tabularnewline
29 & 0.058701 & 0.61 & 0.271559 \tabularnewline
30 & -0.021185 & -0.2202 & 0.413081 \tabularnewline
31 & -0.001648 & -0.0171 & 0.493185 \tabularnewline
32 & -0.026002 & -0.2702 & 0.393751 \tabularnewline
33 & 0.038497 & 0.4001 & 0.344948 \tabularnewline
34 & 0.043336 & 0.4504 & 0.326675 \tabularnewline
35 & 0.054118 & 0.5624 & 0.287502 \tabularnewline
36 & -0.000222 & -0.0023 & 0.499081 \tabularnewline
37 & -0.059304 & -0.6163 & 0.269496 \tabularnewline
38 & -0.029251 & -0.304 & 0.380863 \tabularnewline
39 & -0.018535 & -0.1926 & 0.423808 \tabularnewline
40 & -0.015301 & -0.159 & 0.436979 \tabularnewline
41 & -0.097015 & -1.0082 & 0.157804 \tabularnewline
42 & -0.103991 & -1.0807 & 0.141117 \tabularnewline
43 & -7.3e-05 & -8e-04 & 0.499697 \tabularnewline
44 & 0.002858 & 0.0297 & 0.48818 \tabularnewline
45 & 0.095027 & 0.9876 & 0.162789 \tabularnewline
46 & -0.058707 & -0.6101 & 0.271537 \tabularnewline
47 & -0.096262 & -1.0004 & 0.159682 \tabularnewline
48 & -0.048194 & -0.5008 & 0.30875 \tabularnewline
\hline
\end{tabular}
%Source: https://freestatistics.org/blog/index.php?pk=123428&T=2

[TABLE]
[ROW][C]Partial Autocorrelation Function[/C][/ROW]
[ROW][C]Time lag k[/C][C]PACF(k)[/C][C]T-STAT[/C][C]P-value[/C][/ROW]
[ROW][C]1[/C][C]-0.10469[/C][C]-1.088[/C][C]0.139515[/C][/ROW]
[ROW][C]2[/C][C]-0.048605[/C][C]-0.5051[/C][C]0.307253[/C][/ROW]
[ROW][C]3[/C][C]-0.219221[/C][C]-2.2782[/C][C]0.012341[/C][/ROW]
[ROW][C]4[/C][C]-0.017877[/C][C]-0.1858[/C][C]0.426483[/C][/ROW]
[ROW][C]5[/C][C]-0.122385[/C][C]-1.2719[/C][C]0.103076[/C][/ROW]
[ROW][C]6[/C][C]-0.109925[/C][C]-1.1424[/C][C]0.127912[/C][/ROW]
[ROW][C]7[/C][C]-0.12925[/C][C]-1.3432[/C][C]0.091011[/C][/ROW]
[ROW][C]8[/C][C]-0.029153[/C][C]-0.303[/C][C]0.381248[/C][/ROW]
[ROW][C]9[/C][C]-0.292696[/C][C]-3.0418[/C][C]0.001476[/C][/ROW]
[ROW][C]10[/C][C]-0.173887[/C][C]-1.8071[/C][C]0.036766[/C][/ROW]
[ROW][C]11[/C][C]-0.224005[/C][C]-2.3279[/C][C]0.01089[/C][/ROW]
[ROW][C]12[/C][C]0.779017[/C][C]8.0958[/C][C]0[/C][/ROW]
[ROW][C]13[/C][C]-0.010151[/C][C]-0.1055[/C][C]0.45809[/C][/ROW]
[ROW][C]14[/C][C]-0.083348[/C][C]-0.8662[/C][C]0.194156[/C][/ROW]
[ROW][C]15[/C][C]0.002632[/C][C]0.0274[/C][C]0.489114[/C][/ROW]
[ROW][C]16[/C][C]-0.020259[/C][C]-0.2105[/C][C]0.41682[/C][/ROW]
[ROW][C]17[/C][C]0.035095[/C][C]0.3647[/C][C]0.358016[/C][/ROW]
[ROW][C]18[/C][C]0.015704[/C][C]0.1632[/C][C]0.435333[/C][/ROW]
[ROW][C]19[/C][C]-0.06631[/C][C]-0.6891[/C][C]0.246116[/C][/ROW]
[ROW][C]20[/C][C]-0.024251[/C][C]-0.252[/C][C]0.400751[/C][/ROW]
[ROW][C]21[/C][C]0.007773[/C][C]0.0808[/C][C]0.467885[/C][/ROW]
[ROW][C]22[/C][C]0.041679[/C][C]0.4331[/C][C]0.332888[/C][/ROW]
[ROW][C]23[/C][C]-0.025532[/C][C]-0.2653[/C][C]0.395628[/C][/ROW]
[ROW][C]24[/C][C]-0.054333[/C][C]-0.5646[/C][C]0.286744[/C][/ROW]
[ROW][C]25[/C][C]-0.004577[/C][C]-0.0476[/C][C]0.481073[/C][/ROW]
[ROW][C]26[/C][C]0.039631[/C][C]0.4119[/C][C]0.34063[/C][/ROW]
[ROW][C]27[/C][C]0.067688[/C][C]0.7034[/C][C]0.241648[/C][/ROW]
[ROW][C]28[/C][C]-0.054954[/C][C]-0.5711[/C][C]0.284559[/C][/ROW]
[ROW][C]29[/C][C]0.058701[/C][C]0.61[/C][C]0.271559[/C][/ROW]
[ROW][C]30[/C][C]-0.021185[/C][C]-0.2202[/C][C]0.413081[/C][/ROW]
[ROW][C]31[/C][C]-0.001648[/C][C]-0.0171[/C][C]0.493185[/C][/ROW]
[ROW][C]32[/C][C]-0.026002[/C][C]-0.2702[/C][C]0.393751[/C][/ROW]
[ROW][C]33[/C][C]0.038497[/C][C]0.4001[/C][C]0.344948[/C][/ROW]
[ROW][C]34[/C][C]0.043336[/C][C]0.4504[/C][C]0.326675[/C][/ROW]
[ROW][C]35[/C][C]0.054118[/C][C]0.5624[/C][C]0.287502[/C][/ROW]
[ROW][C]36[/C][C]-0.000222[/C][C]-0.0023[/C][C]0.499081[/C][/ROW]
[ROW][C]37[/C][C]-0.059304[/C][C]-0.6163[/C][C]0.269496[/C][/ROW]
[ROW][C]38[/C][C]-0.029251[/C][C]-0.304[/C][C]0.380863[/C][/ROW]
[ROW][C]39[/C][C]-0.018535[/C][C]-0.1926[/C][C]0.423808[/C][/ROW]
[ROW][C]40[/C][C]-0.015301[/C][C]-0.159[/C][C]0.436979[/C][/ROW]
[ROW][C]41[/C][C]-0.097015[/C][C]-1.0082[/C][C]0.157804[/C][/ROW]
[ROW][C]42[/C][C]-0.103991[/C][C]-1.0807[/C][C]0.141117[/C][/ROW]
[ROW][C]43[/C][C]-7.3e-05[/C][C]-8e-04[/C][C]0.499697[/C][/ROW]
[ROW][C]44[/C][C]0.002858[/C][C]0.0297[/C][C]0.48818[/C][/ROW]
[ROW][C]45[/C][C]0.095027[/C][C]0.9876[/C][C]0.162789[/C][/ROW]
[ROW][C]46[/C][C]-0.058707[/C][C]-0.6101[/C][C]0.271537[/C][/ROW]
[ROW][C]47[/C][C]-0.096262[/C][C]-1.0004[/C][C]0.159682[/C][/ROW]
[ROW][C]48[/C][C]-0.048194[/C][C]-0.5008[/C][C]0.30875[/C][/ROW]
[/TABLE]
Source: https://freestatistics.org/blog/index.php?pk=123428&T=2

Globally Unique Identifier (entire table): ba.freestatistics.org/blog/index.php?pk=123428&T=2

As an alternative you can also use a QR Code:  

The GUIDs for individual cells are displayed in the table below:

Partial Autocorrelation Function
Time lag kPACF(k)T-STATP-value
1-0.10469-1.0880.139515
2-0.048605-0.50510.307253
3-0.219221-2.27820.012341
4-0.017877-0.18580.426483
5-0.122385-1.27190.103076
6-0.109925-1.14240.127912
7-0.12925-1.34320.091011
8-0.029153-0.3030.381248
9-0.292696-3.04180.001476
10-0.173887-1.80710.036766
11-0.224005-2.32790.01089
120.7790178.09580
13-0.010151-0.10550.45809
14-0.083348-0.86620.194156
150.0026320.02740.489114
16-0.020259-0.21050.41682
170.0350950.36470.358016
180.0157040.16320.435333
19-0.06631-0.68910.246116
20-0.024251-0.2520.400751
210.0077730.08080.467885
220.0416790.43310.332888
23-0.025532-0.26530.395628
24-0.054333-0.56460.286744
25-0.004577-0.04760.481073
260.0396310.41190.34063
270.0676880.70340.241648
28-0.054954-0.57110.284559
290.0587010.610.271559
30-0.021185-0.22020.413081
31-0.001648-0.01710.493185
32-0.026002-0.27020.393751
330.0384970.40010.344948
340.0433360.45040.326675
350.0541180.56240.287502
36-0.000222-0.00230.499081
37-0.059304-0.61630.269496
38-0.029251-0.3040.380863
39-0.018535-0.19260.423808
40-0.015301-0.1590.436979
41-0.097015-1.00820.157804
42-0.103991-1.08070.141117
43-7.3e-05-8e-040.499697
440.0028580.02970.48818
450.0950270.98760.162789
46-0.058707-0.61010.271537
47-0.096262-1.00040.159682
48-0.048194-0.50080.30875


Parameters (Session):
par1 = 48 ; par2 = 1 ; par3 = 0 ; par4 = 0 ; par5 = 12 ; par6 = White Noise ; par7 = 0.95 ;
Parameters (R input):
par1 = 48 ; par2 = 1 ; par3 = 0 ; par4 = 0 ; par5 = 12 ; par6 = White Noise ; par7 = 0.95 ; par8 = ;
R code (references can be found in the software module):
if (par1 == 'Default') {
par1 = 10*log10(length(x))
} else {
par1 <- as.numeric(par1)
}
par2 <- as.numeric(par2)
par3 <- as.numeric(par3)
par4 <- as.numeric(par4)
par5 <- as.numeric(par5)
if (par6 == 'White Noise') par6 <- 'white' else par6 <- 'ma'
par7 <- as.numeric(par7)
if (par8 != '') par8 <- as.numeric(par8)
ox <- x
if (par8 == '') {
if (par2 == 0) {
x <- log(x)
} else {
x <- (x ^ par2 - 1) / par2
}
} else {
x <- log(x,base=par8)
}
if (par3 > 0) x <- diff(x,lag=1,difference=par3)
if (par4 > 0) x <- diff(x,lag=par5,difference=par4)
bitmap(file='picts.png')
op <- par(mfrow=c(2,1))
plot(ox,type='l',main='Original Time Series',xlab='time',ylab='value')
if (par8=='') {
mytitle <- paste('Working Time Series (lambda=',par2,', d=',par3,', D=',par4,')',sep='')
mysub <- paste('(lambda=',par2,', d=',par3,', D=',par4,', CI=', par7, ', CI type=',par6,')',sep='')
} else {
mytitle <- paste('Working Time Series (base=',par8,', d=',par3,', D=',par4,')',sep='')
mysub <- paste('(base=',par8,', d=',par3,', D=',par4,', CI=', par7, ', CI type=',par6,')',sep='')
}
plot(x,type='l', main=mytitle,xlab='time',ylab='value')
par(op)
dev.off()
bitmap(file='pic1.png')
racf <- acf(x, par1, main='Autocorrelation', xlab='time lag', ylab='ACF', ci.type=par6, ci=par7, sub=mysub)
dev.off()
bitmap(file='pic2.png')
rpacf <- pacf(x,par1,main='Partial Autocorrelation',xlab='lags',ylab='PACF',sub=mysub)
dev.off()
(myacf <- c(racf$acf))
(mypacf <- c(rpacf$acf))
lengthx <- length(x)
sqrtn <- sqrt(lengthx)
load(file='createtable')
a<-table.start()
a<-table.row.start(a)
a<-table.element(a,'Autocorrelation Function',4,TRUE)
a<-table.row.end(a)
a<-table.row.start(a)
a<-table.element(a,'Time lag k',header=TRUE)
a<-table.element(a,hyperlink('basics.htm','ACF(k)','click here for more information about the Autocorrelation Function'),header=TRUE)
a<-table.element(a,'T-STAT',header=TRUE)
a<-table.element(a,'P-value',header=TRUE)
a<-table.row.end(a)
for (i in 2:(par1+1)) {
a<-table.row.start(a)
a<-table.element(a,i-1,header=TRUE)
a<-table.element(a,round(myacf[i],6))
mytstat <- myacf[i]*sqrtn
a<-table.element(a,round(mytstat,4))
a<-table.element(a,round(1-pt(abs(mytstat),lengthx),6))
a<-table.row.end(a)
}
a<-table.end(a)
table.save(a,file='mytable.tab')
a<-table.start()
a<-table.row.start(a)
a<-table.element(a,'Partial Autocorrelation Function',4,TRUE)
a<-table.row.end(a)
a<-table.row.start(a)
a<-table.element(a,'Time lag k',header=TRUE)
a<-table.element(a,hyperlink('basics.htm','PACF(k)','click here for more information about the Partial Autocorrelation Function'),header=TRUE)
a<-table.element(a,'T-STAT',header=TRUE)
a<-table.element(a,'P-value',header=TRUE)
a<-table.row.end(a)
for (i in 1:par1) {
a<-table.row.start(a)
a<-table.element(a,i,header=TRUE)
a<-table.element(a,round(mypacf[i],6))
mytstat <- mypacf[i]*sqrtn
a<-table.element(a,round(mytstat,4))
a<-table.element(a,round(1-pt(abs(mytstat),lengthx),6))
a<-table.row.end(a)
}
a<-table.end(a)
table.save(a,file='mytable1.tab')