Free Statistics

of Irreproducible Research!

Author's title

Author*Unverified author*
R Software Modulerwasp_smp.wasp
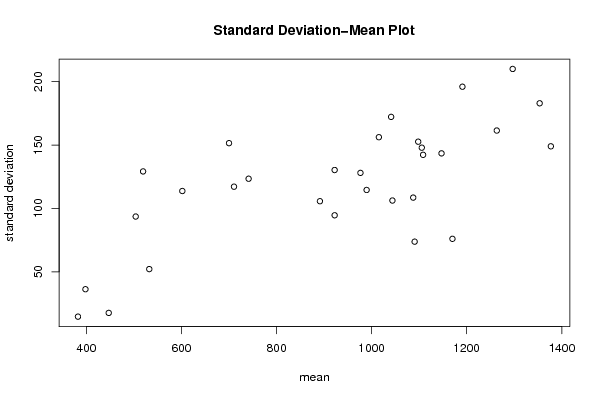
Title produced by softwareStandard Deviation-Mean Plot
Date of computationFri, 05 Aug 2011 09:14:39 -0400
Cite this page as followsStatistical Computations at FreeStatistics.org, Office for Research Development and Education, URL https://freestatistics.org/blog/index.php?v=date/2011/Aug/05/t13125501393ekrwh37v3wfyvy.htm/, Retrieved Mon, 13 May 2024 20:43:20 +0000
Statistical Computations at FreeStatistics.org, Office for Research Development and Education, URL https://freestatistics.org/blog/index.php?pk=123417, Retrieved Mon, 13 May 2024 20:43:20 +0000
QR Codes:

Original text written by user:
IsPrivate?No (this computation is public)
User-defined keywordsVan Vlaenderen Lynn
Estimated Impact176
Family? (F = Feedback message, R = changed R code, M = changed R Module, P = changed Parameters, D = changed Data)
-       [Standard Deviation-Mean Plot] [tijdreeksA- stap27] [2011-08-05 13:14:39] [d08a5fa9e4c562ec79e796d78c067f4f] [Current]
Feedback Forum

Post a new message
Dataseries X:
465
455
444
424
630
620
465
362
372
372
382
403
434
424
362
372
661
723
558
465
486
496
548
599
610
506
517
382
765
878
620
537
589
651
744
858
858
785
754
568
878
1023
899
765
785
858
961
1085
1002
951
951
785
1023
1178
1054
920
961
1126
1199
1302
1219
1085
1054
806
971
1147
951
837
951
1064
1126
1292
1209
1002
1023
827
992
1137
971
858
961
1085
1064
1312
1271
1106
1116
899
1033
1240
1085
992
1147
1240
1168
1498
1416
1230
1178
940
1075
1199
1044
1044
1219
1312
1261
1622
1529
1354
1281
1023
1116
1281
1157
1126
1271
1395
1261
1581


Summary of computational transaction
Raw Inputview raw input (R code)
Raw Outputview raw output of R engine
Computing time1 seconds
R Server'Gertrude Mary Cox' @ cox.wessa.net

\begin{tabular}{lllllllll}
\hline
Summary of computational transaction \tabularnewline
Raw Input & view raw input (R code)  \tabularnewline
Raw Output & view raw output of R engine  \tabularnewline
Computing time & 1 seconds \tabularnewline
R Server & 'Gertrude Mary Cox' @ cox.wessa.net \tabularnewline
\hline
\end{tabular}
%Source: https://freestatistics.org/blog/index.php?pk=123417&T=0

[TABLE]
[ROW][C]Summary of computational transaction[/C][/ROW]
[ROW][C]Raw Input[/C][C]view raw input (R code) [/C][/ROW]
[ROW][C]Raw Output[/C][C]view raw output of R engine [/C][/ROW]
[ROW][C]Computing time[/C][C]1 seconds[/C][/ROW]
[ROW][C]R Server[/C][C]'Gertrude Mary Cox' @ cox.wessa.net[/C][/ROW]
[/TABLE]
Source: https://freestatistics.org/blog/index.php?pk=123417&T=0

Globally Unique Identifier (entire table): ba.freestatistics.org/blog/index.php?pk=123417&T=0

As an alternative you can also use a QR Code:  

The GUIDs for individual cells are displayed in the table below:

Summary of computational transaction
Raw Inputview raw input (R code)
Raw Outputview raw output of R engine
Computing time1 seconds
R Server'Gertrude Mary Cox' @ cox.wessa.net


Standard Deviation-Mean Plot
SectionMeanStandard DeviationRange
144717.568911937472641
2519.25129.211390106807268
3382.2514.614490525958631
439836.258332375699172
5601.75113.764010126226258
6532.2552.1432322230476113
7503.7593.6175731366713228
8700151.523375534382341
9710.5117.16228061966269
10741.25123.454107532583290
11891.25105.724090600645258
12922.25130.326193325312300
13922.2594.6057609239522217
141043.75106.258725131947258
151147143.487513974794341
161041172.253688881641413
17976.5128.076799876741310
181108.25142.31976906483341
191015.25156.218596844294382
20989.5114.596393195132279
211105.5147.947062604613351
221098152.663027613106372
231087.5108.555669282324248
241263.25161.487615624233351
251191196.057814602394476
261090.573.7947604282761155
271353.5182.994535437537403
281296.75210.083118471396506
29117076.030695555589165
301377149.032434948459320

\begin{tabular}{lllllllll}
\hline
Standard Deviation-Mean Plot \tabularnewline
Section & Mean & Standard Deviation & Range \tabularnewline
1 & 447 & 17.5689119374726 & 41 \tabularnewline
2 & 519.25 & 129.211390106807 & 268 \tabularnewline
3 & 382.25 & 14.6144905259586 & 31 \tabularnewline
4 & 398 & 36.2583323756991 & 72 \tabularnewline
5 & 601.75 & 113.764010126226 & 258 \tabularnewline
6 & 532.25 & 52.1432322230476 & 113 \tabularnewline
7 & 503.75 & 93.6175731366713 & 228 \tabularnewline
8 & 700 & 151.523375534382 & 341 \tabularnewline
9 & 710.5 & 117.16228061966 & 269 \tabularnewline
10 & 741.25 & 123.454107532583 & 290 \tabularnewline
11 & 891.25 & 105.724090600645 & 258 \tabularnewline
12 & 922.25 & 130.326193325312 & 300 \tabularnewline
13 & 922.25 & 94.6057609239522 & 217 \tabularnewline
14 & 1043.75 & 106.258725131947 & 258 \tabularnewline
15 & 1147 & 143.487513974794 & 341 \tabularnewline
16 & 1041 & 172.253688881641 & 413 \tabularnewline
17 & 976.5 & 128.076799876741 & 310 \tabularnewline
18 & 1108.25 & 142.31976906483 & 341 \tabularnewline
19 & 1015.25 & 156.218596844294 & 382 \tabularnewline
20 & 989.5 & 114.596393195132 & 279 \tabularnewline
21 & 1105.5 & 147.947062604613 & 351 \tabularnewline
22 & 1098 & 152.663027613106 & 372 \tabularnewline
23 & 1087.5 & 108.555669282324 & 248 \tabularnewline
24 & 1263.25 & 161.487615624233 & 351 \tabularnewline
25 & 1191 & 196.057814602394 & 476 \tabularnewline
26 & 1090.5 & 73.7947604282761 & 155 \tabularnewline
27 & 1353.5 & 182.994535437537 & 403 \tabularnewline
28 & 1296.75 & 210.083118471396 & 506 \tabularnewline
29 & 1170 & 76.030695555589 & 165 \tabularnewline
30 & 1377 & 149.032434948459 & 320 \tabularnewline
\hline
\end{tabular}
%Source: https://freestatistics.org/blog/index.php?pk=123417&T=1

[TABLE]
[ROW][C]Standard Deviation-Mean Plot[/C][/ROW]
[ROW][C]Section[/C][C]Mean[/C][C]Standard Deviation[/C][C]Range[/C][/ROW]
[ROW][C]1[/C][C]447[/C][C]17.5689119374726[/C][C]41[/C][/ROW]
[ROW][C]2[/C][C]519.25[/C][C]129.211390106807[/C][C]268[/C][/ROW]
[ROW][C]3[/C][C]382.25[/C][C]14.6144905259586[/C][C]31[/C][/ROW]
[ROW][C]4[/C][C]398[/C][C]36.2583323756991[/C][C]72[/C][/ROW]
[ROW][C]5[/C][C]601.75[/C][C]113.764010126226[/C][C]258[/C][/ROW]
[ROW][C]6[/C][C]532.25[/C][C]52.1432322230476[/C][C]113[/C][/ROW]
[ROW][C]7[/C][C]503.75[/C][C]93.6175731366713[/C][C]228[/C][/ROW]
[ROW][C]8[/C][C]700[/C][C]151.523375534382[/C][C]341[/C][/ROW]
[ROW][C]9[/C][C]710.5[/C][C]117.16228061966[/C][C]269[/C][/ROW]
[ROW][C]10[/C][C]741.25[/C][C]123.454107532583[/C][C]290[/C][/ROW]
[ROW][C]11[/C][C]891.25[/C][C]105.724090600645[/C][C]258[/C][/ROW]
[ROW][C]12[/C][C]922.25[/C][C]130.326193325312[/C][C]300[/C][/ROW]
[ROW][C]13[/C][C]922.25[/C][C]94.6057609239522[/C][C]217[/C][/ROW]
[ROW][C]14[/C][C]1043.75[/C][C]106.258725131947[/C][C]258[/C][/ROW]
[ROW][C]15[/C][C]1147[/C][C]143.487513974794[/C][C]341[/C][/ROW]
[ROW][C]16[/C][C]1041[/C][C]172.253688881641[/C][C]413[/C][/ROW]
[ROW][C]17[/C][C]976.5[/C][C]128.076799876741[/C][C]310[/C][/ROW]
[ROW][C]18[/C][C]1108.25[/C][C]142.31976906483[/C][C]341[/C][/ROW]
[ROW][C]19[/C][C]1015.25[/C][C]156.218596844294[/C][C]382[/C][/ROW]
[ROW][C]20[/C][C]989.5[/C][C]114.596393195132[/C][C]279[/C][/ROW]
[ROW][C]21[/C][C]1105.5[/C][C]147.947062604613[/C][C]351[/C][/ROW]
[ROW][C]22[/C][C]1098[/C][C]152.663027613106[/C][C]372[/C][/ROW]
[ROW][C]23[/C][C]1087.5[/C][C]108.555669282324[/C][C]248[/C][/ROW]
[ROW][C]24[/C][C]1263.25[/C][C]161.487615624233[/C][C]351[/C][/ROW]
[ROW][C]25[/C][C]1191[/C][C]196.057814602394[/C][C]476[/C][/ROW]
[ROW][C]26[/C][C]1090.5[/C][C]73.7947604282761[/C][C]155[/C][/ROW]
[ROW][C]27[/C][C]1353.5[/C][C]182.994535437537[/C][C]403[/C][/ROW]
[ROW][C]28[/C][C]1296.75[/C][C]210.083118471396[/C][C]506[/C][/ROW]
[ROW][C]29[/C][C]1170[/C][C]76.030695555589[/C][C]165[/C][/ROW]
[ROW][C]30[/C][C]1377[/C][C]149.032434948459[/C][C]320[/C][/ROW]
[/TABLE]
Source: https://freestatistics.org/blog/index.php?pk=123417&T=1

Globally Unique Identifier (entire table): ba.freestatistics.org/blog/index.php?pk=123417&T=1

As an alternative you can also use a QR Code:  

The GUIDs for individual cells are displayed in the table below:

Standard Deviation-Mean Plot
SectionMeanStandard DeviationRange
144717.568911937472641
2519.25129.211390106807268
3382.2514.614490525958631
439836.258332375699172
5601.75113.764010126226258
6532.2552.1432322230476113
7503.7593.6175731366713228
8700151.523375534382341
9710.5117.16228061966269
10741.25123.454107532583290
11891.25105.724090600645258
12922.25130.326193325312300
13922.2594.6057609239522217
141043.75106.258725131947258
151147143.487513974794341
161041172.253688881641413
17976.5128.076799876741310
181108.25142.31976906483341
191015.25156.218596844294382
20989.5114.596393195132279
211105.5147.947062604613351
221098152.663027613106372
231087.5108.555669282324248
241263.25161.487615624233351
251191196.057814602394476
261090.573.7947604282761155
271353.5182.994535437537403
281296.75210.083118471396506
29117076.030695555589165
301377149.032434948459320


Regression: S.E.(k) = alpha + beta * Mean(k)
alpha13.3108112881255
beta0.11592368174408
S.D.0.0217275349949884
T-STAT5.33533517588712
p-value1.10953944042437e-05

\begin{tabular}{lllllllll}
\hline
Regression: S.E.(k) = alpha + beta * Mean(k) \tabularnewline
alpha & 13.3108112881255 \tabularnewline
beta & 0.11592368174408 \tabularnewline
S.D. & 0.0217275349949884 \tabularnewline
T-STAT & 5.33533517588712 \tabularnewline
p-value & 1.10953944042437e-05 \tabularnewline
\hline
\end{tabular}
%Source: https://freestatistics.org/blog/index.php?pk=123417&T=2

[TABLE]
[ROW][C]Regression: S.E.(k) = alpha + beta * Mean(k)[/C][/ROW]
[ROW][C]alpha[/C][C]13.3108112881255[/C][/ROW]
[ROW][C]beta[/C][C]0.11592368174408[/C][/ROW]
[ROW][C]S.D.[/C][C]0.0217275349949884[/C][/ROW]
[ROW][C]T-STAT[/C][C]5.33533517588712[/C][/ROW]
[ROW][C]p-value[/C][C]1.10953944042437e-05[/C][/ROW]
[/TABLE]
Source: https://freestatistics.org/blog/index.php?pk=123417&T=2

Globally Unique Identifier (entire table): ba.freestatistics.org/blog/index.php?pk=123417&T=2

As an alternative you can also use a QR Code:  

The GUIDs for individual cells are displayed in the table below:

Regression: S.E.(k) = alpha + beta * Mean(k)
alpha13.3108112881255
beta0.11592368174408
S.D.0.0217275349949884
T-STAT5.33533517588712
p-value1.10953944042437e-05


Regression: ln S.E.(k) = alpha + beta * ln Mean(k)
alpha-3.78668445658898
beta1.24768186124492
S.D.0.210485190233045
T-STAT5.92764678533204
p-value2.22373946848878e-06
Lambda-0.247681861244915

\begin{tabular}{lllllllll}
\hline
Regression: ln S.E.(k) = alpha + beta * ln Mean(k) \tabularnewline
alpha & -3.78668445658898 \tabularnewline
beta & 1.24768186124492 \tabularnewline
S.D. & 0.210485190233045 \tabularnewline
T-STAT & 5.92764678533204 \tabularnewline
p-value & 2.22373946848878e-06 \tabularnewline
Lambda & -0.247681861244915 \tabularnewline
\hline
\end{tabular}
%Source: https://freestatistics.org/blog/index.php?pk=123417&T=3

[TABLE]
[ROW][C]Regression: ln S.E.(k) = alpha + beta * ln Mean(k)[/C][/ROW]
[ROW][C]alpha[/C][C]-3.78668445658898[/C][/ROW]
[ROW][C]beta[/C][C]1.24768186124492[/C][/ROW]
[ROW][C]S.D.[/C][C]0.210485190233045[/C][/ROW]
[ROW][C]T-STAT[/C][C]5.92764678533204[/C][/ROW]
[ROW][C]p-value[/C][C]2.22373946848878e-06[/C][/ROW]
[ROW][C]Lambda[/C][C]-0.247681861244915[/C][/ROW]
[/TABLE]
Source: https://freestatistics.org/blog/index.php?pk=123417&T=3

Globally Unique Identifier (entire table): ba.freestatistics.org/blog/index.php?pk=123417&T=3

As an alternative you can also use a QR Code:  

The GUIDs for individual cells are displayed in the table below:

Regression: ln S.E.(k) = alpha + beta * ln Mean(k)
alpha-3.78668445658898
beta1.24768186124492
S.D.0.210485190233045
T-STAT5.92764678533204
p-value2.22373946848878e-06
Lambda-0.247681861244915


Parameters (Session):
par1 = grey ;
Parameters (R input):
par1 = 4 ;
R code (references can be found in the software module):
par1 <- as.numeric(par1)
(n <- length(x))
(np <- floor(n / par1))
arr <- array(NA,dim=c(par1,np))
j <- 0
k <- 1
for (i in 1:(np*par1))
{
j = j + 1
arr[j,k] <- x[i]
if (j == par1) {
j = 0
k=k+1
}
}
arr
arr.mean <- array(NA,dim=np)
arr.sd <- array(NA,dim=np)
arr.range <- array(NA,dim=np)
for (j in 1:np)
{
arr.mean[j] <- mean(arr[,j],na.rm=TRUE)
arr.sd[j] <- sd(arr[,j],na.rm=TRUE)
arr.range[j] <- max(arr[,j],na.rm=TRUE) - min(arr[,j],na.rm=TRUE)
}
arr.mean
arr.sd
arr.range
(lm1 <- lm(arr.sd~arr.mean))
(lnlm1 <- lm(log(arr.sd)~log(arr.mean)))
(lm2 <- lm(arr.range~arr.mean))
bitmap(file='test1.png')
plot(arr.mean,arr.sd,main='Standard Deviation-Mean Plot',xlab='mean',ylab='standard deviation')
dev.off()
bitmap(file='test2.png')
plot(arr.mean,arr.range,main='Range-Mean Plot',xlab='mean',ylab='range')
dev.off()
load(file='createtable')
a<-table.start()
a<-table.row.start(a)
a<-table.element(a,'Standard Deviation-Mean Plot',4,TRUE)
a<-table.row.end(a)
a<-table.row.start(a)
a<-table.element(a,'Section',header=TRUE)
a<-table.element(a,'Mean',header=TRUE)
a<-table.element(a,'Standard Deviation',header=TRUE)
a<-table.element(a,'Range',header=TRUE)
a<-table.row.end(a)
for (j in 1:np) {
a<-table.row.start(a)
a<-table.element(a,j,header=TRUE)
a<-table.element(a,arr.mean[j])
a<-table.element(a,arr.sd[j] )
a<-table.element(a,arr.range[j] )
a<-table.row.end(a)
}
a<-table.end(a)
table.save(a,file='mytable.tab')
a<-table.start()
a<-table.row.start(a)
a<-table.element(a,'Regression: S.E.(k) = alpha + beta * Mean(k)',2,TRUE)
a<-table.row.end(a)
a<-table.row.start(a)
a<-table.element(a,'alpha',header=TRUE)
a<-table.element(a,lm1$coefficients[[1]])
a<-table.row.end(a)
a<-table.row.start(a)
a<-table.element(a,'beta',header=TRUE)
a<-table.element(a,lm1$coefficients[[2]])
a<-table.row.end(a)
a<-table.row.start(a)
a<-table.element(a,'S.D.',header=TRUE)
a<-table.element(a,summary(lm1)$coefficients[2,2])
a<-table.row.end(a)
a<-table.row.start(a)
a<-table.element(a,'T-STAT',header=TRUE)
a<-table.element(a,summary(lm1)$coefficients[2,3])
a<-table.row.end(a)
a<-table.row.start(a)
a<-table.element(a,'p-value',header=TRUE)
a<-table.element(a,summary(lm1)$coefficients[2,4])
a<-table.row.end(a)
a<-table.end(a)
table.save(a,file='mytable1.tab')
a<-table.start()
a<-table.row.start(a)
a<-table.element(a,'Regression: ln S.E.(k) = alpha + beta * ln Mean(k)',2,TRUE)
a<-table.row.end(a)
a<-table.row.start(a)
a<-table.element(a,'alpha',header=TRUE)
a<-table.element(a,lnlm1$coefficients[[1]])
a<-table.row.end(a)
a<-table.row.start(a)
a<-table.element(a,'beta',header=TRUE)
a<-table.element(a,lnlm1$coefficients[[2]])
a<-table.row.end(a)
a<-table.row.start(a)
a<-table.element(a,'S.D.',header=TRUE)
a<-table.element(a,summary(lnlm1)$coefficients[2,2])
a<-table.row.end(a)
a<-table.row.start(a)
a<-table.element(a,'T-STAT',header=TRUE)
a<-table.element(a,summary(lnlm1)$coefficients[2,3])
a<-table.row.end(a)
a<-table.row.start(a)
a<-table.element(a,'p-value',header=TRUE)
a<-table.element(a,summary(lnlm1)$coefficients[2,4])
a<-table.row.end(a)
a<-table.row.start(a)
a<-table.element(a,'Lambda',header=TRUE)
a<-table.element(a,1-lnlm1$coefficients[[2]])
a<-table.row.end(a)
a<-table.end(a)
table.save(a,file='mytable2.tab')