Free Statistics

of Irreproducible Research!

Author's title

Author*Unverified author*
R Software Modulerwasp_smp.wasp
Title produced by softwareStandard Deviation-Mean Plot
Date of computationThu, 04 Aug 2011 06:22:06 -0400
Cite this page as followsStatistical Computations at FreeStatistics.org, Office for Research Development and Education, URL https://freestatistics.org/blog/index.php?v=date/2011/Aug/04/t1312453374qdvgzwp201fgm3b.htm/, Retrieved Wed, 15 May 2024 16:40:08 +0000
Statistical Computations at FreeStatistics.org, Office for Research Development and Education, URL https://freestatistics.org/blog/index.php?pk=123380, Retrieved Wed, 15 May 2024 16:40:08 +0000
QR Codes:

Original text written by user:
IsPrivate?No (this computation is public)
User-defined keywordsarnaud blij
Estimated Impact210
Family? (F = Feedback message, R = changed R code, M = changed R Module, P = changed Parameters, D = changed Data)
-       [Standard Deviation-Mean Plot] [Tijdreeks A: Stap 26] [2011-08-04 10:22:06] [50083fea611f0183deb36cab794727ad] [Current]
Feedback Forum

Post a new message
Dataseries X:
588264
577918
567562
546859
756344
745987
588264
483527
493873
493873
504229
526055
462824
399492
347630
347630
546859
567562
409838
231412
325803
325803
399492
442021
431664
325803
378790
357986
536412
493873
325803
200263
315447
347630
378790
420195
336150
263595
294755
305101
577918
577918
420195
399492
462824
431664
515709
620447
641250
493873
452367
409838
694135
714939
661953
714939
704481
620447
714939
819676
862205
735641
651596
714939
987746
1071790
1051088
1092483
1082137
977399
1155825
1198354
1260562
1071790
998102
1082137
1282389
1460814
1418286
1418286
1439089
1366423
1555307
1555307
1523124
1344597
1376780
1397583
1534503
1712929
1586355
1649698
1596712
1565653
1807421
1754435
1680746
1576009
1680746
1733732
1796963
1880998
1796963
1848826
1785585
1775239
2037699
2059525
1975491
1828123
1953664
2006549
2069882
2164273
2069882
2143570
2111388
1996193
2237951
2237951


Summary of computational transaction
Raw Inputview raw input (R code)
Raw Outputview raw output of R engine
Computing time0 seconds
R Server'Herman Ole Andreas Wold' @ wold.wessa.net

\begin{tabular}{lllllllll}
\hline
Summary of computational transaction \tabularnewline
Raw Input & view raw input (R code)  \tabularnewline
Raw Output & view raw output of R engine  \tabularnewline
Computing time & 0 seconds \tabularnewline
R Server & 'Herman Ole Andreas Wold' @ wold.wessa.net \tabularnewline
\hline
\end{tabular}
%Source: https://freestatistics.org/blog/index.php?pk=123380&T=0

[TABLE]
[ROW][C]Summary of computational transaction[/C][/ROW]
[ROW][C]Raw Input[/C][C]view raw input (R code) [/C][/ROW]
[ROW][C]Raw Output[/C][C]view raw output of R engine [/C][/ROW]
[ROW][C]Computing time[/C][C]0 seconds[/C][/ROW]
[ROW][C]R Server[/C][C]'Herman Ole Andreas Wold' @ wold.wessa.net[/C][/ROW]
[/TABLE]
Source: https://freestatistics.org/blog/index.php?pk=123380&T=0

Globally Unique Identifier (entire table): ba.freestatistics.org/blog/index.php?pk=123380&T=0

As an alternative you can also use a QR Code:  

The GUIDs for individual cells are displayed in the table below:

Summary of computational transaction
Raw Inputview raw input (R code)
Raw Outputview raw output of R engine
Computing time0 seconds
R Server'Herman Ole Andreas Wold' @ wold.wessa.net


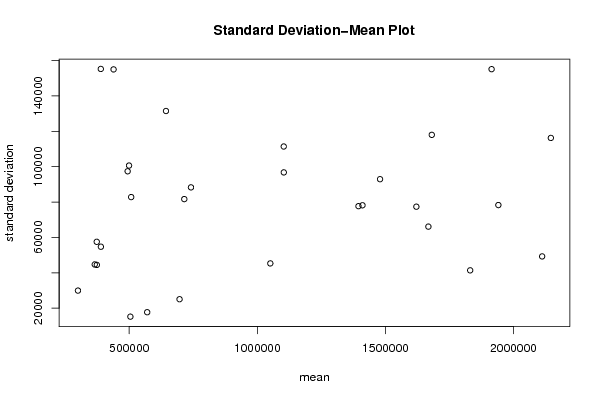
Standard Deviation-Mean Plot
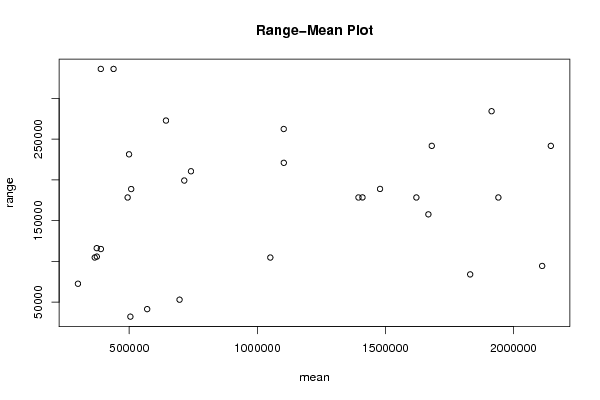
SectionMeanStandard DeviationRange
1570150.7517678.869145112241405
2643530.5131503.772073909272817
3504507.515171.876383625132182
438939454718.6680393447115194
5438917.75155032.173706783336150
6373279.7557505.1449372141116218
7373560.7544447.3780207187105861
8389087.75155289.116436353336149
9365515.544694.5405801052104748
10299900.2529920.098878791672555
11493880.7597405.2439634712178426
1250766182807.7143709047188783
13499332100640.29455773231412
14696491.525027.195787782552986
15714885.7581665.8550736883199229
16741095.2588301.7280932259210609
171050776.7545291.427764166104737
181103428.7596769.4969239619220955
191103147.75111413.068947274262460
201394943.7577668.4896483123178425
211479031.592937.2214257201188884
22141052178169.1676430036178527
231620871.2577365.9205179085178426
241681055.25118017.447310062241768
251667808.2566100.4636008705157723
261830937.541370.623204555884035
271914512155159.001238514284286
281940956.7578289.8184626626178426
292111901.7549250.870262192794391
302145870.75116261.248592341241758

\begin{tabular}{lllllllll}
\hline
Standard Deviation-Mean Plot \tabularnewline
Section & Mean & Standard Deviation & Range \tabularnewline
1 & 570150.75 & 17678.8691451122 & 41405 \tabularnewline
2 & 643530.5 & 131503.772073909 & 272817 \tabularnewline
3 & 504507.5 & 15171.8763836251 & 32182 \tabularnewline
4 & 389394 & 54718.6680393447 & 115194 \tabularnewline
5 & 438917.75 & 155032.173706783 & 336150 \tabularnewline
6 & 373279.75 & 57505.1449372141 & 116218 \tabularnewline
7 & 373560.75 & 44447.3780207187 & 105861 \tabularnewline
8 & 389087.75 & 155289.116436353 & 336149 \tabularnewline
9 & 365515.5 & 44694.5405801052 & 104748 \tabularnewline
10 & 299900.25 & 29920.0988787916 & 72555 \tabularnewline
11 & 493880.75 & 97405.2439634712 & 178426 \tabularnewline
12 & 507661 & 82807.7143709047 & 188783 \tabularnewline
13 & 499332 & 100640.29455773 & 231412 \tabularnewline
14 & 696491.5 & 25027.1957877825 & 52986 \tabularnewline
15 & 714885.75 & 81665.8550736883 & 199229 \tabularnewline
16 & 741095.25 & 88301.7280932259 & 210609 \tabularnewline
17 & 1050776.75 & 45291.427764166 & 104737 \tabularnewline
18 & 1103428.75 & 96769.4969239619 & 220955 \tabularnewline
19 & 1103147.75 & 111413.068947274 & 262460 \tabularnewline
20 & 1394943.75 & 77668.4896483123 & 178425 \tabularnewline
21 & 1479031.5 & 92937.2214257201 & 188884 \tabularnewline
22 & 1410521 & 78169.1676430036 & 178527 \tabularnewline
23 & 1620871.25 & 77365.9205179085 & 178426 \tabularnewline
24 & 1681055.25 & 118017.447310062 & 241768 \tabularnewline
25 & 1667808.25 & 66100.4636008705 & 157723 \tabularnewline
26 & 1830937.5 & 41370.6232045558 & 84035 \tabularnewline
27 & 1914512 & 155159.001238514 & 284286 \tabularnewline
28 & 1940956.75 & 78289.8184626626 & 178426 \tabularnewline
29 & 2111901.75 & 49250.8702621927 & 94391 \tabularnewline
30 & 2145870.75 & 116261.248592341 & 241758 \tabularnewline
\hline
\end{tabular}
%Source: https://freestatistics.org/blog/index.php?pk=123380&T=1

[TABLE]
[ROW][C]Standard Deviation-Mean Plot[/C][/ROW]
[ROW][C]Section[/C][C]Mean[/C][C]Standard Deviation[/C][C]Range[/C][/ROW]
[ROW][C]1[/C][C]570150.75[/C][C]17678.8691451122[/C][C]41405[/C][/ROW]
[ROW][C]2[/C][C]643530.5[/C][C]131503.772073909[/C][C]272817[/C][/ROW]
[ROW][C]3[/C][C]504507.5[/C][C]15171.8763836251[/C][C]32182[/C][/ROW]
[ROW][C]4[/C][C]389394[/C][C]54718.6680393447[/C][C]115194[/C][/ROW]
[ROW][C]5[/C][C]438917.75[/C][C]155032.173706783[/C][C]336150[/C][/ROW]
[ROW][C]6[/C][C]373279.75[/C][C]57505.1449372141[/C][C]116218[/C][/ROW]
[ROW][C]7[/C][C]373560.75[/C][C]44447.3780207187[/C][C]105861[/C][/ROW]
[ROW][C]8[/C][C]389087.75[/C][C]155289.116436353[/C][C]336149[/C][/ROW]
[ROW][C]9[/C][C]365515.5[/C][C]44694.5405801052[/C][C]104748[/C][/ROW]
[ROW][C]10[/C][C]299900.25[/C][C]29920.0988787916[/C][C]72555[/C][/ROW]
[ROW][C]11[/C][C]493880.75[/C][C]97405.2439634712[/C][C]178426[/C][/ROW]
[ROW][C]12[/C][C]507661[/C][C]82807.7143709047[/C][C]188783[/C][/ROW]
[ROW][C]13[/C][C]499332[/C][C]100640.29455773[/C][C]231412[/C][/ROW]
[ROW][C]14[/C][C]696491.5[/C][C]25027.1957877825[/C][C]52986[/C][/ROW]
[ROW][C]15[/C][C]714885.75[/C][C]81665.8550736883[/C][C]199229[/C][/ROW]
[ROW][C]16[/C][C]741095.25[/C][C]88301.7280932259[/C][C]210609[/C][/ROW]
[ROW][C]17[/C][C]1050776.75[/C][C]45291.427764166[/C][C]104737[/C][/ROW]
[ROW][C]18[/C][C]1103428.75[/C][C]96769.4969239619[/C][C]220955[/C][/ROW]
[ROW][C]19[/C][C]1103147.75[/C][C]111413.068947274[/C][C]262460[/C][/ROW]
[ROW][C]20[/C][C]1394943.75[/C][C]77668.4896483123[/C][C]178425[/C][/ROW]
[ROW][C]21[/C][C]1479031.5[/C][C]92937.2214257201[/C][C]188884[/C][/ROW]
[ROW][C]22[/C][C]1410521[/C][C]78169.1676430036[/C][C]178527[/C][/ROW]
[ROW][C]23[/C][C]1620871.25[/C][C]77365.9205179085[/C][C]178426[/C][/ROW]
[ROW][C]24[/C][C]1681055.25[/C][C]118017.447310062[/C][C]241768[/C][/ROW]
[ROW][C]25[/C][C]1667808.25[/C][C]66100.4636008705[/C][C]157723[/C][/ROW]
[ROW][C]26[/C][C]1830937.5[/C][C]41370.6232045558[/C][C]84035[/C][/ROW]
[ROW][C]27[/C][C]1914512[/C][C]155159.001238514[/C][C]284286[/C][/ROW]
[ROW][C]28[/C][C]1940956.75[/C][C]78289.8184626626[/C][C]178426[/C][/ROW]
[ROW][C]29[/C][C]2111901.75[/C][C]49250.8702621927[/C][C]94391[/C][/ROW]
[ROW][C]30[/C][C]2145870.75[/C][C]116261.248592341[/C][C]241758[/C][/ROW]
[/TABLE]
Source: https://freestatistics.org/blog/index.php?pk=123380&T=1

Globally Unique Identifier (entire table): ba.freestatistics.org/blog/index.php?pk=123380&T=1

As an alternative you can also use a QR Code:  

The GUIDs for individual cells are displayed in the table below:

Standard Deviation-Mean Plot
SectionMeanStandard DeviationRange
1570150.7517678.869145112241405
2643530.5131503.772073909272817
3504507.515171.876383625132182
438939454718.6680393447115194
5438917.75155032.173706783336150
6373279.7557505.1449372141116218
7373560.7544447.3780207187105861
8389087.75155289.116436353336149
9365515.544694.5405801052104748
10299900.2529920.098878791672555
11493880.7597405.2439634712178426
1250766182807.7143709047188783
13499332100640.29455773231412
14696491.525027.195787782552986
15714885.7581665.8550736883199229
16741095.2588301.7280932259210609
171050776.7545291.427764166104737
181103428.7596769.4969239619220955
191103147.75111413.068947274262460
201394943.7577668.4896483123178425
211479031.592937.2214257201188884
22141052178169.1676430036178527
231620871.2577365.9205179085178426
241681055.25118017.447310062241768
251667808.2566100.4636008705157723
261830937.541370.623204555884035
271914512155159.001238514284286
281940956.7578289.8184626626178426
292111901.7549250.870262192794391
302145870.75116261.248592341241758


Regression: S.E.(k) = alpha + beta * Mean(k)
alpha68514.6660462397
beta0.010849212200124
S.D.0.0119471013101557
T-STAT0.908104143295545
p-value0.371573285100374

\begin{tabular}{lllllllll}
\hline
Regression: S.E.(k) = alpha + beta * Mean(k) \tabularnewline
alpha & 68514.6660462397 \tabularnewline
beta & 0.010849212200124 \tabularnewline
S.D. & 0.0119471013101557 \tabularnewline
T-STAT & 0.908104143295545 \tabularnewline
p-value & 0.371573285100374 \tabularnewline
\hline
\end{tabular}
%Source: https://freestatistics.org/blog/index.php?pk=123380&T=2

[TABLE]
[ROW][C]Regression: S.E.(k) = alpha + beta * Mean(k)[/C][/ROW]
[ROW][C]alpha[/C][C]68514.6660462397[/C][/ROW]
[ROW][C]beta[/C][C]0.010849212200124[/C][/ROW]
[ROW][C]S.D.[/C][C]0.0119471013101557[/C][/ROW]
[ROW][C]T-STAT[/C][C]0.908104143295545[/C][/ROW]
[ROW][C]p-value[/C][C]0.371573285100374[/C][/ROW]
[/TABLE]
Source: https://freestatistics.org/blog/index.php?pk=123380&T=2

Globally Unique Identifier (entire table): ba.freestatistics.org/blog/index.php?pk=123380&T=2

As an alternative you can also use a QR Code:  

The GUIDs for individual cells are displayed in the table below:

Regression: S.E.(k) = alpha + beta * Mean(k)
alpha68514.6660462397
beta0.010849212200124
S.D.0.0119471013101557
T-STAT0.908104143295545
p-value0.371573285100374


Regression: ln S.E.(k) = alpha + beta * ln Mean(k)
alpha7.84722238963659
beta0.24095085151804
S.D.0.171318514248242
T-STAT1.40644957478968
p-value0.170592819644521
Lambda0.75904914848196

\begin{tabular}{lllllllll}
\hline
Regression: ln S.E.(k) = alpha + beta * ln Mean(k) \tabularnewline
alpha & 7.84722238963659 \tabularnewline
beta & 0.24095085151804 \tabularnewline
S.D. & 0.171318514248242 \tabularnewline
T-STAT & 1.40644957478968 \tabularnewline
p-value & 0.170592819644521 \tabularnewline
Lambda & 0.75904914848196 \tabularnewline
\hline
\end{tabular}
%Source: https://freestatistics.org/blog/index.php?pk=123380&T=3

[TABLE]
[ROW][C]Regression: ln S.E.(k) = alpha + beta * ln Mean(k)[/C][/ROW]
[ROW][C]alpha[/C][C]7.84722238963659[/C][/ROW]
[ROW][C]beta[/C][C]0.24095085151804[/C][/ROW]
[ROW][C]S.D.[/C][C]0.171318514248242[/C][/ROW]
[ROW][C]T-STAT[/C][C]1.40644957478968[/C][/ROW]
[ROW][C]p-value[/C][C]0.170592819644521[/C][/ROW]
[ROW][C]Lambda[/C][C]0.75904914848196[/C][/ROW]
[/TABLE]
Source: https://freestatistics.org/blog/index.php?pk=123380&T=3

Globally Unique Identifier (entire table): ba.freestatistics.org/blog/index.php?pk=123380&T=3

As an alternative you can also use a QR Code:  

The GUIDs for individual cells are displayed in the table below:

Regression: ln S.E.(k) = alpha + beta * ln Mean(k)
alpha7.84722238963659
beta0.24095085151804
S.D.0.171318514248242
T-STAT1.40644957478968
p-value0.170592819644521
Lambda0.75904914848196


Parameters (Session):
par1 = 4 ;
Parameters (R input):
par1 = 4 ;
R code (references can be found in the software module):
par1 <- as.numeric(par1)
(n <- length(x))
(np <- floor(n / par1))
arr <- array(NA,dim=c(par1,np))
j <- 0
k <- 1
for (i in 1:(np*par1))
{
j = j + 1
arr[j,k] <- x[i]
if (j == par1) {
j = 0
k=k+1
}
}
arr
arr.mean <- array(NA,dim=np)
arr.sd <- array(NA,dim=np)
arr.range <- array(NA,dim=np)
for (j in 1:np)
{
arr.mean[j] <- mean(arr[,j],na.rm=TRUE)
arr.sd[j] <- sd(arr[,j],na.rm=TRUE)
arr.range[j] <- max(arr[,j],na.rm=TRUE) - min(arr[,j],na.rm=TRUE)
}
arr.mean
arr.sd
arr.range
(lm1 <- lm(arr.sd~arr.mean))
(lnlm1 <- lm(log(arr.sd)~log(arr.mean)))
(lm2 <- lm(arr.range~arr.mean))
bitmap(file='test1.png')
plot(arr.mean,arr.sd,main='Standard Deviation-Mean Plot',xlab='mean',ylab='standard deviation')
dev.off()
bitmap(file='test2.png')
plot(arr.mean,arr.range,main='Range-Mean Plot',xlab='mean',ylab='range')
dev.off()
load(file='createtable')
a<-table.start()
a<-table.row.start(a)
a<-table.element(a,'Standard Deviation-Mean Plot',4,TRUE)
a<-table.row.end(a)
a<-table.row.start(a)
a<-table.element(a,'Section',header=TRUE)
a<-table.element(a,'Mean',header=TRUE)
a<-table.element(a,'Standard Deviation',header=TRUE)
a<-table.element(a,'Range',header=TRUE)
a<-table.row.end(a)
for (j in 1:np) {
a<-table.row.start(a)
a<-table.element(a,j,header=TRUE)
a<-table.element(a,arr.mean[j])
a<-table.element(a,arr.sd[j] )
a<-table.element(a,arr.range[j] )
a<-table.row.end(a)
}
a<-table.end(a)
table.save(a,file='mytable.tab')
a<-table.start()
a<-table.row.start(a)
a<-table.element(a,'Regression: S.E.(k) = alpha + beta * Mean(k)',2,TRUE)
a<-table.row.end(a)
a<-table.row.start(a)
a<-table.element(a,'alpha',header=TRUE)
a<-table.element(a,lm1$coefficients[[1]])
a<-table.row.end(a)
a<-table.row.start(a)
a<-table.element(a,'beta',header=TRUE)
a<-table.element(a,lm1$coefficients[[2]])
a<-table.row.end(a)
a<-table.row.start(a)
a<-table.element(a,'S.D.',header=TRUE)
a<-table.element(a,summary(lm1)$coefficients[2,2])
a<-table.row.end(a)
a<-table.row.start(a)
a<-table.element(a,'T-STAT',header=TRUE)
a<-table.element(a,summary(lm1)$coefficients[2,3])
a<-table.row.end(a)
a<-table.row.start(a)
a<-table.element(a,'p-value',header=TRUE)
a<-table.element(a,summary(lm1)$coefficients[2,4])
a<-table.row.end(a)
a<-table.end(a)
table.save(a,file='mytable1.tab')
a<-table.start()
a<-table.row.start(a)
a<-table.element(a,'Regression: ln S.E.(k) = alpha + beta * ln Mean(k)',2,TRUE)
a<-table.row.end(a)
a<-table.row.start(a)
a<-table.element(a,'alpha',header=TRUE)
a<-table.element(a,lnlm1$coefficients[[1]])
a<-table.row.end(a)
a<-table.row.start(a)
a<-table.element(a,'beta',header=TRUE)
a<-table.element(a,lnlm1$coefficients[[2]])
a<-table.row.end(a)
a<-table.row.start(a)
a<-table.element(a,'S.D.',header=TRUE)
a<-table.element(a,summary(lnlm1)$coefficients[2,2])
a<-table.row.end(a)
a<-table.row.start(a)
a<-table.element(a,'T-STAT',header=TRUE)
a<-table.element(a,summary(lnlm1)$coefficients[2,3])
a<-table.row.end(a)
a<-table.row.start(a)
a<-table.element(a,'p-value',header=TRUE)
a<-table.element(a,summary(lnlm1)$coefficients[2,4])
a<-table.row.end(a)
a<-table.row.start(a)
a<-table.element(a,'Lambda',header=TRUE)
a<-table.element(a,1-lnlm1$coefficients[[2]])
a<-table.row.end(a)
a<-table.end(a)
table.save(a,file='mytable2.tab')